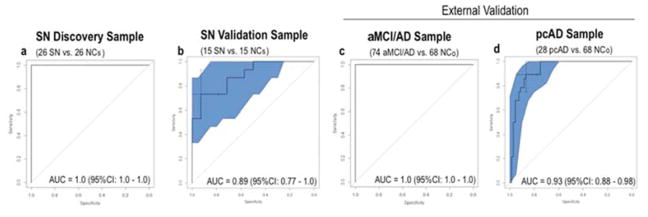
Figure 1. Results of ROC analysis using the 12-metabolite panel.
This figure shows plots of SN vs NCs ROC analysis using the 12-metabolite panel in targeted discovery (a) and validation (b) phases and application of the 12-metabolite panel to the external aMCI/AD (c) and ConverterpreAD (d) samples. 95% confidence intervals shaded in blue. Crosshair on ROC plot represents optimal ROC threshold. SN = Supernormal, NCs = Normal control for supernormal sample; aMCI/AD = amnestic mild cognitive impairment and Alzheimer’s disease; ConverterpreAD = Preclinical AD; NCo = Normal control for ConverterpreAD and aMCI/AD samples.

