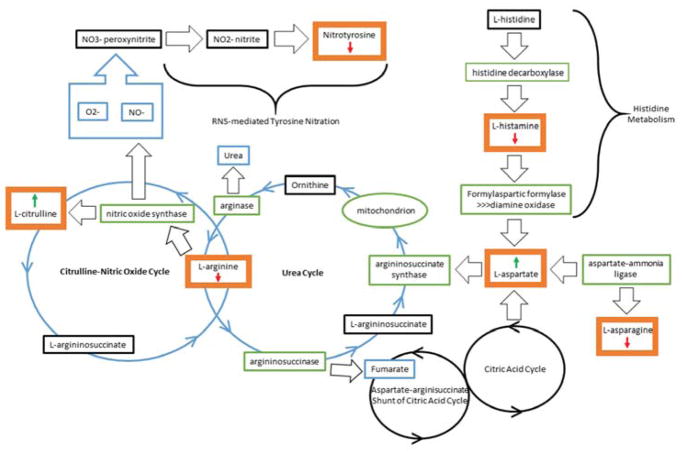
Figure 3.
Biological pathways implicated in superior memory performance. This diagram shows the pathways implicated by the metabolomic results of the SN vs NCs comparisons. The bold orange boxes show the metabolites which were significantly altered in the analysis and the arrows associated with the metabolite indicate the level of the metabolite in the SN group relative to the NCS group. For the aMCI/AD vs NCO comparison, the arrows would be reversed indicating the opposite relationship between the levels of each metabolite relative to the NCO.

