
Appendix 1—figure 7. Monitoring NAD+ and NADPH/NADP+by flow cytometry, related to Figure 4 and Table 2.
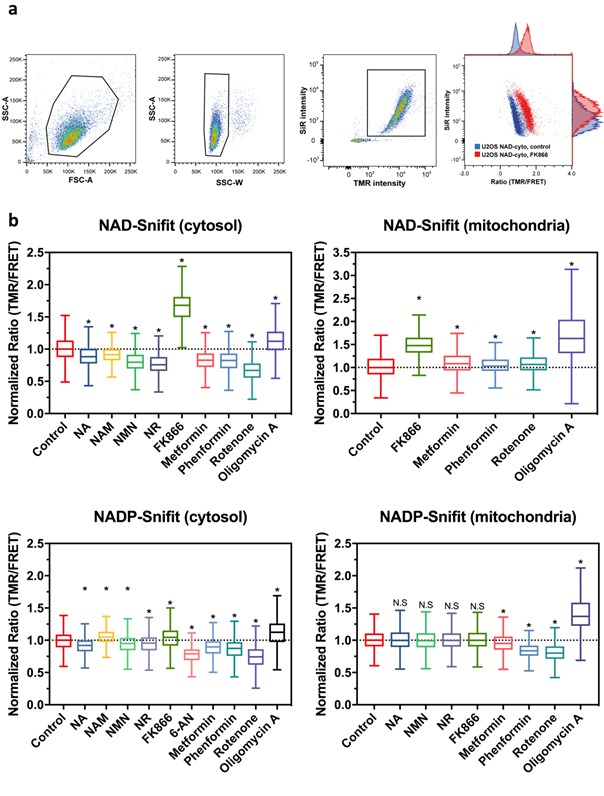
(A) Representative dot plots of the gating strategy. Live cells and singlets were gated by excluding dead cells and cellular debris (SSC-A vs FCS-A) and doublets or cell clumps (SSC-A vs SSC-W), respectively. Then, only the population of cells with sensor construct fully labeled with CP-TMR-SMX and SiR-Halo were considered for analysis. Example of FRET ratio (TMR/FRET) changes of U2OS cell populations treated for 24 hr with 100 nM of the non-competitive NAMPT inhibitor FK866 (red, significantly increasing the ratio TMR/FRET (i.e. decrease NAD+ level)) compared to the untreated cells (control, blue) (n = 7000 gated cells per condition). (B) Flow cytometry data of cytosolic and mitochondrial NAD(P)-Snifits in U2OS cells after 24 hr incubations under the conditions specified. 1 mM NA, 10 mM NAM, 1 mM NR, 100 nM FK866, 1 mM 6-AN, 1 mM Metformin, 1 mM Phenformin, 10 μM Rotenone and 25 μM Oligomycin A. The results represent the sensor responses measured as FRET ratio (TMR/FRET) normalized to the untreated cell population. The Tukey-style box plots represent the 25th and 75th percentiles at the lower and upper box limits and the median as the middle bar. The whiskers extend to ± 1.5 x IQR beyond the limits of the boxes, respectively. The position of the mean is indicated by a solid square. The data represent one data set for each condition (n = 2000–7000 events). * p<0.05 (Kruskal-Wallis with Dunn’s post-hoc multiple comparison test with respect to control conditions), n.s. = not significant.