

The functions of epithelial tissues are dictated by the types, abundance, and distribution of the differentiated cells they contain. Attempts to restore tissue function after damage require knowledge of how physiological tasks are distributed among cell types, and how cell states vary between homeostasis, injury/repair, and disease. In the conducting airway, a heterogeneous basal cell population gives rise to specialized luminal cells that perform mucociliary clearance1. We performed single cell profiling of human bronchial epithelial cells and mouse tracheal epithelial cells to obtain a comprehensive picture of cell types in the conducting airway and their behavior in homeostasis and regeneration. Our analysis reveals cell states that represent known and novel cell populations, delineates their heterogeneity, and identifies distinct differentiation trajectories during homeostasis and tissue repair. Finally, we identified a novel, rare cell type, which we call the ‘pulmonary ionocyte’, that co-expresses FOXI1, multiple subunits of the V-ATPase, and CFTR, the gene mutated in cystic fibrosis (CF). Using immunofluorescence, signaling pathway modulation, and electrophysiology, we show that Notch signaling is necessary and FOXI1 expression sufficient to drive the production of the pulmonary ionocyte, and that the pulmonary ionocyte is a major source of CFTR activity in the conducting airway epithelium.
The conducting airway is lined by a pseudostratified epithelium consisting of basal, secretory and ciliated cells, as well as rare pulmonary neuroendocrine cells (PNECs) and brush cells2. Studies of lineage tracing and regeneration post-injury show that basal cells are a heterogeneous population containing the epithelial stem cells3,4. Basal cells differ in their expression of cytokeratins 14 and 8 (Krt14 and Krt8) and luminal cell fate determinants that are upregulated upon injury2,5. To identify the full repertoire of basal cell molecular states, and to identify candidate gene expression programs that might bias basal cells to self-renew or to adopt differentiated fates, we performed single-cell RNA profiling on airway epithelial cells. We also sought to elucidate the molecular composition of rare PNECs and brush cells, which have fewer lineage markers and are harder to define functionally6,7. Because our approach is unbiased and comprehensive, it could also identify new cell types with a role in mucociliary clearance.
We performed single-cell RNA-seq8 (scRNA-seq) on 7,662 mouse tracheal epithelial cells and 2,970 primary human bronchial epithelial cells (HBECs) differentiated at an air-liquid-interface (ALI)9 (Fig. 1a,b). As there are well-documented differences between mouse and human airways10, using these two systems allows comparative analyses and prioritization of common findings between mouse and human. This also provided in vivo validation of findings in the culture model, which lacks non-epithelial cells and uses defined culture conditions. A similar analysis of mouse tracheal epithelial cells in a co-submitted paper (Montoro et al., co-submitted) corroborates many of our findings.
Figure 1: Single-cell RNA-seq of proximal airway epithelial cells in mouse and human.

a, Mouse tracheal epithelial cells were isolated, dissociated and collected for inDrops scRNA-seq. Human bronchial epithelial cells (HBECs) were cultured for 1 week submerged, followed by 2 weeks at an air-liquid-interface (ALI) and collected for scRNA-seq. b, Mouse tracheal epithelium (n=3 mice) and differentiated HBEC culture (n=3 donors) are pseudostratified, containing basal cells (KRT5) secretory cells (Scgb1a1 in mouse; MUC5B in human), and ciliated cells (AcTub, Acetylated αTubulin). Scale bars, 20μm. c,d, SPRING plots of scRNA-seq data for mouse tracheal epithelial cells (n=4 mice, 7,662 cells) (c) and HBECs (n=3 donors, 2,970 cells) (d) colored by inferred cell type, with heat maps of lineage-specific genes by biological replicates (rows). Cell numbers are post quality control. PNEC=pulmonary neuroendocrine cells. Lineage markers for PNECs and brush cells were expressed in rare cells in HBEC cultures, and formed just one human cluster.
We visualized the single cell data using a graph-based algorithm (SPRING11) that conserves neighboring relationships of gene expression, facilitating analysis of differentiation trajectories. The resulting graphs revealed a non-uniform continuum structure spanning basal-to-luminal differentiation, with rare gene expression states representing satellite clusters (see ‘Data availability’). Using spectral clustering, we partitioned cells into populations with specific, reproducible gene expression signatures (Fig. 1c,d). Based on enrichment of previously annotated markers (Supplementary tables 1, 2), we identified clusters in mouse (Fig. 1c) and human (Fig. 1d) which represented known cell types2,7: basal, secretory, ciliated, brush and PNECs. We performed pairwise correlation analysis as a measure of relatedness between clusters, and curated a list of transcription factors, surface molecules and kinases expressed in each cluster (Extended Data Fig. 1, Supplementary Tables 1-3). Our analysis confirmed previous findings5,12–14 that basal and secretory populations are heterogeneous, and uncovered additional molecular heterogeneity (Extended Data Fig. 2, 3). Basal cells formed a continuum of states defined by gene modules associated with a basal-to-luminal gene expression axis (Krt5 vs Krt8) as well as by variable expression of genes associated with basement membrane deposition and remodeling. In both mouse and human, Col17a1/COL17A1 and Igfp family members (Igfp3/IGFBP6) correlated with the basal cell sub-population marker Krt14, while in mouse an independent Krt14- module associated with basal cell adhesion molecule Bcam and with Decorin Dcn, which regulates collagen fibrilogenesis. Among secretory cells, many differences were associated with different levels of maturity, with the least mature cells expressing basal cell transcripts (e.g. Krt5/KRT5 and Trp63/TP63), and the most mature expressing Muc5b/MUC5B. Yet secretory cells also differed in other ways. In human, one cluster associated with antigen presentation (HLA gene family members). In mouse, the secretory cells appeared to associate with two distinct trajectories from the basal layer: those expressing Krt4, and those emerging from a Krt4-low state marked by Trp63, Bcam and Dcn. Heterogeneity of both basal and secretory cells was also associated with tens of other genes with diverse functions, including signaling molecules (e.g., Wnt10a) and early specifiers of mature lineages (e.g., FoxJ1) (Extended Data Fig. 2, 3).
Our analysis also revealed gene signatures of epithelial cell states not previously described. First, the paired cytokeratins 4 and 13 (Krt4/13) defined a unique cluster in the mouse dataset located between basal and secretory, suggesting this may be a transitional cell state (Fig. 1c, Supplementary Table 1). Immunofluorescence for Krt4 in mouse tracheal epithelium demonstrated that it was co-enriched in subsets of Krt5+ basal cells, Krt8+ luminal cells and Scgb1a1+ club (secretory) cells, but not in Foxj1+ ciliated cells (Extended Data Fig. 4a). This pattern is reminiscent of the proposed model for basal luminal precursors (BLPs), a subset of non-transit amplifying basal cells with upregulated luminal markers13. In addition, KRT4/13 expression was closely correlated and defined a major axis of heterogeneity in basal and differentiating HBECs (Extended Data Fig. 3b).
Second, in the human single cell map, we identified a FOXN4+ cluster that was highly enriched for the ciliated cell specification factor FOXJ1 but low for markers of maturation, including the ciliary component TUBB4B (Fig. 1d, Supplementary Table 2). Foxn4 is known to drive robust transcription of ciliated genes during multiciliated cell differentiation in Xenopus15, suggesting that this cluster represents a state of multiciliated cell differentiation. We confirmed the existence of this cluster by immunofluorescence, showing that FOXN4 was indeed enriched in a subset of FOXJ1hi cells but not in cells containing mature cilia (Extended Data Fig. 4b). Third, in the human data we identified a novel cluster enriched for SLC16A7 (Fig. 1d, Supplementary Table 2), which encodes the monocarboxylate transporter 2 (MCT2) previously shown to be involved in acidification of CF HBEC cultures16, as well as AIRE, the gene that drives negative selection of self-reactive T cells in thymic epithelium17. This cluster contained the largest number of highly specific genes in the dataset, with a greater percentage of mitochondrial genes. This cluster may reflect cellular stress18 or may represent a unique antigen-presenting airway epithelial cell.
Finally, a single cluster identified in both mouse and human was enriched for ion transporters and the transcription factors Foxi1, Ascl3 and Tfcp2l1 (Fig. 1c,d, Supplementary Tables 1,2). The novel cluster expressed subunits of the Vacuolar ATPase (V-ATPase) proton pump, which are also expressed in Foxi1-expressing ionocytes in the mucociliary epithelium of Xenopus larval skin, intercalated cells of the mammalian kidney and in forkhead-related (FORE) cells of the inner ear19,20. This cluster was highly enriched for Cftr, the gene that encodes a critical chloride channel that is mutated in CF, as well as for genes encoding multiple ClC chloride channels (e.g., NKCC1, ClC-Kb), the calcium-activated potassium channel KCNMA1, and members of the Slc9 family of Na+/H+ exchangers (Nhe4 in mouse and NHE7 in human). We named these cells pulmonary ionocytes.
To further identify cell states in the conducting airway that may emerge or expand following injury, we performed scRNA-seq and immunofluorescence on regenerating tracheas at 1, 2, 3, and 7 days after polidocanol-induced injury (Fig. 2a). We again visualized cell transcriptomes using a SPRING graph, now expanded to 14,163 cells to reveal detailed changes in epithelial cell states during repair (Fig. 2b). This identified two states specific to injury response (Extended Data Fig. 5a, methods). The first state appeared at 1 dpi (Fig. 2b,c light gray), corresponding to Krt5+ basal cells in cycle and co-expressing additional cytokeratins including Krt14, Krt8, and Krt4/13, which were largely non-overlapping in homeostasis (Fig. 2d). The second injury-specific state, which appeared 2 and 3 dpi, included cells transiting directly from basal to ciliated (Fig. 2b,c dark gray) rather than differentiating through a secretory progenitor (Fig. 1a). We detected 1,237 genes varying in expression during multiciliated cell differentiation, including the specification factors Foxj1, Myb and Mcidas21 (Extended Data Fig. 6, Supplementary Table 4). Early secretory cell states also reappeared at 2 and 3 dpi. By 7 dpi, the relative abundance of cell populations, including rare populations (PNECs, brush cells and pulmonary ionocytes) largely returned to that seen in uninjured tracheae (Fig. 2c, Extended Data Fig. 5b).
Figure 2: Single-cell RNA-seq reveals recovery specific cell states.
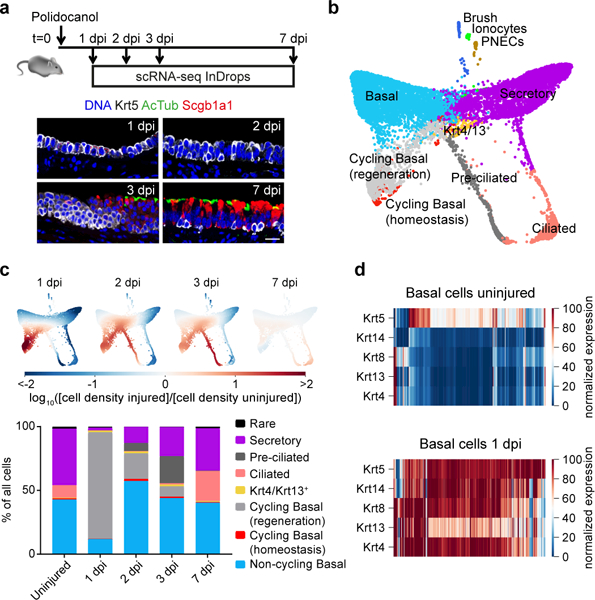
a, Mice were administered 2% polidocanol by oralpharyngeal aspiration and tracheae were collected 1 (n=1), 2 (n=1), 3 (n=1), and 7 (n=3) days post injury (dpi) for scRNA-seq. Immunofluorescence for basal cells (Krt5) and lumenal markers (AcTub and Scgb1a1) shows lumenal lineages are shed 1dpi (n=3), basal population expands 2dpi (n=4), mature lumenal markers are visible 3dpi (n=3) and the differentiated epithelium is restored by 7dpi (compare to Fig 1b; n=3). b, SPRING plot of scRNA-seq data showing cells from uninjured (n=7,898) and regenerating (n=6,265) mice. Cell states that emerge during regeneration are shown in gray (see Extended data Fig. 5a, methods). c, Top: Enrichment of scRNA-Seq cell states compared to uninjured; Bottom: the relative abundance of cell types at each time point. Rare = ionocytes, brush, and PNECs. d, Keratin gene expression patterns in basal cells alter between uninjured trachea and 1dpi. The heat maps show imputed expression counts, with range 5th to 95th percentile. Basal and Krt4/Krt13+ cluster cells shown.
Our data open up a range of possible avenues for future research, from the significance of the gene modules defining basal and secretory cell heterogeneity, to the catalog of potential regulators and components for rare PNEC and brush cells, premature ciliated cells, Krt4/Krt13+ cells, and pulmonary ionocytes. In this study, we focus on the localization, specification and function of the newly identified pulmonary ionocyte.
We first validated the presence of the pulmonary ionocyte population by immunofluorescence. FOXI1 labeled 1–2% of HBECs and, as predicted, was distinct from basal cells (TP63), secretory cells (MUC5B), ciliated cells (FOXJ1) or neuroendocrine cells (ASCL1) (Fig. 3a). Immunostaining demonstrated apical enrichment of the V-ATPase in FOXI1+ HBECs, similar to what has been shown for other Foxi1+ epithelial lineages19,20,22, as well as Nerve Growth Factor Receptor (NGFR, Extended Data Fig. 4c), confirming the marker gene enrichment identified by scRNA-seq (Extended Data Fig. 1b). Also as predicted, CFTR mRNA was highly enriched in Foxi1-expressing cells in mouse trachea and primary human bronchial tissue (Fig. 3b), compared to low expression throughout the epithelium (Extended data Fig. 7c,d). Interestingly, FOXI1+ cells were more concentrated in bronchial gland ducts than in the surface epithelium (Extended data Fig. 7d), a pattern similar to previously described rare, CFTR-high cells23.
Figure 3: FOXI1 specifies a novel cell type, the CFTR-rich ‘pulmonary ionocyte’.

a, Immunofluorescence for FOXI1 (red, arrow), and airway lineage markers (green, arrowheads); TP63 (basal), FOXJ1 (ciliated), MUC5B (secretory) and ASCL1 (PNEC) in differentiated HBEC cultures (n=3 donors). b, Fluorescent in situ hybridization (RNAscope®) in mouse tracheal epithelium (n=3 mice) and human bronchial epithelium (n=2 donors) for FOXI1 (red) and CFTR (green). c, HBECs were transduced at seeding with GFP or GFP:FOXI1 lentivirus, differentiated and then profiled by scRNAseq or analyzed by immunofluorescence (IF). d, Immunofluorescence for ATP6V1B1 (white) and FOXI1 (red) in HBECs transduced with GFP or GFP:FOXI1 (n=4 experiments from two donors). Scale bars, 20μm. e,f, Fold-change in fractions of cell states revealed by scRNA-seq in GFP:FOXI1 vs. GFP. Heatmap values correspond to the ratio of cell numbers from the viral transduction experiments projecting onto each point of the reference HBEC data set from Fig. 1b. Extended Data Fig. 8e extends to populations specific to viral transduction. g, Ionocytes induced by GFP:FOXI1 are transcriptionally similar to natural ionocytes, shown by comparing their gene expression in scRNA-seq data from three experimental conditions (Reference data from Fig. 1d). The genes shown are markers of each epithelial cell type (bottom), with ionocyte markers shown in detail (top). Genes are normalized to the median expression level across populations observed in a given condition.
In other proton-secreting cells Foxi1 specifies the lineage and regulates expression of V-ATPase subunits19,20; therefore, we next asked whether FOXI1 was sufficient to specify pulmonary ionocytes in HBEC cultures. We performed scRNA-seq of cells transduced with GFP:FOXI1 (n=10,330) or GFP alone (n=9,436) and mapped the data onto the reference HBEC state map (Fig. 3e, Extended Data Fig. 8a-e). Cultures transduced with GFP:FOXI1 had significantly higher numbers of cells classified as ionocytes (23-fold increase, p < 10−50 by Fisher’s Exact test, Fig. 3e,f), with slight reductions in basal and ciliated cells. The resulting ionocytes expressed high levels of exogenous GFP:FOXI1 (Fig. 3g, Extended Data Fig. 8f), and showed the same transcriptional program as unperturbed ionocytes. Moreover they did not express markers of other cell types (Fig. 3g). Immunostaining (Fig. 3d), qPCR profiling of marker genes, and RNA in situ hybridization performed on transduced cultures (Extended Data Fig. 7a-c) confirmed these results, indicating that FOXI1 is sufficient to specify CFTR-rich pulmonary ionocytes. FOXI1 over-expression also led to appearance of a novel non-ionocyte cell state, possibly resulting from off-target FOXI1 transcriptional activity (Extended Data Fig. 8c,d, Supplementary Table 3).
In Xenopus epidermis, ionocytes differentiate from an inner layer of basal cells, and their specification is regulated by Notch signaling20,22, a pathway important in airway basal cell fate24–26. The specification of pulmonary ionocytes shows clear similarities. Foxi1+ cells first reappear in the basal cell pool following injury depletion (Extended Data Fig. 5c), and Foxi1 co-localization with the basal cell marker Krt5 transiently increased after injury (46.3% of Foxi1+ cells at 3dpi compared to 15.4% at steady-state; Fig. 4a). This suggests that Foxi1+ cells have a direct basal cell origin, consistent with steady-state lineage tracing studies in Montoro et al. (co-submitted). Notch target genes are also expressed in pulmonary ionocytes (Extended Data Fig. 9). Treating HBEC cultures with the gamma secretase inhibitor DAPT decreased Notch target gene expression and increased ciliated cell specification, consistent with previous studies that modulated Notch signaling in mouse and human airway cultures27 (Extended Data Fig. 10a). DAPT treatment also significantly decreased the number of ionocytes (Fig. 4b). Treating HBEC cultures with antibodies against individual Notch receptors also reduced ionocyte numbers (Extended Data Fig. 10b).
Figure 4: Pulmonary ionocytes are a major source of CFTR activity.

a, Immunofluorescence for Krt5 (green) and Foxi1 (red) in mouse tracheae at homeostasis (left, n=3) or 3 days post injury (right, n=3). Arrowhead: Foxi1+Krt5+ cells. Arrow: Foxi1+Krt5- cell. Scale bars, 20μm. b, Immunofluorescence and quantification for ionocytes (FOXI1+, red, arrowheads) and ciliated cells (FOXJ1+, green) in HBEC cultures treated with DMSO or DAPT, scale bar, 100 μm, (n=4 experiments in one donor). *p-value=0.01, ***p-value=1.1×10⁻⁶ by two-tailed t-test c, HBECs were treated with DMSO or DAPT upon culture at ALI. After differentiation (2–3 weeks), cultures were loaded into Ussing chambers and short circuit current (Isc) was recorded during addition of Amiloride, Forskolin, and a CFTR-inhibitor, CFTR(inh)-172. Shown is a representative tracing from Donor 1 (n=11). d, Change in short circuit current (ΔIsc) in response to Forskolin measured in DMSO (n=7 cultures per donor) and DAPT-treated cultures, (n=8 cultures per donor). ***p-value<1×10⁻⁸ by two-tailed t-test. e, Donor mean ΔIsc in response to Forskolin plotted against mean number of ionocytes (FOXI1+) or ciliated cells (FOXJ1+) (n=7). All data are mean ± SEM. R = Pearson correlation with associated p-value. n.s., not significant.
We next investigated the functional significance of the highly abundant CFTR expression in pulmonary ionocytes. Ciliated cells have been proposed as the major source of CFTR in the proximal airway28 but we found little to no CFTR expression in FOXJ1+ ciliated cells (Supplementary Table 2, Extended data Fig. 7e). To examine CFTR activity in the proximal airway epithelium, we recorded CFTR-mediated ion transport in HBEC cultures using Ussing chambers29 (Fig. 4c). DAPT-treated cultures, which reduce the number of ionocytes and increase the number of ciliated cells, had significantly lower CFTR activity in response to forskolin (ΔIsc, Fig 4d). We also used natural variation between donors to assess the sensitivity of CFTR activity to changes in ionocyte numbers versus changes in ciliated cell numbers. Ussing experiments and cell-type quantification in cultures derived from seven different donors showed that CFTR activity was positively correlated with ionocyte number (Pearson R=0.83, p-value 0.02) and not correlated with ciliated cell number (R=0.44, p=0.32), with ionocytes explaining 60% of the mean channel current compared to just 4% for ciliated cells (after multivariate regression) (Fig. 4e). These data suggest that ionocytes are a major source of CFTR activity in airway epithelium despite representing only 1–2% of epithelial cells.
In this study, we applied large-scale single cell profiling to take an unbiased look at the composition of the proximal airway epithelium during homeostasis and regeneration. By doing so we unexpectedly identified a rare cell type, the pulmonary ionocyte, that appears to be a major, possibly dominant, source of CFTR activity in airway epithelium. This cell type shows co-enrichment of the proton-secreting V-ATPase and the anion-secreting CFTR channel, suggesting a role in luminal pH regulation that could be relevant for CF pathology30. The role of these CFTR-rich cells in airway physiology and disease remains to be elucidated, but it is likely that their identification will better inform future therapeutics for cystic fibrosis. Finally, our study provides a comprehensive atlas of genes and pathways with potential roles in promoting differentiation and repair, delineates the cell types, transcriptional profiles and trajectories present in the proximal airway in both homeostatic and regenerating tissues, and offers a baseline for future profiling of disease states.
Methods
HBEC Culture and Notch inhibition.
Primary human bronchial epithelial cells (HBECs) from normal donors aged 3–60 were obtained from Lonza (CC-2540; Donor 1 #221175; Donor 2 #323353; Donor 3 #429581; Donor 4 #105104) and were expanded twice with growth medium (500ml of BEGM medium (Lonza, CC-3171), 1 SingleQuots kit (Lonza, CC-4175)) in T75 flasks. After expansion, HBECs were seeded on 12-well Transwell® plates (Corning, 3460) at a density of 83,000 cells/Transwell®. The cells were cultured in differentiation medium (250ml of BEGM medium, 250 ml of DMEM medium (ThermoFisher, 11965092), 1 SingleQuots kit) on both apical and basal sides of transwells for the first 7 days. Then, medium was removed from apical side, and cells were cultured for another two weeks at an air-liquid-interface condition. Cells were used for analysis after culture at ALI for 14 days (14d) and no more than 28d.
Notch signaling was inhibited by adding 3.3 μM DAPT or DMSO to differentiation media when HBECs were cultured at ALI. Notch antibodies against receptors N1, N2 and N3 and control IgG antibody were described previously26,31–33 and were added at a concentration of 10 µg/mL to HBECs upon culture at ALI.
Single Cell Dissociation.
HBECs were harvested at 15d ALI using 0.05% Trypsin-EDTA (ThermoFisher, 25300054). Cells were then pelleted at 300g for 5 min, resuspended in PBS and filtered through a 20 μm strainer (PluriSelect, 43–50020–03). Cells were counted on a hemocytometer and Optiprep (Sigma-Aldrich, D1556) was added to achieve a final concentration of 15% and 75,000 cells/mL.
C57/BL6 mice from the Jackson Laboratory aged 6–8 wk were used for all studies. Animals were handled in accordance with Novartis Institutes for Biomedical Research Animal Care and Use Committee protocols and regulations. Mice were housed in a temperature- and humidity-controlled animal facility with ad libitum access to food and water and acclimated for at least 3 d before experimental manipulation. For single-cell isolation for scRNA-seq, tracheas were dissected and opened longitudinally in Ham’s F12 (Life Technologies, 11765–054) plus 1% Pen-Strep on ice. Each trachea was individually placed in a 15 mL conical tube with 5 mL of 1.5 mg/mL Pronase (Roche, 10165921001) in Ham’s F12 plus 1% Pen-Strep and incubated for 18h at 4°C. 500 mL FBS was added to inactivate pronase and conical tubes were vigorously inverted to dislodge cells. Each trachea was transferred twice to a 15 mL conical tube containing Ham’s F12 plus 1% Pen-Strep plus 10% FBS and then inverted. Media from each of the three tubes was pooled and cells were pelleted at 400g for 10 min at 4°C. Cells were resuspended in 500 µL DNase (Sigma-Aldrich, DN25), incubated on ice for 5 min and then pelleted at 400g for 10 min at 4°C. Cells were then washed twice in Hams F12 1% Pen-Strep 10% FBS and then resuspended in PBS + 0.02% BSA. Cells were diluted to 90,000 cells/mL in 15% Optiprep + 0.02% BSA in PBS for scRNA-seq.
Single cell transcriptome barcoding in drops and library preparation for Illumina sequencing.
For scRNAseq, we used inDrops8 following the protocol previously described34 with the modifications summarized in Supplementary Table 5. Briefly, dissociated single cells were co-encapsulated into 3–4 nl droplets together with hydrogel beads carrying barcoding reverse transcription (RT) primers. Following a reverse transcription in droplets, the emulsion was broken and the bulk material was taken through the following steps: i) second strand synthesis; ii) linear amplification by in vitro transcription (IVT); iii) amplified RNA fragmentation; iv) reverse transcription; v) PCR. A sub-set of the GFP:FOXI1 libraries were processed using small variations on the published protocol, including a different RT enzyme, and exclusion of HinfI digestion. The resulting libraries were sequenced either on a HiSeq or Nextseq Illumina platform in paired-end mode to a length of 2×100 or 2×76 base pairs (see Supplementary Table 5). Images from the instrument were processed using the manufacturer’s software to generate FASTQ sequence files. Read quality was assessed by running FASTQC (version 0.10.1)
Obtaining transgene counts in cells transduced with lentivirus.
The single cell RNAseq method we used allows the detection of transcript sequences up to ~1kb upstream of the polyA tail. Both GFP and GFP:FOXI1 transcripts share the same 1.3kb long sequence upstream of the transcription termination and polyadenylation site within the lentiviral 3’ long terminal repeat (LTR). This 1.3kb sequence, which is part of the plenti6/V5-DEST.NGFP Gateway® scaffold, was added to the reference transcriptome to identify transgene counts. Notably, “transgene” refers to either GFP:FOXI1 or GFP, depending on the dataset. In Fig. 3g, the “transgene” was added manually to the heatmap (top), as was FOXJ1 (bottom heatmap), a canonical marker of multiciliated cells that fails to appear as a unique marker gene because of its expression in the FOXN4+ cluster.
Single cell RNAseq data analysis Processing of sequencing reads.
To generate per-cell gene expression counts from raw sequencing reads, we used an updated and publicly available version (github.com/indrops) of the custom sequencing data processing pipeline described8. Parameters used with the indrop.py pipeline are specified in yaml files provided as Supplementary Files 1 and 2. Briefly, raw reads (fastq) were filtered for sequencing quality and expected structure, sorted based on barcodes sequences (reads derived from the transcriptome of the same cell carry the same barcode), and aligned to either mm10 or hg19 cDNA reference with separately added mitochondrial cDNA sequences. To quantify gene expression while correcting for amplification biases, we made use of unique molecular identifiers (UMIs) introduced during RT in drops. The output of low-level processing is a genes x cells expression matrix.
Single cell data cleanup and normalization.
To ensure high quality data for further analysis, we filtered out cells with few counts and a high mitochondrial gene fraction. Thresholds were selected by visually inspecting histograms of counts per cell and mitochondrial fraction per cell for each biological sample separately. With human samples, a mitochondrial fraction threshold of 25% and total count thresholds of 1500, 1500, and 2000 were used for donor 1, 2, and 3, respectively. Same thresholds as for donors 1 were used in the GFP/GFP:FOXI1 overexpression experiment. For mouse, a mitochondrial fraction threshold of 20% and total count thresholds of 1500 were used for all data sets. Initial visualization and clustering (see below) revealed that a small fraction of mouse cells (<4%) formed well separated clusters characterized by a strong immune gene signature. These cells were excluded from further analysis. For uninjured mouse data, we applied an additional clean up step to remove cell doublets, which can occur rarely due to incomplete cell dissociation or due to two cells occasionally entering the same microfluidic barcoding droplet. Briefly, a decoy training set of simulated doublets is generated by randomly combining single cell transcriptomes from the data set. This decoy training set is used to train a k-nearest neighbor classifier. Cell transcriptomes classified as in silico doublets were excluded from further analysis. The detailed method will be published elsewhere. Data was then normalized by the total counts per cell, as described in8, with the following modification: to calculate the normalization factor (total counts per cell) we excluded any gene with expression level >5% of total counts in at least one cell.
Data visualization using SPRING and clustering.
To visualize the high dimensional gene expression data, we applied SPRING11, a method for building a k nearest neighbors (kNN) graph of cells and representing it in 2D using a force directed layout. Clusters were identified by applying spectral clustering on the same adjacency matrix as used for SPRING (implementation in python, sklearn.cluster.SpectralClustering(affinity=‘precomputed’, assign_labels=‘discretize’)). Clusters were assigned labels (e.g., secretory, basal) based on marker gene expression. In the SPRING plot of human data (Fig. 1), clusters representing intermediate states with no unique gene expression are shown in gray.
Cell population-specific gene identification (Fig. 1).
To be considered as specific to population i, a gene had to satisfy the following criteria:
Be statistically significantly higher in population i compared to all other cells as determined by a two-sided permutation test using the difference in sample means as the test statistic (FDR<5%). To be considered for statistical testing, a gene had to be detected in a least 1% of cells on either side of the comparison.
Average expression >50 TPM in population i.
Average expression in population i at least 1.5-fold higher than in any other population (i.e., max-to-second-max ratio > 1.5). At pseudo value of 10 TPM was added before division.
Be max in population i for 4/4 (mouse) or 2/3 (human) of the biological replicates.
Fig. 1c-d shows the expression level of the top 50 such hits ordered by decreasing max-to-second-max ratio. For each gene, 100% was set at the maximum expression per cluster (average of all replicates). The color was saturated at 20% (low) and 100% (high). Detailed gene lists are provided as Supplementary Tables 1-3.
For Extended Data Fig. 1, transcription factor (TF) lists were obtained from animaltfDB35, and GO terms GO:0016301 and GO:0009986, including any descendent terms, were used for kinases and surface molecules, respectively.
Identification of correlated gene modules within basal and secretory cells
To characterize the heterogeneity within basal and secretory cells, we identified modules of correlated genes. For mouse, we performed the following steps (see also Extended Data Figures 2 and 3):
Select basal cells (same procedure for secretory).
Identify 3000–5000 most variable genes.
Calculate gene-gene rank correlation.
Retain genes with r>0.2 with at least 4 other genes. In mouse, Krt14 did not meet this criterion therefore was included manually.
Heat map rows and columns (Extended Data Figures 2 and 3) were hierarchically clustered (distance defined as 1-rSpearman, Ward linkage). For human data, we first considered the basal, secretory, and intermediate state cells collectively to identify two main modules of anti-correlated genes (Extended Data Figure 3). From there, we selected genes specific to basal and recalculated gene-gene correlation but within basal cells only. The same was performed with secretory.
Smoothing (data imputation)
Smoothing was carried in Fig. 2c,d, and Extended Data Figures 5a and 9. All data shown in other figures is not subject to smoothing/imputation. Data smoothing, or equivalently imputation, was carried out using a graph diffusion approach on the k-nearest neighbor graph G defined above by SPRING. G is an unweighted undirected graph. The smoothing operation replaces a scalar quantity xi on node i of the graph, e.g., raw expression level of a gene, with a smoothed value x(s) = Osx, where the smoothing operator is Os = eLβ and L is the random walk graph Laplacian of G. The smoothing operator accepts a single parameter, β,which determines the kernel size, i.e., the extent of smoothing. This parameter is equivalent in physical terms to diffusion time: longer times lead to broader diffusion. For all plots shown, we used β = 1.
Analysis of cell density changes relative to uninjured
To visualize which cell populations are enriched at a given time point relative to uninjured (Fig. 2) the following was performed for every time point t of mouse recovery data:
Get every cell from t to vote for its 10 nearest neighbors among all mouse cells and count votes.
Smooth vote counts on the graph (see previous section for smoothing). Smoothed vote counts are a proxy for the density of cells from time point t on the graph (see also the two left-most plots of Extended Data Fig. 5a).
Normalize the total vote count to 1.
Divide the density at time point t by the density of cells in uninjured.
Identification of recovery-specific cell populations
The procedure is summarized in Extended Data Fig. 5a. To identify recovery specific cell populations in the SPRING plot combining all mouse data (populations in gray in Fig. 2b), we first performed steps a) and b) described in the previous paragraph to determine the density of injured cells on the graph. Next, a threshold of 25 smoothed counts was selected by visual inspection of the distribution of votes, and cells receiving fewer than 25 votes were considered depleted in uninjured (i.e., recovery-specific). Recovery-specific cells were split into two clusters by spectral clustering, and labels were assigned based on characteristic gene expression. Cells from the mouse recovery time course experiment that were not recovery-specific inherited the label of their single nearest neighbor in uninjured mouse data (Euclidean distance in principle component (PC) space of most variable genes).
Analysis of recovery-specific trajectory from basal to ciliated
The procedure is also summarized in Extended Data Fig. 6. 609 recovery-specific cells from 24–72 hours post-injury, and forming a continuum between basal and ciliated cells, were manually selected on the SPRING plot and used for Population Balance Analysis (PBA), a method developed in our lab for describing differentiation trajectories36. For this analysis, ‘source’ and ‘sink’ cell populations were defined as the basal and multiciliated tips of the cell kNN graph respectively. Cells were then ordered on the graph by the diffusion ‘potential’ parameter of PBA (a measure pseudotime of progression from source to sink). To smooth the gene expression of individual cells, a moving average with window size of 100 cells was calculated.
Identification of differentially expressed genes along the basal-to-ciliated trajectory
Temporally varying genes were identified using a previous method37 with minor changes. Prior to statistical testing, the following filters were applied on the full gene list considering only the 609 cells forming the basal-to-ciliated trajectory:
Expression level: at least 3 normalized counts in at least 3 cells.
Variable: Fano factor >1.
Notably, none of these filters considers the cell ordering. For each gene i of the surviving 4651 genes, a statistic t was calculated:
ti,observed = mi,max – mi,min, where mi is a vector with the expression level of gene i in the 510 average cells after application of a moving average over cells ordered using PBA. The procedure was repeated on shuffled cells for multiple permutations, each time resulting in a ti,random value. The one-sided p-value for gene i was defined as the fraction of times ti,observed ≥ ti,random. To account for multiple hypothesis testing, the false discovery rate was controlled at 5% using the Benjamini-Hochberg procedure. For each of the 4651 genes used in the permutation test, we also calculated the maximum fold-change defined as:
. 1237 genes with FCmax≥2 and FDR≤5% were considered differentially expressed along the basal-to-ciliated trajectory.
Polidocanol-induced injury.
Polidocanol-induced injury was performed as previously described38. Briefly, mice were anesthetized and delivered one dose of 15 μL 2% Polidacanol or PBS vehicle control by oralpharyngeal aspiration to induce injury. Tracheas were harvested at 1 day (1d), 2d, 3d and 7d following injury for scRNA-seq or for fixation and immunofluorescence.
Immunofluorescence, microscopy and cell counting.
For RNAscope® and immunofluorescence of paraffin embedded sections, mouse tracheas were dissected under sterile conditions and HBEC transwell cultures were isolated using 8mm biopsy punch (Integra Miltex, 33–37). Primary human bronchial tissue was obtained through the International Institute for the Advancement of Medicine. All tissues were immediately fixed in 10% Normal buffered formalin for 18–24 hours at room temperature (RT) then transferred to PBS and kept at 4°C until paraffin embedding.
For immunofluorescence of mouse tracheas, 5μm sections were baked and deparaffinized using standard procedures. After antigen retrieval using pH6 Citrate buffer (Abcam), sections were rinsed in PBS and blocked in 10% normal goat serum (NGS) or 10% normal donkey serum (NDS) for 30 min at RT. Primary antibody was added overnight at 4°C. Sections were washed 3X in PBS for 5 min each, and secondary antibody was added for 1h at RT and sections were again rinsed in PBS, followed by Hoechst (1:1000) for 30 sec. For RNAscope®, 5 μm sections were prepared according to RNAscope® procedures for multiplex fluorescent assay (Advanced Cell Diagnostics, 320850) or dual chromogenic assay (322430). RNAscope® probes used were FOXI1 (476351), CFTR (603291), and FOXJ1 (430921). Mounting medium and coverslip were applied and slides were stored at 4°C for immunofluorescence or RT for chromogenic ISH. For immunofluorescence of whole mount HBEC transwell cultures, cells were fixed in 4% paraformaldehyde for 30 min RT, washed 3X 10 min in IF buffer (130 mM NaCl, 7 mM Na2HPO4, 3.5 mM NaH2PO4, 7.7 mM NaN3, 0.1% bovine serum albumin, 0.2% Triton X-100, and 0.05% Tween- 20), blocked in 10% NGS IF buffer, stained in primary antibody diluted in 10% NGS IF buffer overnight at 4°C, washed 3X 20 min in IF buffer, counterstained in secondary antibody diluted in 10%NGS IF buffer plus 1:5000 Hoechst for 1h RT, washed 3X 20 min in IF buffer, and washed 2X in PBS before mounting. The following antibodies were used: rabbit anti-FOXI1 (1:200, Sigma-Aldrich HPA071469), mouse anti-FOXI1 (1:100, Origene TA800146), goat anti-FOXI1 (1:200 Abcam ab20454) rabbit anti-ATP6V1B1 (1:100, Sigma-Aldrich HPA031847), mouse anti-acetylated αtubulin (1:1000 Sigma-Aldrich T6793), rabbit anti-Scgb1a1 (1:200, Millipore 07–623), rabbit anti-MUC5B (Santa Cruz sc-20119), rabbit anti-FOXJ1 (1:200, Sigma-Aldrich HPA005714), mouse anti-FOXJ1 (EBioscience, 1:200, 14–9965-80), rabbit anti-FOXN4 (Sigma-Aldrich HPA050018), mouse anti-ASCL1 (1:00, Beckton-Dickinson 556604), mouse anti-Krt4 (1:100, abcam ab9004), rabbit anti-Krt4 (1:100 Proteintech 16572–1-AP), rabbit anti-Krt5 (1:250, abcam ab52635), chicken anti-Krt5 (1:1000, BioLegend 9059), mouse anti-NGFR (1:200, ThermoFisher, MA1–18418) and chicken anti-Krt8 (1:200, abcam ab107115). Secondary antibodies used were Alexa Fluor 488, 568, 647 (Life Technologies) at 1:500.
Fluorescent images were collected on a confocal microscope (Axiovert 200; Carl Zeiss), with a 40X objective (Zeiss, Plan-Apochromat 40X/1.3 Ph3 M27), a Yokogawa CSU-X1 spinning disc head, and an electron-multiplying charge-coupled device camera (Evolve 512; Photometrics). Scale bars were added, and images were processed using Zen Blue software (Zeiss) and Photoshop (Adobe). FOXI1+ and FOXJ1+ cells were counted using ImageJ software. Chromogenic signals were acquired using a Nuance™ FX multispectral imaging system (PerkinElmer) with an Olympus BX61 microscope interfaced with a liquid crystal based camera and tunable filter from 420 nm to 720 nm at 20 nm intervals. Spectral components were unmixed and pseudo-colored for individual channels.
Lentivirus production.
For overexpression, FOXI1 (GeneID 2299) was cloned into the plenti6/V5-DEST.NGFP Gateway® vector, which was generated by transferring the N-EmGFP ORF from pcDNA6.2/N-EmGFP-DEST (ThermoFisher, Cat# V35620) into pLenti6/V5-DEST (ThermoFisher, V49610). Lentiviral packaging 4 × 10⁶ 293T cells were seeded in a 100 mm Poly-D-Lysine coated dish (Corning® BioCoat™, 356469) one day before transfection with 14 ml of cell growth medium (DMEM (ThermoFisher, Cat# 11965092), 10% FBS (Clontech 631106), 2mM L-Glutamine (Invitrogen 25030), 0.1mM MEME Non Essential Amino Acids (Invitrogen 11140), and 1mM Sodium Pyruvate MEM (Invitorgen 11360)). For transfection, 7 μg of packaging plasmid DNA (ViraPower lentiviral Packaging Mix, ThermoFisher K497500) was mixed with 5 μg of expression construct DNA and 36 μl Fugene6 (Promega, E2691). OptiMEM (ThermoFisher, 31985062) was then added the mixture to a total volume of 800 μl. 293T cells were included with the transfection reagent mixture for 24 hours before the growth medium was refreshed. At 72 hours after transfection, virus was harvested, and frozen for future experiments. Packaged virus was added to HBEC cultures 1 hour after cell seeding and then removed at feeding the following day.
Flow cytometry and cell sorting.
Cells were harvested using 0.05% Trypsin-EDTA (ThermoFisher, 25300054), pelleted at 300g for 5 min, suspended in 2% FBS DMEM with EDTA and filtered through a 40μm strainer before being analyzed by flow cytometry or cell sorting. RNA was extracted with Trizol (Invitrogen, 15596026). cDNA was synthesized from 1 ug of RNA with qScript XLT cDNA Super Mix kit (Quanta Biosciences, 95161–100). qPCR was carried out using FastStart Universal Probe Master kit (Roche, 04914058001) with 40 ng of cDNA per reaction. Taqman probes for qPCR (Applied Biosystems) are shown below:
FOXI1, Hs00201827_m1 FOXJ1, Hs00230964_m1; P63, Hs00978340_m1; GAPDH, Hs99999905_m1; CFTR, Hs00357011_m1; ATP6V1B1, Hs00266092_m1; ITGA6, Hs01041011_m1; DNAI2, Hs01001544_m1; SCGB1A1, Hs00171092; MUC5B, Hs00861588_m1; NRARP, Hs01104102_s1; HES5, Hs01387464_g1; HES1, Hs00172878_m1; MUC5AC, Hs01365601_m1
Short-circuit current (Isc) measurements in Ussing Chambers.
For Ussing studies, HBECs were cultured in 6-well Snapwell® plates (Corning, 3801) at a density of 83,000 cells/Snapwell®. Snapwell inserts containing differentiated HBECs were then mounted in chambers bathed in Buffer (Kreb’s Ringer Solution; 400 mL H2O, 25 mL 2.4M NaCl, 25 mL 0.5M NaHCO3, 25 mL 66.6M KH2PO4 + 16.6 mM K2HPO4, 25 mL 24 mM CaCl2 + 24 mM MgCl2, .9g Dextrose). Amiloride (Sigma, A9561) was added apically at 10μM to inhibit Na+ absorption, then Forskolin (Sigma, F6886) was added apically at 20μM to stimulate cAMP and finally, CFTR-172 (Sigma-Aldrich, C2992) inhibitor was added apically and basally at 30μM. Under these conditions, cAMP-stimulated Isc due to addition of Forskolin could be attributed to CFTR-mediated Cl- secretion from basolateral to apical solution.
Statistical analysis.
The standard error of the mean was calculated from the average of at least three independent HBEC cultures. The Student’s t-test (unpaired, two-tailed) was used to compare data between groups with a p-value of less than 0.05 considered significant.
Pearson correlation and its associated p-value between ΔIsc and FOXI1+ or FOXJ1+ cell number/mm2 was calculated using the MATLAB corr function. Multivariate regression was carried out using the MATLAB fitlm function. Sensitivity was defined as the fractional change in Isc induced by a fractional change in FOXI1 (x_1) or FOXJ1 (x_2) cell number/mm2, at the ΔIsc value across all samples, estimated from the slope and intercept of multivariate regression as S_i = (dIsc/dn)/(Isc/n) = [slope_i*<x_i>]/<Isc> with I=1,2, respectively for FOXI1, FOXJ1.
Code availability.
Python scripts implementing the methods as described can be obtained upon request.
Data availability.
All sequencing data are available in the Gene Ontology Omnibus repository under the accession number GSE102580, the NCBI Sequence Read Archive under the accession number SRR5881096, the Klein lab SPRING viewer, and the Single Cell Portal (https://portals.broadinstitute.org/single_cell). To explore the single cell data:
Klein lab SPRING viewer (we recommend using Google Chrome):
Single Cell Portal:
Log in with the following Google credentials:
scp.wingert@gmail.com
h7J-cD5-fpG-kLX
View study: “A single cell atlas of the conducting airway reveals the CFTR-rich pulmonary ionocyte”
Go to “explore”
Explore. Under “Load a cluster” you can switch between the 3 SPRING plots used in the paper.
NOTE: when you start typing a gene, it will autofill. Make sure to select mouse genes for mouse and human genes (all capitals) for human. Failing to do so will display a given gene as not expressed.
Extended Data
Extended Data Figure 1: Atlas of transcription factors, surface molecules and kinases enriched in proximal airway lineages of mouse and human.

Transcription factors, kinases and surface molecules in mouse (a) and human (b) identified among the list of cell type-specific genes that met the following criteria: significantly enriched in lineage (false discovery rate (FDR) <5%, permutation test), expressed at ≥50 transcripts per million (TPM), expressed in marked lineage at least 1.5X higher than second highest cluster and highest in marked lineage for 4/4 (mouse) or 2/3 (human) biological replicates. c, Pairwise correlation of cell populations identified by single cell RNAseq. The 20% most variable genes (identified as described in8) detected in at least 3 cells at at least 3 counts were considered. Ward’s method was used for hierarchical clustering.
Extended Data Figure 2: Gene modules identified in mouse tracheal lineages.

Gene modules were identified by selecting variable genes within the given population that were correlated with at least 4 other genes with rank correlation > 0.2. Gene-gene correlation heat map shows 4 gene modules in mouse airway basal cells (a) and 6 gene modules in mouse airway secretory cells (b). SPRING plots show where gene modules are expressed in a given population. Multiple genes are combined in a single signature defined as the mean rank of expression (dense ranking).
Extended Data Figure 3: Gene modules identified in human bronchial lineages.
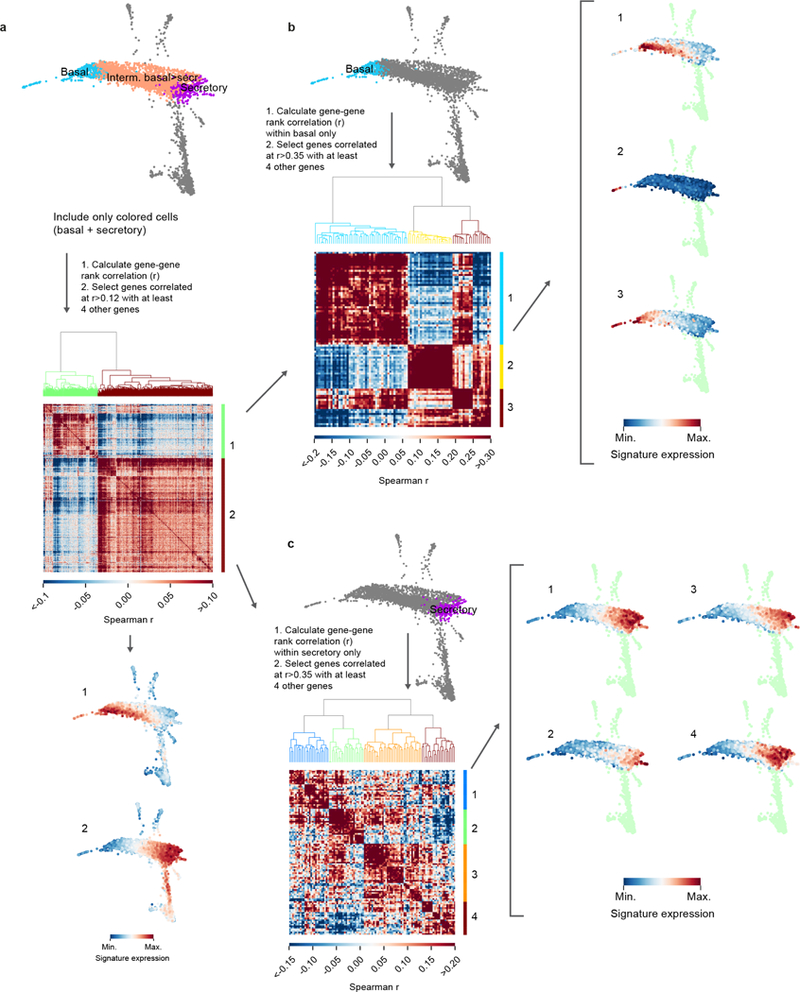
Two major modules of anti-correlated genes were identified by selecting variable genes within the basal to secretory continuum that were correlated with at least 4 other genes with rank correlation > 0.12. Genes within each module were then separately considered within basal and secretory cells, keeping genes with a correlation > 0.35 with at least 4 other genes. Gene-gene correlation heat map shows 3 gene modules in human airway basal cells (a) and 4 gene modules in human airway secretory cells (b). SPRING plots show where gene modules are active in a given population. Multiple genes are combined in a single signature defined as the mean rank of expression (dense ranking).
Extended Data Figure 4: Validation of novel lineages in mouse and human by immunofluorescence.

a, Immunofluorescence in mouse tracheal epithelium for Krt4 (green, arrowheads), Krt5 (basal), Krt8 (luminal), Scgb1a1 (club, secretory) and Foxj1 (ciliated) (n=3 animals). b, Immunofluorescence in differentiated HBEC cultures for FOXN4 (red, arrows), FOXJ1 (arrowheads mark FOXJ1low cells) and Acetylated αTubulin (cilia) (n=2 donors). c, Immunofluorescence in HBEC cultures for the ionocyte markers FOXI1, ATP6V1B1 and NGFR (n=3 donors). Arrowhead shows apical enrichment of ATP6V1B1. Arrows highlight lateral protrusions. Scale bar, 20 μm.
Extended Data Figure 5: Identification of recovery-specific cell states and population dynamics during regeneration.

a, Cells from uninjured mouse airway do not equally populate all regions of the SPRING plot of all mouse data combined. Each cell from the uninjured condition voted for its 10 nearest neighbors among all mouse cells profiled, and smoothed vote counts are used as a proxy for uninjured cell density on the map (two leftmost plots). By visual inspection of the smooth vote distribution a threshold of 25 votes was chosen to binarize regions of the SPRING plot into present vs depleted in uninjured. b, Barcharts representing abundance of rare populations as a fraction of all cells, over time post-injury. Error bars represent the 95% binomial proportion confidence interval (normal approximation). Total number cells = 7,898 from n=4 mice (uninjured), 898 from n=1 mouse (24h), 1,964 from n=1 mouse (48h), 1,082 from n=1 mouse (72h) and 2,321 from n=4 mice (1 week). c, Barcharts showing the fraction of all cells that are express Foxi1 in each population during recovery. Values shown correspond to fraction of all cells at each time point (cell and mouse numbers as in b above). Error bars defined as in b.
Extended Data Figure 6: Analysis of basal to ciliated differentiation trajectory following injury.

a, Population Balance Analysis (PBA, see Methods) was used to order 609 cells highlighted in black along the pseudotime of their basal-to-ciliated progression, followed by application of a moving average over a window of 100 cells. The resulting ordering of averaged cells is referred to as the basal-to-ciliated trajectory. PBA requires manually selecting source and sink cells for calculating the pseudotime. b, Heat map of the 1237 genes differentially expressed genes along the basal-to-ciliated trajectory (permutation test, FDR<5%, fold-changemax≥2, see Methods). Genes ordered by expression weighted mean position, defined for an expression time series xt as , Heat map of transcription factors (TFs) only. Hierarchical clustering revealed six major clusters of correlated genes. Clusters were ordered by mean expression weighted mean position. d, Plots of up to 5 TFs sampled from each cluster. The y-axis shows the average expression of a gene within the window of 100 cells ± SEM (or +1/[window size] for mean values of zero), normalized to the max. value. The total trajectory includes 609 cells.
Extended Data Figure 7: Specification and characterization of FOXI1 lineage in human bronchial epithelium.

a, HBECs were transduced at seeding with GFP or GFP:FOXI1 lentivirus, differentiated and sorted for GFP (shown is representative gating strategy (n=12). b, Fold change in transduced cells (GFP+, n=8 samples) compared to non-transduced cells (GFP-, n=7 samples) was determined by RT-qPCR normalized to GAPDH. Pooled data from 2 donors are represented as mean ± standard error of the mean (SEM). *p-value for FOXI1=.001, for CFTR=.04, ATP6V1B1=.006, FOXJ1=.01 and for SCGB1A1=.02 by two-tailed t-test. c, Fluorescent in situ hybridization (RNAscope®) for FOXI1 and CFTR in rHBEC culture transduced with GFP or GFP:FOXI1. Note that while there is an increase in FOXI1/CFTR co-labeled cells, not all FOXI1 cells express CFTR. (arrowheads vs. arrows) (n=2 independent experiments in 2 donors) d,e Chromogenic in situ hybridization (RNAscope®) in primary human bronchial tissue surface epithelium and gland ducts for CFTR and FOXI1 (d) or FOXJ1 (e). Chromogenic signals were split and pseudocolored to reveal individual channels; higher magnification is shown for boxed regions. Note that CFTR is highly enriched in FOXI1+ but not FOXJ1+ cells (n=1 donor, 5 regions of bronchial tree analyzed). Scale bars, 20 μm.
Extended Data Figure 8: Single-cell RNA-seq analysis of GFP- and GFP:FOXI1-transduced HBECs.

a, SPRING plot combining cells transduced with GFP (n= 9,436) or GFP:FOXI1 (n=10,330), with each of the two conditions highlighted in black (total cells n=19,766). b, The SLC16A7+ population was identified to be absent in the viral transduction experiment after mapping single cell transcriptome onto the reference state map. Each cell from the viral transduction experiment voted for its nearest neighbor in the reference experiment. The bar chart on the right shows the average number of votes per cluster. c, Cell states unique to the viral transduction experiment were identified as detailed in Extended Data Fig. 5a. d, Cells representing states also found in the reference experiment (conserved cells) inherited the label of their single nearest neighbor in the reference map. Cells specific to the viral transduction experiment were divided into four clusters by spectral clustering, with their top 5 enriched genes shown in the top part of the heat map (right). Enrichment of gene g in population i is defined as the fold-change in expression of g in i versus the second highest expresser. A pseudo value of 10 TPM was added before calculating the fold-change, and only genes expressed at >50 TPM in at least on cluster were considered. The bottom of the heat map shows the top 20 enriched genes identified treating all four transduction-specific states as one population. e, Bar chart showing fold-changes in population size following GFP:FOXI1 vs GFP transduction (extension of Fig. 3d). f, Expression of transgene in identified cell populations.
Extended Data Figure 9: Notch pathway component enrichment in airway lineages.

SPRING plots show enrichment of Notch pathway components in mouse (a) and human (b) airway lineages. Normalized counts are shown for the Notch ligands JAG1, JAG2 and DLL1 and the Notch receptors NOTCH1, NOTCH2 and NOTCH3. The Notch target gene signature combines HES1, HES5 and NRARP into a single gene signature defined as the mean expression rank (dense ranking). All gene expression and signature values are smoothed (see Methods for smoothing).
Extended Data Figure 10: Notch signaling inhibition decreases ionocyte markers in HBECs.

a, Expression of Notch target genes and airway lineage markers in cultures treated with 3.3 μM DAPT compared to cultures treated with DMSO. Notch target genes (NRARP p=.03, HES5) and secretory cell markers (MUC5B p=.001, MUC5AC) are decreased while ciliated cell markers (FOXJ1, DNAI2 p=.01) and basal cell markers (ITGA6 p=.006 and TP63) are increased upon DAPT treatment. Note that ionocyte markers (FOXI1 p=.02, CFTR) are also decreased upon DAPT treatment. P-value determined by two-tailed t-test (n=8 experiments in 2 donors). b, FOXI1 cell counts in HBEC cultures treated with antibodies that neutralize individual NOTCH receptors (n=5 experiments in 2 donors). All data are mean ± SEM.
Supplementary Material
Acknowledgements.
We would like to thank members of the Jaffe and Klein labs, as well as members of the Tissue Repair hub for helpful discussions. We would also like to thank: Caleb Weinreb for help with implementing SPRING and data analysis; Carla Bauer and Katharine Feldman for help obtaining human bronchial tissue; Paola Capodieci, Kristie Wetzel and Joyce Judge for help with tissue processing; Keith Mansfield, Bryce Suchomel and Chandra Saravanan for help with histology; Kevin Coote and Rachel Valdez Misiolek for help with electrophysiology; Ned Kirkpatrick, Akos Szilvasi, and Deborah Ahern-Ridlon for help with flow cytometry and imaging and John Reece-Hoyes and ShaoJian An for help with lentiviral design. We would also like to thank Tewis Bouwmeester and Jeff Porter for support and input through the course of this work, Ralph DeBerardinis for reviewing the manuscript, and Becky Ward for editorial assistance. L.W.P. would like to thank R.N.P. for thoughtful discussion. A.M.K. is supported by a Career Award at the Scientific Interface from the Burroughs Wellcome Fund, and an Edward Mallinckrodt Jr. Foundation Grant. R.Z. received support from the Lithuanian Education Exchanges Support Foundation. A.M.K. and R.Z. are supported by NCI grant R33CA212697–01.
Footnotes
Author Information. The authors declare the following competing interests: L.W.P., R.C.-W., J.K., G.R., and A.B.J. are employees of Novartis Institutes for BioMedical Research, as indicated in the affiliations. A.M.K. is a founder and SAB member of 1Cell-Bio.
Main text references
- 1.Rock JR, Randell SH & Hogan BLM Airway basal stem cells: a perspective on their roles in epithelial homeostasis and remodeling. Dis. Model. Mech 3, 545–556 (2010). [DOI] [PMC free article] [PubMed] [Google Scholar]
- 2.Hogan BLM et al. Repair and regeneration of the respiratory system: Complexity, plasticity, and mechanisms of lung stem cell function. Cell Stem Cell 15, 123–138 (2014). [DOI] [PMC free article] [PubMed] [Google Scholar]
- 3.Hong KU, Reynolds SD, Watkins S, Fuchs E & Stripp BR In vivo differentiation potential of tracheal basal cells: evidence for multipotent and unipotent subpopulations. Am J Physiol Lung Cell Mol Physiol 286, L643–L649 (2004). [DOI] [PubMed] [Google Scholar]
- 4.Rock JR et al. Basal cells as stem cells of the mouse trachea and human airway epithelium. Proc. Natl. Acad. Sci. U. S. A 106, 12771–12775 (2009). [DOI] [PMC free article] [PubMed] [Google Scholar]
- 5.Pardo-Saganta A et al. Injury Induces Direct Lineage Segregation of Functionally Distinct Airway Basal Stem/Progenitor Cell Subpopulations. Cell Stem Cell 16, 184–197 (2015). [DOI] [PMC free article] [PubMed] [Google Scholar]
- 6.Van Lommel A Pulmonary neuroendocrine cells (PNEC) and neuroepithelial bodies (NEB): Chemoreceptors and regulators of lung development. Paediatr. Respir. Rev 2, 171–176 (2001). [DOI] [PubMed] [Google Scholar]
- 7.Reid L et al. The mysterious pulmonary brush cell: A cell in search of a function. Am. J. Respir. Crit. Care Med 172, 136–139 (2005). [DOI] [PMC free article] [PubMed] [Google Scholar]
- 8.Klein AM et al. Droplet Barcoding for Single-Cell Transcriptomics Applied to Embryonic Stem Cells. Cell 161, 1187–1201 (2015). [DOI] [PMC free article] [PubMed] [Google Scholar]
- 9.Gray T, Guzman K, Davos W, Abdullah L & Nettesheim P Mucocilliary differentiation of serially passaged normal human tracheobronchial epithelial cells. Am J Respir Cell Mol Biol 14, 104–112 (1996). [DOI] [PubMed] [Google Scholar]
- 10.Tata PR & Rajagopal J Plasticity in the lung: making and breaking cell identity. Development 144, 755–766 (2017). [DOI] [PMC free article] [PubMed] [Google Scholar]
- 11.Weinreb C, Wolock S & Klein AM SPRING: a kinetic interface for visualizing high dimensional single-cell expression data. Bioinformatics btx792, 1–3 (2017). [DOI] [PMC free article] [PubMed] [Google Scholar]
- 12.Cole BB et al. Tracheal Basal Cells: A Facultative Progenitor Cell Pool. Am. J. Pathol. 177, 362–376 (2010). [DOI] [PMC free article] [PubMed] [Google Scholar]
- 13.Watson JK et al. Clonal Dynamics Reveal Two Distinct Populations of Basal Cells in Slow-Turnover Airway Epithelium. Cell Rep. 12, 90–101 (2015). [DOI] [PMC free article] [PubMed] [Google Scholar]
- 14.Reynolds SD, Reynolds PR, Pryhuber GS, Finder JD & Stripp BR Secretoglobins SCGB3A1 and SCGB3A2 Define Secretory Cell Subsets in Mouse and Human Airways. Am. J. Respir. Crit. Care Med 166, 1498–1509 (2002). [DOI] [PubMed] [Google Scholar]
- 15.Campell EP, Quigley IK & Kintner C Foxn4 promotes gene expression required for multiple motile cilia formation. Development 143, 4654–4664 (2016). [DOI] [PMC free article] [PubMed] [Google Scholar]
- 16.Garnett JP et al. Hyperglycaemia and Pseudomonas aeruginosa acidify cystic fibrosis airway surface liquid by elevating epithelial monocarboxylate transporter 2 dependent lactate-H+ secretion. Sci. Rep. 6, 37955 (2016). [DOI] [PMC free article] [PubMed] [Google Scholar]
- 17.Anderson MS & Su MA AIRE expands: new roles in immune tolerance and beyond. Nat. Rev. Immunol 16, 247–258 (2016). [DOI] [PMC free article] [PubMed] [Google Scholar]
- 18.Galluzzi L, Kepp O & Kroemer G Mitochondria: master regulators of danger signalling. Nat. Rev. Mol. Cell Biol 13, 780–788 (2012). [DOI] [PubMed] [Google Scholar]
- 19.Vidarsson H et al. The forkhead transcription factor Foxi1 is a master regulator of vacuolar H+-ATPase proton pump subunits in the inner ear, kidney and epididymis. PLoS One 4, e4471 (2009). [DOI] [PMC free article] [PubMed] [Google Scholar]
- 20.Quigley IK, Stubbs JL & Kintner C Specification of ion transport cells in the Xenopus larval skin. Development 138, 705–14 (2011). [DOI] [PMC free article] [PubMed] [Google Scholar]
- 21.Spassky N & Meunier A The development and functions of multiciliated epithelia. Nat. Rev. Mol. Cell Biol. 18, 423–436 (2017). [DOI] [PubMed] [Google Scholar]
- 22.Dubaissi E & Papalopulu N Embryonic frog epidermis: a model for the study of cell-cell interactions in the development of mucociliary disease. Dis. Model. Mech 4, 179–192 (2011). [DOI] [PMC free article] [PubMed] [Google Scholar]
- 23.Engelhardt JF et al. Submucosal glands are the predominant site of CFTR expression in the human bronchus. Nat. Genet. 2, 240–248 (1992). [DOI] [PubMed] [Google Scholar]
- 24.Rock JR et al. Notch-dependent differentiation of adult airway basal stem cells. Cell Stem Cell 8, 639–648 (2011). [DOI] [PMC free article] [PubMed] [Google Scholar]
- 25.Tsao P et al. Notch signaling controls the balance of ciliated and secretory cell fates in developing airways. Development 136, 2297–2307 (2009). [DOI] [PMC free article] [PubMed] [Google Scholar]
- 26.Danahay H et al. Notch2 Is Required for Inflammatory Cytokine-Driven Goblet Cell Metaplasia in the Lung. Cell Rep. 10, 239–252 (2015). [DOI] [PubMed] [Google Scholar]
- 27.Guseh JS et al. Notch signaling promotes airway mucous metaplasia and inhibits alveolar development. Development 136, 1751–1759 (2009). [DOI] [PMC free article] [PubMed] [Google Scholar]
- 28.Kreda SM et al. Characterization of Wild-Type and deltaF508 Cystic Fibrosis Transmembrane Regulator in Human Respiratory Epithelia. Mol. Biol. Cell 16, 2154–2167 (2005). [DOI] [PMC free article] [PubMed] [Google Scholar]
- 29.Li H, Sheppard DN & Hug MJ Transepithelial electrical measurements with the Ussing chamber. J. Cyst. Fibros. 3, 123–126 (2004). [DOI] [PubMed] [Google Scholar]
- 30.Shah VS et al. Airway acidification initiates host defense abnormalities in cystic fibrosis mice. 351, 503–507 (2016). [DOI] [PMC free article] [PubMed] [Google Scholar]
- 31.Lafkas D et al. Therapeutic antibodies reveal Notch control of transdifferentiation in the adult lung. Nature 528, 127–131 (2015). [DOI] [PubMed] [Google Scholar]
- 32.Li K et al. Modulation of notch signaling by antibodies specific for the extracellular negative regulatory region of NOTCH3. J. Biol. Chem. 283, 8046–8054 (2008). [DOI] [PubMed] [Google Scholar]
- 33.Wu Y et al. Therapeutic antibody targeting of individual Notch receptors. Nature 464, 1052–1057 (2010). [DOI] [PubMed] [Google Scholar]
- 34.Zilionis R et al. Single-cell barcoding and sequencing using droplet microfluidics. Nat. Protoc. 12, 44–73 (2017). [DOI] [PubMed] [Google Scholar]
- 35.Zhang HM et al. AnimalTFDB 2.0: A resource for expression, prediction and functional study of animal transcription factors. Nucleic Acids Res. 43, D76–D81 (2015). [DOI] [PMC free article] [PubMed] [Google Scholar]
- 36.Weinreb C, Wolock S, Tusi BK, Socolovsky M & Klein AM Fundamental limits on dynamic inference from single-cell snapshots. Proc. Natl. Acad. Sci 115, E2467–E2476 (2018). [DOI] [PMC free article] [PubMed] [Google Scholar]
- 37.Tusi BK et al. Population snapshots predict early haematopoietic and erythroid hierarchies. Nature 555, 54–60 (2018). [DOI] [PMC free article] [PubMed] [Google Scholar]
- 38.Borthwick DW, Shahbazian M, Krantz QT, Dorin JR & Randell SH Evidence for stem-cell niches in the tracheal epithelium. Am. J. Respir. Cell Mol. Biol. 24, 662–670 (2001). [DOI] [PubMed] [Google Scholar]
Associated Data
This section collects any data citations, data availability statements, or supplementary materials included in this article.
Supplementary Materials
Data Availability Statement
All sequencing data are available in the Gene Ontology Omnibus repository under the accession number GSE102580, the NCBI Sequence Read Archive under the accession number SRR5881096, the Klein lab SPRING viewer, and the Single Cell Portal (https://portals.broadinstitute.org/single_cell). To explore the single cell data:
Klein lab SPRING viewer (we recommend using Google Chrome):
Single Cell Portal:
Log in with the following Google credentials:
scp.wingert@gmail.com
h7J-cD5-fpG-kLX
View study: “A single cell atlas of the conducting airway reveals the CFTR-rich pulmonary ionocyte”
Go to “explore”
Explore. Under “Load a cluster” you can switch between the 3 SPRING plots used in the paper.
NOTE: when you start typing a gene, it will autofill. Make sure to select mouse genes for mouse and human genes (all capitals) for human. Failing to do so will display a given gene as not expressed.