

Abstract
Objective
The prognostic value of cerebrospinal fluid neurofilament light chain, total tau, phosphorylated tau181, and amyloid beta1‐42 was examined in frontotemporal dementia subtypes.
Methods
We compared baseline biomarkers between 49 controls, 40 patients with behavioral variant frontotemporal dementia, 24 with semantic variant primary progressive aphasia, and 26 with nonfluent variant primary progressive aphasia. Linear mixed effect models were used to assess the value of baseline biomarkers in predicting clinical and radiographic change in patient cohorts over multiple yearly follow up visits.
Results
Neurofilament light chain concentrations were lowest in controls. Elevated baseline neurofilament light chain predicted faster worsening in clinical severity, frontotemporal volume and frontotemporal fractional anisotropy in patients with behavioral variant frontotemporal dementia and nonfluent variant primary progressive aphasia. High total tau similarly predicted faster progression in nonfluent variant primary progressive aphasia. In behavioral variant frontotemporal dementia, higher phosphorylated tau181 predicted faster clinical progression whereas lower amyloid beta1‐42 predicted faster volumetric and fractional anisotropy reduction. Neurofilament light chain and phosphorylated tau181 were of greater predictive value in patients with tau pathology as compared to TDP‐43 pathology. Baseline neurofilament light chain correlated with baseline clinical severity and frontotemporal volume in behavioral variant frontotemporal dementia. Baseline total tau correlated with baseline clinical severity in semantic variant primary progressive aphasia.
Interpretation
High cerebrospinal fluid neurofilament light chain predicts more aggressive disease in behavioral variant frontotemporal dementia and nonfluent variant primary progressive aphasia. Total tau, phosphorylated tau181, and amyloid beta1‐42 also predict some measures of disease aggressiveness in frontotemporal dementia.
Introduction
Frontotemporal dementia (FTD) is a heterogeneous group of degenerative clinical syndromes, including behavioral variant frontotemporal dementia (bvFTD), nonfluent variant primary progressive aphasia (nfvPPA), and semantic variant primary progressive aphasia (svPPA). Patients with FTD show diverse patterns of clinical progression, radiographic change, and underlying frontotemporal lobar degeneration (FTLD) pathologies, including FTLD with tau immunoreactive inclusions (FTLD‐tau) and pathology with transactive response DNA‐binding protein 43 kDa inclusions (FTLD‐TDP).1 Future therapeutic trials in FTD must grapple with this heterogeneity in order to establish drug efficacy. Cerebrospinal fluid (CSF) biomarkers may provide a relatively uniform measure of disease biology, reflecting disease severity and drug target engagement, and thus provide evidence of drug efficacy when followed longitudinally.2 CSF biomarkers may also be associated with overall aggressiveness of disease, which may help to select patients predicted to show similar progression trajectories in clinical trials.
CSF amyloid beta1‐42 (Aβ 1‐42) and tau distinguish FTLD from Alzheimer's disease (AD),3 but they are not consistently abnormal in FTD2, 4, 5 and are largely unexplored as predictors of changes in FTD disease severity. Recent studies in FTD suggest that serum and CSF neurofilament‐light chain (NfL), an intermediate cytoskeletal element that elevates upon neuronal injury,6 is a reliable marker of disease onset,7 clinical severity,7, 8, 9 disease prognosis,7, 10 and brain atrophy rates.7, 9 Few studies, however, have addressed the relative value of NfL in prediction of disease progression in different FTD cohorts. Additionally, there is limited data comparing the predictive value of NfL to other CSF biomarkers, such as Aβ1‐42, total tau (t‐tau) and phosphorylated tau181 (p‐tau). Additionally, despite the importance of tau and NfL in determining axon structure and function, there are few data on how well these CSF biomarkers predict progression of diffusion tensor imaging (DTI) measures of axonal integrity.
In this study, we investigated the value of CSF NfL, t‐tau, p‐tau and Aβ 1‐42 in predicting disease progression within and between each of the three canonical FTD variants, as well as in neuropathologically or genetically confirmed FTLD‐tau and FTLD‐TDP. Since these data have potential implications for clinical trial design, we compared the ability of CSF biomarkers to predict change to a variety of clinical and radiographic disease progression measures, including neuropsychological testing, volumetric MRI, and DTI measures of white matter microstructure.
Methods
Participants
Baseline CSF biomarker concentrations, longitudinal clinical data, and longitudinal imaging data were studied in 90 patients with frontotemporal dementia (40 bvFTD, 24 svPPA, 26 nfvPPA) (Table 1). CSF data from 49 healthy age‐matched controls was also included for comparison. Data were collected from three medical centers (University of California, San Francisco [UCSF], Massachusetts General Hospital [MGH], Mayo Clinic, Rochester [MCR]) via the Frontotemporal Lobar Degeneration Neuroimaging Initiative (FTLDNI) and the UCSF program project grant in frontotemporal dementia. The Institutional Review Board (IRB) of each contributing site previously approved study protocols. Patients were diagnosed by a multidisciplinary consensus panel using current (at the time of study enrollment) consensus diagnostic criteria for bvFTD,11, 12 svPPA,13 and nfvPPA.13 Baseline CSF samples were matched with baseline clinical and radiographic data within 90 days of sample collection. The majority (84%) of cases also had one or more additional clinical data and radiographic data points after their baseline visit (Table 1). The average follow‐up interval was between 9 and 10 months. Intervals were not regular within or between patients. There was not a statistically significant difference in follow‐up interval lengths between individual FTD cohorts (Kruskal Wallis P < 0.05). In order to account for the irregularity of follow‐up intervals, time was used as a continuous variable (years from baseline CSF value) in all linear mixed‐effect models.
Table 1.
Patient demographics and CSF biomarker levels
| All FTD | bvFTD | nfvPPA | svPPA | Controls | |
|---|---|---|---|---|---|
| Total cases with CSF, n | 90 | 40 | 26 | 24 | 49 |
|
Cases with clinical data, n
[average number of time points] |
87 | 40 [2.6] | 26 [2.7] | 24 [2.9] | |
|
Cases with volumetric MRI, n
[average number of time points] |
81 | 36 [2.6] | 22 [2.7] | 23 [2.7] | |
|
Cases with DTI, n
[average number of time points] |
80 | 36 [2.4] | 24 [2.3] | 20 [2.9] | |
| Female/Male | 36/54 | 15/25 | 11/15 | 13/11 | 22/27 |
| Presumed FTLD‐tau/FTLD‐TDP | 20/15 | 8/13 | 12/1 | 0/1 | |
| Cases with t‐tau/Aβ 1‐42 > 0.52 | 5 | 4 | 0 | 1 | 0 |
| Mean age, years (SD) | 63.3 (7.5) | 61.0 (6.2)1 | 68.0 (8.0)1 | 62.1 (6.9) | 64 (7.8) |
| Mean disease duration, years (SD) | 5.2 (3.5) | 5.3 (3.4) | 4.7 (4.4) | 5.5 (2.8) | |
| Mean FTLD‐CDR SB (SD) | 7.19 (3.77)2 | 9.42 (3.55)2 | 4.69 (2.90)2 | 6.46 (2.94)2 | |
| Mean frontotemporal volume, mm3 (SD) |
1.77 × 10⁵
(0.25x10⁵) |
1.72 × 10⁵
(0.31 × 10⁵) |
1.78 × 10⁵
(0.22 × 10⁵) |
1.84 × 10⁵
(0.16 × 10⁵) |
|
| Frontotemporal FA (SD) | 0.394 (0.026) | 0.3903 (0.033) | 0.399 (0.022) | 0.395 (0.020) | |
| Baseline CSF biomarker levels | |||||
| NfL pg/mL (SD) |
5.7 × 10³
(4.0 × 10³)3 |
5.61 × 10³ (4.8 × 10³)3 | 4.7 × 10³ (2.1 × 10³)3 | 6.9 × 10³ (3.7 × 10³)3 | 1.3 x10³ (6.1 × 10³)3 |
| Total Tau pg/mL (SD) | 82.1 (37.1) | 80.1 (41.1) | 80.1 (26.8) | 87.6 (40.4) | 72.0 (26.3) |
| p‐ta pg/mL (SD) | 22.9 (9.7) | 21.7 (9.8) | 23.3 (10.4) | 24.4 (8.8) | 25.3 (8.1) |
| Aβ 1‐42 pg/mL (SD) | 410 (160) | 390 (170) | 430 (140) | 440 (180) | 480 (170) |
| Total Tau/Aβ 1‐42 (SD) | 0.24 (0.18) | 0.26 (0.23) | 0.21 (0.11) | 0.22 (0.13) | 0.17 (0.10) |
| p‐tau/t‐tau (SD) | 0.33 (0.13) | 0.31 (0.14)4 | 0.29 (0.11)4 | 0.31 (0.13) | 0.37 (0.12) |
Aβ 1‐42, amyloid beta1‐42; bvFTD, behavioral variant frontotemporal dementia; CSF, cerebrospinal fluid; FA, fractional anisotropy; NfL, neurofilament light chain; nfvPPA, nonfluent variant primary progressive aphasia, p‐tau, phosphorylated tau181; SD, standard deviation; svPPA, semantic variant primary progressive aphasia; t‐tau, total tau.
1 Indicates a statistically significant difference in age between groups (P = 0.001) between bvFTD and nfvPPA.
2 Indicates a statistically significant difference in CDR‐FTLD SB between groups (P = 0.0001) with svPPA higher than nfvPPA and bvFTD being higher than both PPA variants in post hoc pairwise comparisons (P < 0.05).
3 Indicates that values in controls are statistically significantly lower in pairwise comparisons with all 3 symptomatic cohorts (P < 0.05).
4 Indicates that p‐tau/t‐tau ratio is lower in bvFTD and nfvPPA than in controls (P < 0.05).
CSF Assessment
NfL, t‐tau, p‐tau, and Aβ 1‐42 concentrations were measured from frozen CSF samples collected between May 2009 and May 2015. CSF samples were collected via lumbar puncture into sterile polypropylene tubes, using a previously described protocol.8 Within 30 min of collection, CSF samples were centrifuged at 2000g at room temperature (20–25°C) for 5 min, aliquoted into 500 μL cryovials and stored at −80°C, until further analysis. All fluid biomarkers were measured from baseline CSF, previously collected during or prior to earliest clinical and MR imaging assessment. NfL concentrations were also measured in follow‐up CSF samples (within 2 years after baseline) in 27 patients with FTD (14 with bvFTD, 8 with nfvPPA, and 5 with svPPA) to provide longitudinal data on NfL change. Longitudinal data was not collected for t‐tau, p‐tau, or Aβ 1‐42. All biomarkers were measured in duplicate (twice concurrently) to ensure coefficients of variance<25%, and the average concentration was used in our analyses. Aβ 1‐42, total tau (t‐tau), and hyperphosphorylated tau (p‐tau) concentrations were measured with the INNO‐BIA AlzBio3 platform (Fujirebio, Belgium). Neurofilament light‐chain (NfL) levels were quantified using the Uman Diagnostics enzyme‐linked immunosorbent assay kit (Umea, Sweden). All NfL samples were performed using a 1:4 dilution as specified in the Uman Diagnostic kit instructions, and were otherwise performed using previously described kit methods.8 NfL concentrations were first assessed on 7/26/2012 and 4/24/2013 by a clinical research organization, Bristol‐Myers Squibb (BMS), in an initial cohort of 27 patients (14 with bvFTD, 8 with nfvPPA, and 5 with svPPA). Data obtained from BMS (along with contemporaneous clinical and volumetric data) were previously used in separately published cross‐sectional analyses.8 In order to expand our sample size, NfL concentrations in a larger cohort of patients (26 with bvFTD, 22 with nfvPPA, 19 with svPPA, 49 controls) were measured on 7/15/2015 and 1/12/16 by the Fagan lab, Washington University, St. Louis. The Fagan lab also performed CSF Aβ 1‐42, t‐tau and p‐tau assays for all 139 subjects in our study on 7/15/2015 and 1/12/16. The laboratory site of biomarker assessment was included as a covariate in all statistical analyses of NfL levels. Among patients with FTD, there was no difference between NfL concentrations calculated by the Fagan lab and BMS (P‐value = 0.6).
Classification of patients according to causative proteinopathy
To examine whether the predictive value of NfL is different for FTLD‐tau vs. FTLD‐TDP, we assigned cases into groups based on the best available data. Diagnostic information from postmortem brain examination, using previously described methods,14 was used if available. If autopsy data was not available (whether it was not obtained or the patient was still alive), but an FTD‐causing mutation was identified, gene status was used to identify the putative FTLD major molecular class. If neither autopsy nor mutation data were available, we assigned some patients to a proteinopathy group if they developed either a motor neuron disease secondary clinical phenotype (strongly associated with FTLD‐TDP) or a Steele‐Richardson progressive supranuclear palsy (PSP) secondary clinical phenotype15 (strongly associated with FTLD‐tau). Using this enrichment approach, we were able to assign a likely underlying pathology in 35 cases (20 with FTLD‐tau and 15 with FTLD‐TDP) (Table 1). Autopsy data was available in 12 cases with bvFTD, 11 cases with nfvPPA and one case with svPPA. Within the bvFTD group, six patients had FTLD‐tau pathology at autopsy (two with Pick's disease, one with agyrophilc grain disease, one with PSP, and two with corticobasal degeneration), and six patients showed FTLD‐TDP (one with sporadic FTLD‐TDP type A, one with FTLD‐TDP Type A secondary to GRN mutation, three with sporadic FTLD‐TDP Type B and motor neuron disease, and one with unclassifiable FTLD‐TDP secondary to C9ORF72 expansion). An additional two patients with bvFTD were classified as tauopathy based on MAPT mutations and six additional living patients had mutations associated with FTLD‐TDP (five with C9ORF72 expansions and one with a GRN mutation). Two patients with bvFTD due to C9ORF72 expansion also developed motor neuron disease later in their course. One additional patient with bvFTD and motor neuron disease was presumed to have FTLD‐TDP pathology. Within the nfvPPA cohort, 10 cases had FTLD‐tau pathology at autopsy (two with Pick's disease, one with an unclassifiable four repeat tauopathy, six with corticobasal degeneration, and one with PSP pathology), and one had FTLD‐TDP Type B pathology with motor neuron disease. Two living patients with nfvPPA were presumed to have FTLD‐tau pathology because of accompanying clinical features sufficient to also meet clinical research criteria for the Steele‐Richardson PSP syndrome.15 One patient with svPPA had autopsy data that confirmed the presence of FTLD‐TDP type B pathology. A total tau/Aβ 1‐42 ratio of 0.52 was used to define CSF criteria for AD.16 Only five cases met CSF criteria for AD (four cases with bvFTD, one case with svPPA, and no cases with nfvPPA).
Clinical assessment
General functional severity was assessed using the FTLD modified clinical dementia rating scale, sum of boxes score (CDR‐FTLD SB), and established measure of clinical decline in FTD.17 Patients were also assessed using the Functional Assessment Questionnaire (FAQ),18 the Clinician's Global Impression Scale (CGI),19 the Schwab and England Activities of Daily Living scale (SEADL),20 the Neuropsychiatric Inventory (NPI),21 the Mini‐Mental State Examination (MMSE),22 the California Verbal Learning Test, Second Edition‐Short Form (CVLT),23 digit span (backward and forward),24 a modified Trail‐making task,25 the Stroop color naming and inhibition tasks,26 phonemic fluency (D‐words/minute),25 semantic fluency (animals/minute),27 the 15‐item Boston Naming Test (BNT),28 the short version of the Peabody Picture Vocabulary Test‐Revised (PPVT),29 the Pyramids and Palm Trees test of sematic access,30 and a copy of the Modified Rey Benson Figure.25
Structural MRI analyses
We obtained volumetric magnetic resonance images at UCSF and MGH, using a 3T Siemens Tim Trio system equipped with a 12‐channel head coil. Images obtained at MCR were acquired on a 3T GE MRI scanner equipped with an 8‐channel head coil. T1 acquisition and processing were performed under previously described methods.31 Brain volumes were calculated for specific brain regions at each time point by transforming a standard parcellation atlas32 into ICBM space and summing all modulated gray matter within each specified parcellated region. Lobar composites were used to reduce the number of regions of interest (ROI) in our analysis. Right and left frontal lobe composites were created using the sum of volumes within the following regions: anterior cingulate (caudal and rostral), frontal pole, insula, lateral orbitofrontal cortex, medial orbitofrontal cortex, middle frontal gyrus, pars opercularis, pars orbitalis, pars triangularis, superior frontal gyrus, and precentral gyrus. We created right and left temporal lobe composites using the sum of volumes in the following regions: banks of the superior temporal sulcus, entorhinal cortex, fusiform gyrus, middle temporal gyrus, parahippocampal cortex, superior temporal gyrus, temporal pole, and transverse temporal gyrus. We then summed volumes in the resulting right frontal, left frontal, right temporal and left temporal lobe composites to produce total frontotemporal composite ROI. We created a global frontotemporal volumetric ROI by summing the frontal and temporal composite ROIs.
DTI analyses
DTI acquisition and processing were performed using previously described methods using scans from UCSF.33 DTI ROIs were obtained, using the ICVM‐DTI‐81 white matter labels and tract atlas.34 We again created composite ROIs. The right and left frontal composite ROIs represented the average fractional anisotropy (FA) of tracts conveying fibers that entered and exited the frontal lobes, including the superior longitudinal fasciculus and cingulum bundle. The right and left temporal composite ROIs represented the average FA from the fornix, inferior longitudinal fasciculus, sagittal stratum, and hippocampal portion of the cingulum. FA within the genu of the corpus callosum, the right uncinate fasciculus, and left uncinate fasciculus were also analyzed but not included in lobar composites. We created a global frontotemporal DTI ROI by averaging FA in the genu of the corpus callosum, the bilateral uncinated fasciculus, and the right and left constituent ROIs previously used to create our frontal and temporal composite ROI.
Statistics
We performed basic descriptive statistics for demographic data and CSF protein levels. The normality of continuous cross‐sectional data was assessed via the skewness kurtosis test.35 Non‐normally distributed values (CDR‐FTLD SB, NfL, t‐tau, Aβ 1‐42, t‐tau/Aβ 1‐42 ratio) were compared using nonparametric methods, including the Kruskal–Wallis test followed by post hoc Wilcoxon pairwise rank sum testing. Normally distributed measures (p‐tau, p‐tau/t‐tau, age) were compared between cohorts with Analysis of Variance (ANOVA), followed by a post hoc pairwise Tukey test. A Bonferroni correction was used to correct for multiple pairwise comparisons across five differing CSF measures (α = 0.05/5 = 0.01). In light of previously published studies,36, 37 we also used a receiver operating characteristic (ROC) analysis to investigate the utility of p‐tau/t‐tau ration in detecting FTLD‐TDP pathology en vivo.
We hypothesized that CSF protein biomarkers (NfL, t‐tau, p‐tau, Aβ 1‐42) would predict change in three primary selected measures of disease severity: the CDR‐FTLD SB, frontotemporal volume, and frontotemporal fractional anisotropy (FA). In order to compare the effect sizes between CSF markers, the mean and standard deviations (SD) (Table 1) for our entire FTD cohort (n = 90) were used to create Z‐score values for NfL, total tau, p‐tau, and Aβ 1‐42 for each patient (thus allowing effect sizes to be conveyed in terms of standard deviation from the mean). We subsequently used these Z‐scores as continuous variables for cross‐sectional regression models and linear mixed effect models (LME) performed in this study.
In order to leverage data from cases with three or more data points, we used LME models to estimate interactions between biomarkers and time (both continuous variables) in determining disease measures. Biomarker level, age, and sex were included as fixed effects. The lab of NfL measurement and total intracranial volume (TIV) were also included as fixed effects in models containing NfL and volumetric data, respectively. We modeled time as a fixed effect and allowed each patient to have a random intercept to account for differing baseline severity. In order to assess whether the value of biomarkers differed by clinical cohort, we first tested three‐way interactions between biomarkers, diagnosis (a fixed effect), and time. Given the apparent interaction between diagnosis and biomarker predictors, we elected to assess each canonical FTD variant separately in our two‐way LME models. We selected a conservative approach to correct for multiple comparisons to focus on easily reproducible findings for future clinical trial use. A Bonferroni correction (α = 0.05/3 = 0.017) was applied to analyses of our three primary measures. As a sensitivity analysis, all statistically significant findings were reanalyzed after excluding cases with possible contributory non‐FTLD co‐pathology, including three patients with bvFTD and possible AD biomarkers, six cases with bvFTD and evidence of motor neuron disease, one case with nfvPPA and motor neuron disease, and one patient with svPPA and positive AD biomarkers. In order to provide a clinically useful presentation of data, we calculated annual clinical change (using LME models with no interaction) above and below the median CSF concentration for every biomarker that predicted CDR‐FTLD. Follow up post hoc analysis (using previously discussed two‐way interaction LME models) then assessed predictors of change in 30 additional clinical and radiographic measures of disease decline (Tables S1–S3). A Bonferroni correction was applied (α = 0.05/30 = 0.0017) to results for our 30 follow up measures of disease severity. Finally, we modeled interactions between underlying pathology (a fixed effect), biomarkers, and time in determining disease severity in a cohort of cases with bvFTD or nfvPPA phenotypes. The magnitude of the estimated three‐way interaction coefficient was used to assess the relative predictive value of biomarkers in FTLD‐tau relative to FTLD‐TDP. After each LME model analysis a postestimation of standardized residuals was performed to ensure the normality of their distribution. All statistically significant findings were rerun as a sensitivity analysis with patients with motor neuron disease (severe patients with bvFTD, one with nfvPPA) and/or CSF criteria for AD (four cases with bvFTD, one case with svPPA) excluded from analysis.
Linear regression was used to estimate and assess the statistical significance of relationships between CSF protein concentrations and each of our three primary measures of interest within each of the three FTD clinical cohorts of interest. Baseline CDR‐FTLD was not normally distributed in nfvPPA, so a log transformed value was used in our nfvPPA regression models. In cases with longitudinal NfL data, linear regression was also used to estimate the change in CSF NfL over time. We utilized NfL change (NfL value 2 – NfL value 1) as the dependent variable and duration between time points (in years) as an independent variable. Longitudinal t‐tau, p‐tau, and Aβ 1‐42 values were not available for analysis. Age and sex were included as covariates in all regression models. The lab of measurement and total intracranial volume (TIV) were also included as covariates in regression models containing NfL and volumetric data, respectively.
Results
Patient demographics
Basic demographic information is presented in Table 1. Patients with nfvPPA were older than patients with bvFTD, though none of the FTD groups differed from age‐matched controls. Patients with bvFTD had a higher CDR‐FTLD SB score than patients with svPPA or patients with nfvPPA. Additionally, patients with svPPA had a higher FTLD‐CDR SB than patients with nfvPPA. Patients with svPPA tended to have higher CSF NfL levels than other FTD variants, but this difference was not statistically significant. Controls had lower CSF NfL than all three disease variants in all pairwise comparisons (Fig. 1A). CSF p‐tau/t‐tau ratio was lower in patients with bvFTD and nfvPPA compared to healthy controls (Fig. 1F). Additionally, patients with presumed FTLD‐TDP pathology tended to have a lower CSF p‐tau/t‐tau ratio than patients with presumed FTLD‐tau (P = 0.02) (Table 2). A p‐tau/t‐tau ratio less than or equal to 0.29 gave an AUC of 0.7 (SD 0.47, P = 0.003), a specificity of 70% specific and sensitivity of 65.3% in detecting FTLD‐TDP from our cohort with discernable pathology (Table S1). CSF t‐tau/Aβ 1‐42 ratio tended to be lower in controls compared to patients with bvFTD, svPPA, and nfvPPA, but these findings were not significant after adjusting for multiple comparisons. There was no difference in CSF t‐tau, p‐tau, or Aβ 1‐42 concentrations between any of our clinical (controls, bvFTD, nfvPPA or svPPA) or pathologic cohorts.
Figure 1.
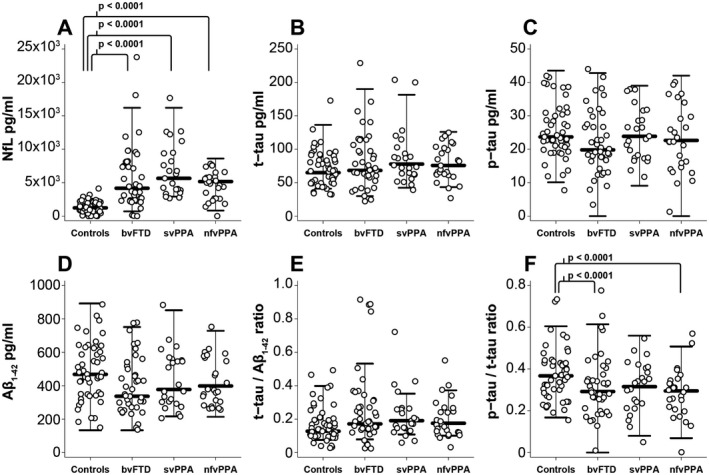
CSF biomarkers by clinical cohort. A, CSF NfL, B, t‐tau, C, p‐tau, D, Aβ1‐42, E, t‐tau/Aβ1‐42 ratio and F, p‐tau/t‐tau ratio respectively. Circles represent individual participants in the study. Whiskers represent the highest and lowest adjacent values (± 1.5 x interquartile range) with a median line in between. All three FTD cohorts differed from controls in pairwise comparisons (P < 0.0001). Aβ 1‐42, amyloid beta1‐42; bvFTD, behavioral variant frontotemporal dementia; CSF, cerebrospinal fluid; NFL, neurofilament light chain; nfvPPA, nonfluent variant primary progressive aphasia; p‐tau, phosphorylated tau181; svPPA, semantic variant primary progressive aphasia; t‐tau, total tau.
Table 2.
Patient demographics CSF biomarker levels by pathology
| FTLD‐tau | FTLD‐TDP | |
|---|---|---|
| Total, n | 20 | 15 |
| Autopsy proven pathology | 16 | 8 |
| Gene status used to infer punitive proteinopathy |
2 (MAPT) |
6 (5 C9ORF72, 1 GRN) |
| Clinical syndrome used to infer proteinopathy |
2 (Steele‐Richardson PSP syndrome) |
1 (MND syndrome) |
| Mean age, years (SD) | 60.7 (6.1)1 | 66.1 (7.0)1 |
| Female/Male | 8/12 | 8/7 |
| Mean FTLD‐CDRSB (SD) | 10.9 (4.2)1 | 6.9 (3.4)1 |
| Baseline CSF biomarker levels | ||
| NfL pg/mL (SD) |
7.7 x10³
(5.9 x10³) |
4.9 x10³
(2.6 x10³) |
| Total Tau pg/mL (SD) | 90.3 (57.1) | 83.0 (28.0) |
| p‐tau pg/mL (SD) | 15.6 (11.2) | 24.7 (8.5) |
| Aβ 1‐42 pg/mL (SD) | 360 (170) | 410 (150) |
| Total Tau/Aβ 1‐42 (SD) | 0.30 (0.26) | 0.23 (0.12) |
| p‐tau/t‐tau (SD) | 0.31 (0.3)1 | 0.21 (0.04)1 |
Aβ 1‐42, amyloid beta1‐42; bvFTD, behavioral variant frontotemporal dementia; CSF, cerebrospinal fluid; FA, fractional anisotropy; FTLD‐tau, frontotemporal lobar degeneration with tau pathology; FTLD‐TDP, frontotemporal lobar degeneration with transactive response DNA‐binding protein 43 kDa pathology; MND, motor neuron disease; NfL, neurofilament light chain; nfvPPA, nonfluent variant primary progressive aphasia; PSP, progressive supranuclear palsy; p‐tau, phosphorylated tau181; SD, standard deviation; svPPA, semantic variant primary progressive aphasia; t‐tau, total tau.
1 Indicates a statistically significant difference between FTLD‐tau than in FTLD‐tau (P < 0.05) in pairwise comparisons.
CSF biomarkers correlate with clinical severity and brain volume
In patients with bvFTD, high baseline CSF NfL was linearly related to high baseline CDR‐FTLD SB (1.36 CDR units/SD NfL, 95% CI [0.41, 2.31], P = 0.006, R 2=0.23) and low baseline frontotemporal volume (−8.4 × 103 mm3/SD NfL, 95% CI [−15 × 103, 2.0 × 10³], P = 0.012, R 2 = 0.65). In patients with svPPA, high baseline t‐tau (1.44 units/SD NfL, 95% CI [0.29, 2.59], P = 0.016, R 2=0.26) was linearly related to CDR‐FTLD SB.
Baseline NfL and p‐tau predict longitudinal change in bvFTD
Higher baseline levels of CSF NfL, total tau, and p‐tau predicted a faster rate of CDR‐FTLD SB worsening in patients with bvFTD (Table 3, Fig. 2A–C). However, after excluding cases with possible non‐FTLD co‐pathology, only CSF NfL and p‐tau remained statistically significant predictors of CDR‐FTLD progression rate. On average within the bvFTD cohort, patients above the median CSF NfL concentration (4.1 × 10³ pg/mL) increased by 3.4 CDR‐FTLD units annually, patients above the median p‐tau concentration (19.8 pg/mL) increased by 2.9 CDR‐FTLD units annually, and patients below the mean for both biomarker experienced minimal clinical change annually (Table 4). CSF p‐tau/t‐tau ratio was not a useful predictor of clinical change in bvFTD.
Table 3.
Additional disease change with each standard deviation increase in biomarkers
| bvFTD | nfvPPA | svPPA | ||||
|---|---|---|---|---|---|---|
| Coefficient [CI] | P | Coefficient [CI] | P | Coefficient [CI] | P | |
| CDR‐FTLD SB/year | ||||||
| NfL |
1.4 [0.85,1.9] |
<0.0005 |
2.1 [1.0, 3.3] |
<0.0005 |
0.2 [−0.59, 0.93] |
0.665 |
| t‐tau |
1.2 [0.5, 2.0] |
0.0011 |
1.7 [0.6, 2.7] |
0.002 |
−0.7 [−1.5, 0.20] |
0.131 |
| p‐tau |
1.3 [0.64, 2.0] |
<0.0005 |
0.3 [−0.56,1.2] |
0.459 |
−0.01 [−1.0, 1.0] |
0.977 |
| Aβ 1‐42 |
−0.6 [−1.2, 0.04] |
0.07 |
−0.7 [−2, 0.57] |
0.274 |
−0.4 [−1.1, 0.20] |
0.169 |
| Frontotemporal volume (mm3)/year | ||||||
| NfL |
−2.2 × 10³
[−3.9 × 10³, −0.5 × 10³] |
0.009 |
−6.2 × 10³
[−8.8 × 10³, −3.5 × 10³] |
<0.0005 |
−1.6 × 10³
[−3.8 × 10³, 0.6 × 10³] |
0.161 |
| t‐tau |
−1.1 × 10³
[−3.4 × 10³, −1.3 × 10³] |
0.363 |
−3.5 × 10³
[−6.1 × 10³, −0.8 × 10³] |
0.011 |
−0.9 × 10³
[−2.6 × 10³, 0.7 × 10³] |
0.264 |
| p‐tau |
−2.1 × 10³
[−4.6 × 10³, 0.5 × 10³] |
0.113 |
−1.7 × 10³
[−3.8 × 10³, 0.32 × 10³] |
0.098 |
0.5 × 10³
[−2.0 × 10³, −3.1 × 10³] |
0.691 |
| Aβ 1‐42 |
2.3 × 10³
[0.7 × 10³, 3.8 × 10³] |
0.004 |
−2.4 × 10³
[−5.1 × 10³, 0.2 × 10³] |
0.07 |
−0.7 × 10³
[−2.1 × 10³, 0.6 × 10³] |
0.305 |
| Frontotemporal FA/year | ||||||
| NfL |
−5.9 × 10⁻³
[−9.3 × 10⁻³, −2.5 × 10⁻³] |
0.001 |
−7.6 × 10⁻³
[−12 × 10−3, −3.0 × 10⁻³] |
0.001 |
−5.1 × 10⁻³
[−11 × 10−3, −1.3 × 10⁻³] |
0.117 |
| t‐tau |
−4.6 × 10⁻³
[−9.1 × 10⁻³, −2.0 × 10⁻³] |
0.041 |
−6.0 × 10⁻³
[−9.6 × 10⁻³, −2.3 × 10⁻³] |
0.001 |
−3.2 × 10⁻³
[−10 × 10−3, 3.6 × 10⁻³] |
0.351 |
| p‐tau |
−4.9 × 10⁻³
[−9.2 × 10⁻³, 0.7 × 10⁻³] |
0.024 |
−3.6 × 10⁻³
[−7.4 × 10⁻³, 0.4 × 10⁻³] |
0.075 |
5.5 × 10⁻³
[1.9 × 10⁻³, 13 × 10−3] |
0.145 |
| Aβ 1‐42 |
4.2 × 10⁻³
[1.2 × 10⁻³, 7.3 × 10⁻³] |
0.005 |
−1.7 × 10⁻³
[−6.1 × 10⁻³, 2.7 × 10⁻³] |
0.439 |
−2.0 × 10⁻³
[6.3 × 10⁻³, 2.3 × 10⁻³] |
0.352 |
All coefficients shown reflect the additional annual change in denoted disease measures (added to predicted annual change at mean biomarker level) with each standard deviation increase in the denoted baseline CSF biomarkers. All P‐values shown refer to the interaction of baseline CSF biomarker levels and time in determining the dependent variable. The depicted P‐values refer to analysis including all available cases. All P‐values marked with “1” were no longer statistically significant after removing 4 bvFTD cases with a CSF t‐tau/Aβ 1‐42 ratio over 0.52. The standard deviation (SD) used to calculate change was 3973 pg/mL for NfL, 37.1 pg/mL for t‐tau, 9.7 pg/mL for p‐tau, and 164.3 pg/mL for Aβ 1‐42. Aβ 1‐42, amyloid beta1‐42; bvFTD, behavioral variant frontotemporal dementia; CI, 95% confidence interval; CSF, cerebrospinal fluid; FA, fractional anisotropy; NfL, neurofilament light chain; nfvPPA, nonfluent variant primary progressive aphasia; p‐tau, phosphorylated tau181; SD, standard deviation; svPPA, semantic variant primary progressive aphasia; t‐tau, total tau.
Figure 2.

Baseline CSF biomarkers predict trajectory in bvFTD and nfvPPA. All P‐values shown refer to the interaction of baseline CSF biomarker levels and time in determining the dependent variable. The depicted P‐values refer to analysis including all available cases. All P‐values in grey font refer to bvFTD while P‐values in black front refer to nfvPPA. All P‐values marked with “†” were no longer statistically significant after removing cases with a CSF t‐tau/Aβ 1‐42 ratio over 0.52. The Z‐scores in this figure represent continuous data. The mean baseline CSF biomarker levels used for calculating Z‐scores were as follows: 5699 pg/mL NfL (SD 3973 pg/mL), 82.1 pg/mL t‐tau (SD 37.1 pg/mL), 22.9 pg/mL p‐tau (SD 9.7 pg/mL), and 412.4 pg/mL Aβ 1‐42 (SD 164.3 pg/mL). Aβ 1‐42, amyloid beta1‐42; bvFTD, behavioral variant frontotemporal dementia; CSF, cerebrospinal fluid; FA, fractional anisotropy; NfL, neurofilament light chain; nfvPPA, nonfluent variant primary progressive aphasia; p‐tau, phosphorylated tau181; SD, standard deviation; svPPA, semantic variant primary progressive aphasia; t‐tau, total tau.
Table 4.
Rate of clinical change above and below median CSF biomarker concentrations
| Cut point used | n | CDR‐FTLD annual increase | 95% CI | P |
|---|---|---|---|---|
| bvFTD | ||||
| NfL > 4.17 × 10³ pg/mL | 20 | 3.4 | (2.4, 4.4) | <0.0005 |
| NfL < 4.17 × 10³ pg/mL | 20 | 0.2 | (−0.36, 0.83) | 0.444 |
| p‐tau > 19.8 pg/mL | 20 | 2.9 | (1.9, 3.9) | <0.0005 |
| p‐tau > 19.8 pg/mL | 20 | −0.1 | (−0.7, 0.58) | 0.849 |
| nfvPPA | ||||
| NfL> 5.17 × 10³ pg/mL | 13 | 2.4 | (1.2, 3.6) | <0.0005 |
| NfL<5.17 × 10³ pg/mL | 13 | 0.1 | (−0.53, 0.80) | 0.692 |
| t‐tau> 75.8 pg/mL | 13 | 1.9 | (0.76, 3.0) | 0.001 |
| t‐tau<75.8 pg/mL | 13 | 0.6 | (−0.34, 1.6) | 0.203 |
Higher CSF NfL levels also predicted more rapid worsening in other clinical measures (Table S2) including FAQ total, MMSE total, CVLT immediate and delayed recall, Stroop interference, and BNT total (even after excluding cases with a CSF tau/Aβ 1‐42 ratio over 0.52). Additionally, higher baseline CSF p‐tau also predicted more rapid decline in the SEADL, after excluding possible comorbid Alzheimer's pathology.
Higher baseline CSF NfL and lower baseline Aβ 1‐42 predicted a faster rate of frontotemporal volume loss (Table 3, Fig. 2E and H). High baseline CSF NfL and low baseline CSF Aβ 1‐42 also predicted a faster rate of decline in frontotemporal FA in patients with bvFTD (Fig. 2I and L). The relationship between NfL and Aβ 1‐42 with frontotemporal imaging measures remained statistically significant even after excluding cases with potential co‐pathology, including patients with motor neuron disease and positive AD biomarkers (Table S2). CSF p‐tau/t‐tau ratio was not a useful predictor of MR imaging changes in bvFTD.
Baseline NfL and total tau predict change in nfvPPA
Higher baseline CSF NfL and higher t‐tau each predicted a faster rate of CDR‐FTLD SB worsening in patients with nfvPPA (Table 3, Fig. 2A and B). On average, within the nfvPPA cohort patients above the median t‐tau NfL concentration (5.17 x 10³pg/mL) increased by 2.4 CDR‐FTLD units annually, patients above the median t‐tau concentration (75.8 pg/mL) increased by 1.9 CDR‐FTLD units annually, and patients below the mean for either biomarker experienced minimal clinical change annually (Table 4).
In post hoc analyses, higher CSF NfL levels predicted a faster rate of worsening in CGI severity, the Stroop inhibition task, and sematic fluency (Table S3). Additionally, high CSF t‐tau predicted a faster rate of change in CGI Severity.
High baseline CSF NFL and total tau were each associated with a faster rate of frontotemporal volume loss in patients with nfvPPA (Table 3, Fig. 2E and F). High baseline CSF NfL and t‐tau also predicted a faster rate of decline in frontotemporal FA in patients with nfvPPA (Fig. 2I and J).
In patients with nfvPPA, the predictive value of CSF NfL remained even after excluding possible co‐pathology (a single case with motor neuron disease). CSF p‐tau and p‐tau/t‐tau ratio were not a useful predictors of clinical change in nfvPPA.
Baseline CSF biomarkers in svPPA
Within the svPPA cohort, the predictive value of CSF biomarkers did not meet our pre‐specified criteria for statistical significance after correction for multiple comparisons (Table 3, Table S4). High baseline NfL did, however, tend to be associated with a faster rate of decline in MMSE score, right temporal volume, right uncinated fasciculus FA, and corpus callosum genu FA. Additionally, high p‐tau tended to be associated with a faster rate of decline in lexical fluency.
CSF biomarkers have less predictive value in svPPA and FTLD‐TDP
In models containing all three clinical FTD variants, clinical diagnosis and CSF biomarkers interacted to determine the rate of disease change over time (Table S5). In general, baseline CSF NfL predicted a greater degree of clinical and volumetric change in bvFTD and nfvPPA compared to svPPA. Baseline CSF t‐tau also predicted a greater degree of clinical change in nfvPPA and bvFTD compared to svPPA. Finally, Aβ 1‐42 predicted a greater degree of volumetric and DTI change in bvFTD compared to svPPA. These three‐way interaction model results were used to validate our approach to analyze each FTD clinical cohort separately in our two‐way interaction models.
High baseline CSF NfL predicted a particularly large increase in the annual rate of CDR‐FTLD SB and frontotemporal volume loss in patients with FTLD‐TDP relative to FTLD tau (Table S5). High baseline CSF p‐tau also predicted a particularly large increase in the annual rate of CDR‐FTLD SB change in FTLD‐tau relative to FTLD‐TDP. High Aβ 1‐42 was also associated with relatively higher rates of frontotemporal volume loss in FTLD‐tau compared to FTLD‐TDP. Given the high burden of motor neuron disease within the FTD‐TDP cohort, we were unable to exclude patients with this co‐pathology in sensitivity analyses.
CSF NfL levels over time
The relationship between time and NfL change did not meet our prespecified criteria for statistical significance in the 27 patients with FTD and longitudinal CSF NfL data (β = 298 pg/mL/year, 95% CI [−4261, 4858], P = 0.893, R 2 = 0.02) (Fig. 3). The relationship between time and NfL change was also not statistically significant when bvFTD (n = 14, β = 964 pg/mL/year, 95% CI [−7535, 9465], P = 0.8, R 2 = 0.09), svPPA (n = 5, β = 659 pg/mL/year, 95% CI [−4321, 5639], P = 0.34, R 2 = 0.96), and nfvPPA (n = 8, β = −193 pg/mL/year, 95% CI [−7058, 6672], P = 0.942, R 2 = 0.06) cohorts were analyzed separately. A single case with bvFTD (a 67‐year‐old ambidextrous male with no known pathogenic mutation and a 5‐year prior disease duration) was noted to experience a distinct increase in CSF NfL (+16,605 pg/mL) over 9 months. His level of clinical worsening (+3 CDR‐FTLD SB units), frontotemporal volume loss (−9602 mm3), and frontotemporal FA loss (−0.01 FA) were higher than expected for his baseline CSF biomarker levels (NfL 1149 pg pg/mL, Z score = −1.14; t‐tau 38.3 pg/mL, Z score = −1.2; p‐tau 15.7 pg/mL, Z score = −0.80; Aβ 1‐42 484.96, z score = 0.43) when compared to predicted rates of change (Fig. 2). His baseline CSF t‐tau/Aβ 1‐42 ratio was 0.08 (not suggestive of emerging AD co‐pathology). We did not collect data on longitudinal t‐tau, p‐tau, or Aβ 1‐42 change.
Figure 3.

CSF NfL concentrations are stable over time in FTD. Among the 27 cases with longitudinal CSF NfL data, there was not a statistically significant increase in NfL over time (P = 0.893). Additionally, there was not a statistically significant change in CSF NfL when the bvFTD (n = 14, P = 0.806), svPPA (n = 5, P = 0.345), and nfvPPA (n = 8, P = 0.953) cohorts were analyzed separately.
Discussion
We found that CSF NfL concentration predicts the rate of disease progression in patients with sporadic bvFTD and nfvPPA but not svPPA. To a lesser extent, CSF p‐tau, t‐tau, and Aβ 1‐42 were also able to predict some aspects of disease progression in FTD. Patients with high NfL experienced the steepest annual decline in both clinical rating scales and MRI measurements. These findings are consistent with previous studies establishing the prognostic value of both CSF7, 8, 36 and plasma7, 9 NfL in genetic FTD syndromes. Within our bvFTD and nfvPPA cohorts, median CSF NfL levels (4.1 × 10³ pg/mL and 5.17 × 10³ pg/mL, respectively) separated patients into subgroups with clinically significant annual change and clinically negligible annual change. While our precise median cut points should be validated in separate cohorts, our findings suggest that FTD aggressiveness can be stratified by baseline CSF NfL. Analogous to histological grading of cancer, NfL concentration might allow FTD aggressiveness to be graded as low, intermediate, and high in future studies. Our findings expand on previous research by establishing the superior prognostic value of CSF NfL in bvFTD and nfvPPA relative to svPPA. Additionally, our study extends upon previous research by establishing NfL as a baseline predictor of DTI changes in FTD. Given the role of NfL in axonal structure and function, it is reasonable that CSF NfL levels should predict change in imaging measures of axon integrity.
Our study provides new information on the prognostic value of CSF t‐tau, p‐tau, and Aβ 1‐42 in differing FTD cohorts. Our sample sizes precluded a formal analysis using multivariate models to demonstrate a statistically significant advantage for NfL over other CSF markers, but NfL more consistently predicted change in disease measures among FTD variants. Compared to CSF NfL, CSF p‐tau was of similar predictive value only within our bvFTD cohort while t‐tau was of similar predictive value only in our nfvPPA cohort. Additionally, Aβ 1‐42 was comparable to NfL as a predictor or imaging changes (volumetric and DTI) in patients with bvFTD. The precise determinants of CSF t‐tau, p‐tau, and Aβ 1‐42 levels are unclear. The relative levels of p‐tau and t‐tau may reflect specific differences in tau production, post‐translational modification, or degradation that vary between each FTLD pathologic subtype. Despite the unclear mechanism of release, CSF tau is generally regarded as an indicator of ongoing neuronal injury, so it is reasonable that CSF tau levels should predict FTD aggressiveness. On the other hand, the predictive value of Aβ 1‐42 is unexpected within a FTD cohort (particularly in light of our follow‐up sensitivity analysis, excluding cases that met CSF criteria for AD co‐pathology). Moreover, while low baseline Aβ 1‐42 predicted faster radiographic change in bvFTD, we found that high baseline CSF Aβ 1‐42 predicted a faster volumetric change in FTLD‐tau compared to FTLD‐TDP. If this observation can be appropriately validated and explored in a separate larger patient cohort, it may suggest a stark difference in the role of Aβ 1‐42 in FTLD‐tau compared to FTLD‐TDP. There is evidence that extracellular tau regulates neuronal production of amyloid beta, by mediating neuronal hyperactivity.38 Thus, the predictive value of Aβ 1‐42 may reflect the downstream impact of extracellular tau rather than the direct role of Aβ 1‐42 in FTD pathophysiology. Alternatively, our findings may reflect the pathogenicity of early comorbid Aβ 1‐42 deposition in FTD, preceding frank biomarker‐positive Alzheimer's disease. Consistent with previous studies,36, 37 patients with FTLD‐TDP had relatively low p‐tau/t‐tau ratios compared to patients with FTLD‐tau, and a cutoff ratio of 0.29 gave modest sensitivity and specificity in detecting FTLD‐TDP en vivo. It should be noted that our FTLD‐TDP and FTLD‐tau cohorts did not include patients with svPPA (due to the limitations of our data), and our FTLD‐TDP cohort had a high burden of motor neuron disease. Additionally, our patients with svPPA did not have particularly low p‐tau/t‐tau ratios despite the high incidence of FTLD‐TDP in other svPPA cohorts.39 For these reasons, the utility of CSF p‐tau/t‐tau ratio may be hard to generalize outside of our own FTD cohorts. Ultimately, the utility of CSF p‐tau/t‐tau ratio would be best validated in a separate cohort with more autopsy‐confirmed pathological data.
We were unable identify clinically useful predictors of disease trajectory in svPPA. We observed that high baseline CSF NfL and p‐tau were better at predicting disease progression in FTLD‐tau than in FTLD‐TDP. Thus, it is reasonable that CSF biomarkers should be less useful at predicting disease change in svPPA, a cohort largely representing FTLD‐TDP pathology.39 Given our small sample sizes, our analysis may have been underpowered to detect relatively subtle effects of baseline NfL in svPPA. Our conservative method of correction for multiple comparisons further increased the chance of type II error in our study. Additionally, the predictive value of CSF NfL may reach a ceiling value after which increases in NfL no longer bestows any additional ability to predict disease trajectory. The svPPA and FTLD‐TDP cohorts tended to have higher CSF NfL values (though this difference was not statistically significant) and were thus more likely to show a ceiling effect. If this were the explanation for our discrepant findings, NfL could still be an attractive predictor in earlier phases of svPPA. In ALS cohorts, CSF NfL is an established predictor of clinical trajectory.40 Thus, NfL is likely to have prognostic value in some selected FTLD‐TDP cohorts.
Our study did not detect a consistent increase in NfL over time within individual disease cohorts or within the entire FTD cohort. Our data are complemented by previous studies suggesting that CSF levels are stable over time in ALS41 and plasma NfL levels are stable over time in symptomatic familial FTD.7 In contrast to our cohort, NfL levels markedly increase in FTLD mutation carriers first transitioning to symptomatic disease.7 It is possible that NfL may similarly change in other disease transition points in patients who are already symptomatic. This phenomenon may explain the distinct increase in NfL levels over 9 months in an individual participant with bvFTD in our study. Interestingly, one of the few studies to consider serum NfL separately in differing primary progressive aphasia cohorts contrasts with our study findings.42 In this previous study by Steinecker et al., serum NfL increased over time in svPPA and nfvPPA and did not predict disease progression. Our study utilized a smaller amount of longitudinal fluid data points and may have consequently been less able to detect NfL change over time in nfvPPA and svPPA. Our study, however, did utilize LME models to leverage a larger amount of longitudinal neuropsychological testing and radiographic data points for each patient. Thus, our study may have been better suited to identify baseline predictors of subsequent clinical or radiographic change in separate FTD cohorts.
This study had several limitations. The longitudinal relationship between CSF biomarkers and FTD disease burden will be better elucidated within a larger longitudinal data set. Our small sample sizes may have increased the risk of type 1 error. Our relatively small sample size also precluded a formal analysis using multivariate models to demonstrate a statistically significant advantage for NfL over other CSF markers. Our findings relied on CSF samples, which require a lumbar puncture. Given previous data establishing the prognostic value of plasma NfL in some clinical settings, as well as the correlation between plasma and CSF NfL levels, future studies should emphasize comparisons between CSF and plasma markers as baseline predictors of decline in individual FTD cohorts. Additionally, studies with more complete autopsy data will help to better discern the relative utility of CSF biomarkers in each proteinopathy group. Finally, our study pooled NfL levels from two separate labs (albeit using the same methods and kits). We controlled for the site of measurement in our statistical models, but the inclusion of two sets of data may have introduced an additional source of error.
This study establishes CSF biomarkers as potential tools in the design of FTD clinical trials and in prognostic decision making in patients with FTD. Our results suggest that multiple CSF protein biomarkers predict disease progression in FTD and that CSF NfL may be a particularly versatile measure. CSF tau and Aβ 1‐42 may also have predictive value, though in a more limited set of clinical and radiographic measures. Future clinical trials in FTD may utilize CSF biomarkers in inclusion and exclusion criteria and thus allow for greater patient uniformity and statistical power with which to establish drug efficacy. Additionally, future therapeutic trials may potentially seek to levels of NfL and other CSF biomarkers and thereby target a predictor of improved longer‐term outcomes.
Author Contributions
PAL, AMS, and JCR contributed to the conception of the study, design of the study, acquisition and analysis of data, and drafting of a significant portion of the manuscript and figures. IEA contributed to the conception of the study, design of the study and drafting of a significant portion of the manuscript and figures. PW and HW contributed to drafting of a significant portion of the manuscript and figures. AK contributed to acquisition and analysis of data. JK contributed to conception of the study, design of the study, and analysis of data. YC, WWS, LTG, SS, AMF, and GJ contributed to acquisition and analysis of data. DK, BFB, BCD, JK, and BLM contributed to the conception of the study, design of the study, acquisition and analysis of data. ALM and HJR contributed to the conception of the study, design of the study, acquisition and analysis of data, and drafting of a significant portion of the manuscript and figures.
Conflicts of Interest
All authors have submitted International Committee of Medical Journal Editors (ICMJE) conflict of interest forms. Dr. Fagan reported grants from Fujirebio, Inc., manufacturer of assay kits used in this study. No other authors reported commercial relationships of direct relevance to the current research. Some NfL samples in this study were analyzed by an outside clinical research organization, Bristol‐Myers Squibb (BMS). All analyses done by BMS employees were done blinded to diagnosis, and UCSF collaborators had complete access to all data.
Supporting information
Table S1. ROC analysis of low p‐tau/t‐tau ratio in detecting FTLD‐TDP pathology.
Table S2. Annual clinical and radiographic change in bvFTD adjusted by CSF biomarkers.
Table S3. Annual clinical and radiographic change in nfvPPA adjusted by CSF biomarkers.
Table S4. Annual clinical and radiographic change in svPPA adjusted by CSF biomarkers.
Table S5. Annual clinical and radiographic change in svPPA adjusted by CSF biomarkers.
Acknowledgments
This study was made possible through funding by the National Institute of Health (NIH), National Institute on Aging (NIA) and was supported by the following grants: K24 AG045333‐01P01 AG019724‐09, R01 AG032306, U54 NS092089.
Funding Information
This study was made possible through funding by the National Institute of Health (NIH), National Institute on Aging (NIA) and was supported by the following grants: K24 AG045333‐01, P01 AG019724‐09, P50 AG23501 R01 AG032306, U54 NS092089.
Funding Statement
This work was funded by NIH/NIA grants K24 AG045333‐01, P01 AG019724‐09, P50 AG23501, R01 AG032306, and U54 NS092089.
References
- 1. Dugger BN, Dickson DW. Pathology of neurodegenerative diseases. Cold Spring Harb Perspect Biol 2017;9(7). [DOI] [PMC free article] [PubMed] [Google Scholar]
- 2. Meeter LH, Kaat LD, Rohrer JD, van Swieten JC. Imaging and fluid biomarkers in frontotemporal dementia. Nat Rev Neurol 2017;13:406–419. [DOI] [PubMed] [Google Scholar]
- 3. Rivero‐Santana A, Ferreira D, Perestelo‐Pérez L, et al. Cerebrospinal fluid biomarkers for the differential diagnosis between Alzheimer's disease and frontotemporal lobar degeneration: systematic review, HSROC analysis, and confounding factors. J Alzheimer's Dis 2016;55:625–644. [DOI] [PubMed] [Google Scholar]
- 4. Rosso SM, van Herpen E, Pijnenburg YAL, et al. Total tau and phosphorylated tau 181 levels in the cerebrospinal fluid of patients with frontotemporal dementia due to P301L and G272V tau mutations. Arch Neurol 2003;60:1209–1213. [DOI] [PubMed] [Google Scholar]
- 5. Bian H, Van Swieten JC, Leight S, et al. CSF biomarkers in frontotemporal lobar degeneration with known pathology. Neurology 2008;70(19 Pt 2):1827–1835. [DOI] [PMC free article] [PubMed] [Google Scholar]
- 6. Petzold A. Neurofilament phosphoforms: surrogate markers for axonal injury, degeneration and loss. J Neurol Sci 2005;233:183–198. [DOI] [PubMed] [Google Scholar]
- 7. Meeter LH, Dopper EG, Jiskoot LC, et al. Neurofilament light chain: a biomarker for genetic frontotemporal dementia. Ann Clin Transl Neurol 2016;3:623–636. [DOI] [PMC free article] [PubMed] [Google Scholar]
- 8. Scherling CS, Hall T, Berisha F, et al. Cerebrospinal fluid neurofilament concentration reflects disease severity in frontotemporal degeneration. Ann Neurol 2014;75:116–126. [DOI] [PMC free article] [PubMed] [Google Scholar]
- 9. Rohrer JD, Woollacott IOC, Dick KM, et al. Serum neurofilament light chain protein is a measure of disease intensity in frontotemporal dementia. Neurology 2016;87:1329–1336. [DOI] [PMC free article] [PubMed] [Google Scholar]
- 10. Skillbäck T, Farahmand B, Bartlett JW, et al. CSF neurofilament light differs in neurodegenerative diseases and predicts severity and survival. Neurology 2014;83:1945–1953. [DOI] [PubMed] [Google Scholar]
- 11. Neary D, Snowden JS, Gustafson L, et al. Frontotemporal lobar degeneration: a consensus on clinical diagnostic criteria. Neurology 1998;51:1546–1554. [DOI] [PubMed] [Google Scholar]
- 12. Rascovsky K, Hodges JR, Knopman D, et al. Sensitivity of revised diagnostic criteria for the behavioural variant of frontotemporal dementia. Brain 2011;134:2456–2477. [DOI] [PMC free article] [PubMed] [Google Scholar]
- 13. Gorno‐Tempini M, Hillis A, Weintraub S, et al. Classification of primary progressive aphasia and its variants. Neurology 2011;76:1006–1014. [DOI] [PMC free article] [PubMed] [Google Scholar]
- 14. Perry DC, Brown JA, Possin KL, et al. Clinicopathological correlations in behavioural variant frontotemporal dementia. Brain 2017;140:3329–3345. [DOI] [PMC free article] [PubMed] [Google Scholar]
- 15. Litvan I, Agid Y, Calne D, et al. Clinical research criteria for the diagnosis of progressive supranuclear palsy (Steele‐Richardson‐Olszewski syndrome): report of the NINDS‐SPSP international workshop [Review] [88 refs]. Neurology 1996;47:1–9. [DOI] [PubMed] [Google Scholar]
- 16. Duits FH, Teunissen CE, Bouwman FH, et al. The cerebrospinal fluid “alzheimer profile”: easily said, but what does it mean? Alzheimer's Dement 2014;10:713–723. [DOI] [PubMed] [Google Scholar]
- 17. Knopman DS, Kramer JH, Boeve BF, et al. Development of methodology for conducting clinical trials in frontotemporal lobar degeneration. Brain 2008;131(Pt 11):2957–2968. [DOI] [PMC free article] [PubMed] [Google Scholar]
- 18. Pfeffer RI, Kurosaki TT, Harrah CH, et al. Measurement of functional activities in older adults in the community. J Gerontol 1982;37:323–329. [DOI] [PubMed] [Google Scholar]
- 19. Busner J, Targum SD. The clinical global impressions scale: applying a research tool in clinical practice. Psychiatry (Edgmont) 2007;4:28–37. [PMC free article] [PubMed] [Google Scholar]
- 20. Schwab R, England A. Projection technique for evaluating surgery in Parkinson's disease In: Billingham F. H., Donaldson M. C., eds. Third symposium on parkinson's disease. pp. 152–157. Edinburgh: Churchill Livingstone, 1969. [Google Scholar]
- 21. Cummings JL, Mega M, Gray K, et al. The neuropsychiatric inventory: comprehensive assessment of psychopathology in dementia. Neurology 1994;44:2308–2314. [DOI] [PubMed] [Google Scholar]
- 22. Folstein MF, Folstein SE, McHugh PR. “Mini‐mental state”. A practical method for grading the cognitive state of patients for the clinician. J Psychiatr Res 1975;12:189–198. [DOI] [PubMed] [Google Scholar]
- 23. Delis DC, Kramer JH, Kaplan E, Ober BA. California Verbal Learning Test ‐ second edition. Adult version. Manual. San Antonio, Tex.: Psychological Corporation; 2000.
- 24. Wechsler D. Wechsler adult intelligence scale. San Antonio, TX: Psychological Corporation, 1997. [Google Scholar]
- 25. Kramer JH, Jurik J, Sha SJ, et al. Distinctive neuropsychological patterns in frontotemporal dementia, semantic dementia, and Alzheimer disease. Cogn Behav Neurol 2003;16:211–218. [DOI] [PubMed] [Google Scholar]
- 26. Stroop JR. Studies of interference in serial verbal reactions. J Exp Psychol 1935;18:643–662. [Google Scholar]
- 27. Delis DC, Kaplan E, Kramer JH. Delis‐kaplan executive function system (DKEFS): examiner's manual. San Antonio, TX: The Psychological Corporation, 2001. [Google Scholar]
- 28. Kaplan E, Goodglass H, Weintraub S. Boston naming test. Philadelphia: Lea & Febiger, 1983. [Google Scholar]
- 29. Dunn LM, Dunn LM. Peabody picture vocabulary test ‐ revised. Circle Pines, MN: American Guidance Service, 1981. [Google Scholar]
- 30. Howard D, Patterson K. Pyramids and palm trees: a test of semantic access from pictures and words. Bury St. Edmunds, UK: Thames Valley Test Company, 1992. [Google Scholar]
- 31. Pankov A, Binney RJ, Staffaroni AM, et al. Data‐driven regions of interest for longitudinal change in frontotemporal lobar degeneration. Neuroimage Clin 2016;12:332–340. [DOI] [PMC free article] [PubMed] [Google Scholar]
- 32. Desikan RS, Ségonne F, Fischl B, et al. An automated labeling system for subdividing the human cerebral cortex on MRI scans into gyral based regions of interest. NeuroImage 2006;31:968–980. [DOI] [PubMed] [Google Scholar]
- 33. Elahi FM, Marx G, Cobigo Y, et al. Longitudinal white matter change in frontotemporal dementia subtypes and sporadic late onset Alzheimer's disease. Neuroimage Clin 2017;16:595–603. [DOI] [PMC free article] [PubMed] [Google Scholar]
- 34. Mori S (Susumu), Crain BJ. MRI atlas of human white matter. Amsterdam, the Netherlands: Elsevier, 2005. [Google Scholar]
- 35. D'Agostino RB, Belanger A. A suggestion for using powerful and informative tests of normality. Am Stat 1990;44:316. [Google Scholar]
- 36. Meeter LHH, Vijverberg EG, Del Campo M, et al. Clinical value of neurofilament and phospho‐tau/tau ratio in the frontotemporal dementia spectrum. Neurology 2018;. 10.1212/WNL.0000000000005261. [DOI] [PMC free article] [PubMed] [Google Scholar]
- 37. Hu WT, Watts K, Grossman M, et al. Reduced CSF p‐Tau181 to Tau ratio is a biomarker for FTLD‐TDP. Neurology 2013;81:1945–1952. [DOI] [PMC free article] [PubMed] [Google Scholar]
- 38. Bright J, Hussain S, Dang V, et al. Human secreted tau increases amyloid‐beta production. Neurobiol Aging 2015;36:693–709. [DOI] [PubMed] [Google Scholar]
- 39. Spinelli E, Mandelli ML, Santos M, et al. In vivo correlates of pathological diagnosis in primary progressive aphasia (P4.009). Neurology 2016;86(16 Supplement):P4.009. [Google Scholar]
- 40. Gaiani A, Martinelli I, Bello L, et al. Diagnostic and prognostic biomarkers in amyotrophic lateral sclerosis. JAMA Neurol 2017;74:525. [DOI] [PMC free article] [PubMed] [Google Scholar]
- 41. Lu C‐H, Macdonald‐Wallis C, Gray E, et al. Neurofilament light chain: a prognostic biomarker in amyotrophic lateral sclerosis. Neurology 2015;84(22):2247–2257. [DOI] [PMC free article] [PubMed] [Google Scholar]
- 42. Steinacker P, Semler E, Anderl‐Straub S, et al. Neurofilament as a blood marker for diagnosis and monitoring of primary progressive aphasias. Neurology 2017;88:961–969. [DOI] [PubMed] [Google Scholar]
Associated Data
This section collects any data citations, data availability statements, or supplementary materials included in this article.
Supplementary Materials
Table S1. ROC analysis of low p‐tau/t‐tau ratio in detecting FTLD‐TDP pathology.
Table S2. Annual clinical and radiographic change in bvFTD adjusted by CSF biomarkers.
Table S3. Annual clinical and radiographic change in nfvPPA adjusted by CSF biomarkers.
Table S4. Annual clinical and radiographic change in svPPA adjusted by CSF biomarkers.
Table S5. Annual clinical and radiographic change in svPPA adjusted by CSF biomarkers.