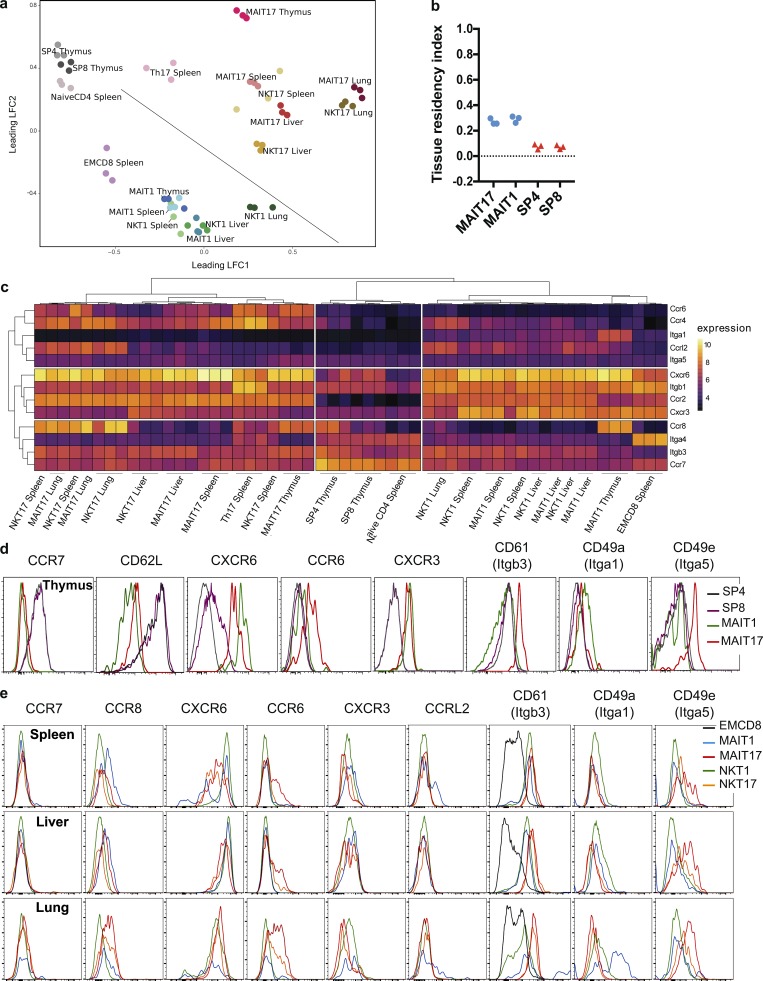
Figure 6.
MAIT subsets acquire a tissue targeting program in the thymus. (a) MDS scatter plot summarizing the expression levels of the 10% most variable transcripts in the indicated samples. (b) Tissue residency index (see Materials and methods) evaluated in the different subsets. (c) Heat map displaying the expression of a selected list of chemokine receptors and integrins by thymic subsets. (d and e) Chemokine receptor and integrin protein expression by the different NKT and MAIT cell subsets in the thymus (d) and in the spleen, liver, and lungs (e; n = 3).

