
Fig. 4.
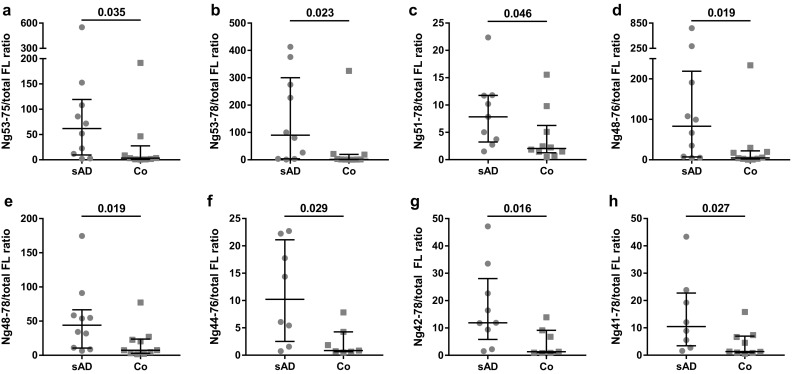
Scatterplots displaying the result from hybrid-immunoaffinity mass spectrometry in study 1. Scatterplots displaying the peptide-to-total full-length Ng ratio ×1000 for Ng53–75 (a), Ng53–78 (b), Ng51–78 (c), Ng48–76 (d), Ng48–78 (e), Ng44–76 (f), Ng42–78 (g) and Ng41–78 (h). The data presented are median and interquartile ranges. Differences between groups were assessed using Mann–Whitney U test