

The biochemical response to food intake must be precisely regulated. Because ingested sugars and fats can feed into many anabolic and catabolic pathways1, how our bodies handle nutrients depends on strategically-positioned metabolic sensors that link a meal’s intrinsic nutritional value with intermediary metabolism. We discovered that a subset of immune cells, specifically integrin β7+ natural gut intraepithelial T lymphocytes (natural IELs), dispersed throughout the small intestine’s enterocyte layer, modulate systemic metabolism. β7− mice lacking natural IELs are metabolically hyperactive and, when fed a high fat and sugar diet, resist obesity, hypercholesterolemia, hypertension, diabetes, and atherosclerosis. Protection from cardiovascular disease in the absence of natural IELs, we further show, depends on the enterocyte-derived incretin GLP-12, which IELs normally control via IEL GLP-1 receptor expression. In this metabolic control system, IELs oppose enterocytes by acting as gatekeepers that limit GLP-1 bioavailability. While its function may prove advantageous when food is scarce, overabundance of diets high in fat and sugar render this metabolic checkpoint inimical to health.
Though β7 directs immune cells to the gut3–8, we know little about the integrin’s influence on metabolism, despite the gut’s strategic location9. Puzzlingly, β7−/− mice consuming a chow diet gained weight similarly to control wild type (WT) mice (Fig. 1a) but ate more food (Fig. 1b) despite being equally active (Extended Data Fig. 1a). This inconsistency prompted us to measure energy usage. We found that β7−/− mice expended more energy (Fig. 1c) and produced more heat (Fig. 1d), though their respiratory exchange rate was similar to WT mice (Extended Data Fig. 1b,c). The data suggest a heightened basal metabolism. We therefore performed whole-body [18F]-FDG PET/CT imaging to assess regional glucose uptake, and discovered that β7−/− mice accrued more glucose in the brown fat compared to WT controls (Fig. 1e, f and Extended Data Fig. 1d). The β7−/− mice were more glucose tolerant (Fig. 1g), even at thermoneutrality (Extended Data Fig 1e), and had higher plasma insulin levels (Fig. 1h) without changes in insulin sensitivity (Fig. 1i). The microbiome appeared unrelated to the phenomenon (Extended Data Fig 1f, g). Moreover, the phenomenon was neither restricted to glucose, because β7−/− mice had lower fasting triglyceride (TG) levels (Fig. 1j) and better fat tolerance (Fig. 1k) without differences in hepatic TG secretion (Fig. 1l), nor did the effect associate with absorption or permeability abnormalities (Extended Data Fig 1h).
Figure 1. Integrin β7 regulates metabolism.
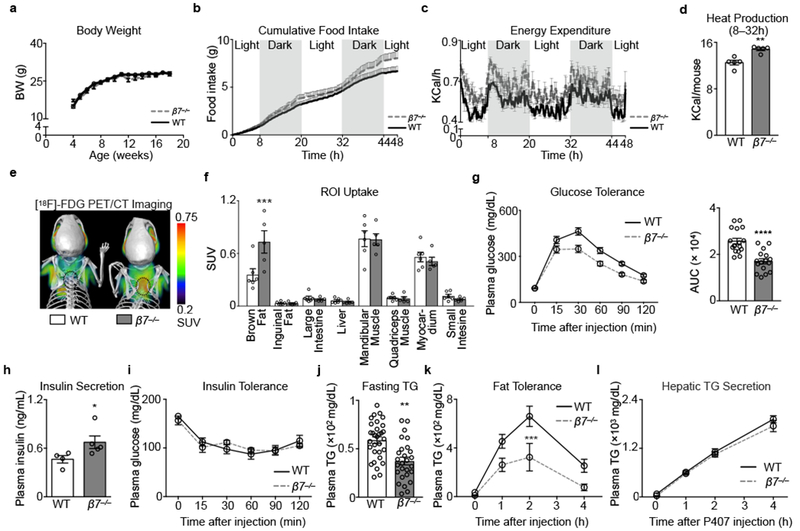
a, Body weight, b, Cumulative food intake, c, Energy expenditure and d, Heat production in WT and β7−/− mice consuming chow (n = 5 mice per group). e, Representative (of 6 and 5) PET/CT images after [18F]-FDG administration to WT and β7−/− mice. f, Standard update values (SUV) quantified in vivo in indicated regions of interest (ROI) (n = 6 WT; n = 5 β7−/− mice). g, Left: glucose tolerance test in WT and β7−/− mice consuming chow after i.p. glucose injection; right: Area under curve (AUC) of ipGTT. (n = 17 WT; n = 16 β7−/− mice). h, Plasma insulin levels in WT and β7−/− mice 15 min after glucose stimulation (n = 4 WT; n = 5 β7−/− mice). i, Insulin tolerance test in WT and β7−/− mice on chow (n = 5 WT and n = 4 β7−/− mice). j, Plasma triglyceride (TG) levels of fasted WT and β7−/− mice (n = 31 WT; n = 27 β7−/− mice). k, Fat tolerance test in WT and β7−/− mice on chow after i.p. injection of 20% Intralipid (n = 5 mice per group) ***P < 0.001, Two-way ANOVA test. l, Hepatic triglyceride (TG) secretion. Overnight fasted WT and β7−/− mice were injected i.p. with lipase inhibitor Poloxamer 407 and the plasma TG levels were determined at indicated time points (n = 4 WT; n = 3 β7−/− mice). Data presented as mean ± s.e.m, *P<0.05, **P < 0.01,***P < 0.001, ****P < 0.0001, Mann-Whitney two-tailed tests unless otherwise indicated.
We next tested whether the beneficial metabolic alterations in β7−/− mice were sustained in the context of the “metabolic syndrome” component cluster10. β7−/− mice consuming a diet high in fat, sugar, and sodium (HFSSD) remained relatively lean, unlike their WT counterparts, which became obese (Fig. 2a). Both inguinal white adipose tissue (iWAT) and perigonadal white adipose tissue (pWAT) were heavier in WT mice than in β7−/− mice, but other tissue weights remained similar (Fig. 2b). Furthermore, adipocytes in iWAT and pWAT were larger in WT mice than in β7−/− mice (Fig. 2c-e). Flow cytometry of both iWAT and pWAT showed fewer accumulated Ly-6Chigh monocytes, neutrophils, and macrophages in β7−/− mice, indicating that β7−/− mice were protected from obesity-associated inflammation (Extended Data Fig. 2a,b)11,12. Unlike WT control mice, β7−/− mice did not develop hypertension (Fig. 2f) and, similar to observations made in animals consuming chow, β7−/− mice remained more glucose tolerant (Fig. 2g and Extended Data Fig. 2c, d) compared to WT mice, thereby indicating protection against adverse metabolic consequences of high fat feeding.
Figure 2. Integrin β7 deficiency protects from metabolic syndrome.

a, Body weights of WT and β7−/− mice consuming HFSSD for 5 months (n = 9 WT; n = 8 β7−/− mice). The representative pictures of WT and β7−/− mice are shown on the left. Black dots denote pictured animals. b, Tissue weights of WT and β7−/− mice after 5 months of HFSSD (n = 10 mice per group, except heart n = 5). c, Representative H&E images of inguinal white adipose tissue (iWAT) and perigonadal white adipose tissue (pWAT) of WT (of 5) and β7−/− (of 4) mice on HFSSD for 5 months. d-e, Quantification of adipocytes at indicated size ranges in iWAT and pWAT of WT and β7−/− mice on HFSSD for 5 months (n = 5 WT; n = 4 β7−/− mice). Nonparametric multiple comparisons test was used. f, Blood pressure measurements of mice consuming HFSSD at indicated time points (n = 5 mice per group). g, Glucose tolerance test in WT and β7−/− mice consuming HFSSD for 5 months by oral glucose gavage (2 g/kg body weight); right: AUC of GTT. (n = 10 WT; n = 7 β7−/− mice). Data presented as mean ± s.e.m, *P<0.05, **P < 0.01,***P < 0.001, ****P < 0.0001, Mann-Whitney two-tailed tests unless otherwise indicated.
Because β7−/− mice had heightened metabolism and exhibited fewer metabolic syndrome components, we tested whether they also resisted atherosclerosis, which is a chronic, lipid-driven inflammatory disease13. We generated Ldlr−/− chimeras reconstituted with either β7−/− or WT bone marrow and found that mice with β7−/− bone marrow (bmβ7−/− Ldlr−/−) fed a diet high in cholesterol (HCD) had considerably lower plasma total cholesterol compared to controls (bmWT Ldlr−/−) (Fig. 3a and Extended Data Fig. 2e). The bmβ7−/− Ldlr−/− mice had lower VLDL and IDL/LDL but similar HDL (Fig. 3b), gained weight similarly (Extended Data Fig. 2f), yet tended to excrete more cholesterol (Extended Data Fig. 2g). The bmβ7−/− Ldlr−/− mice had smaller aortic root lesions (Fig. 3c), with ~50% reduction in plaque size and volume (Fig. 3d, e), driven by differences in the size of the necrotic core (Extended Data Fig. 2h-j), and leukocyte number (Fig. 3f), the latter of which was independent of β7-mediated recruitment (Extended Data Fig. 3a,b). Since hypercholesterolemia provokes leukocytosis14, which is a cardiovascular risk factor15, we also enumerated leukocytes in the blood and found fewer circulating Ly-6Chigh and Ly-6Clow monocytes in bmβ7−/− Ldlr−/− mice after HCD (Fig. 3g), but not at steady state (Extended Data Fig. 3c). Similarly to experiments obtained in β7−/− mice, we noted improved glucose tolerance in the chimeras (Extended Data Figure 3d). We also generated β7−/− Ldlr−/− mice. Following assessment of metabolic functions, which were similar to those in β7−/− mice, we noted that β7−/− Ldlr−/− mice had lower plasma cholesterol, smaller lesions, and fewer aortic leukocytes after HCD (Extended Data Fig. 4a-d). Finally, we injected anti-β7 antibodies to Ldlr−/− mice and found improved glucose tolerance and attenuated atherosclerosis (Extended Data Fig. 4e-g). These data show that β7 deficiency protects against atherosclerosis.
Figure 3. Integrin β7 deficiency protects against atherosclerosis.
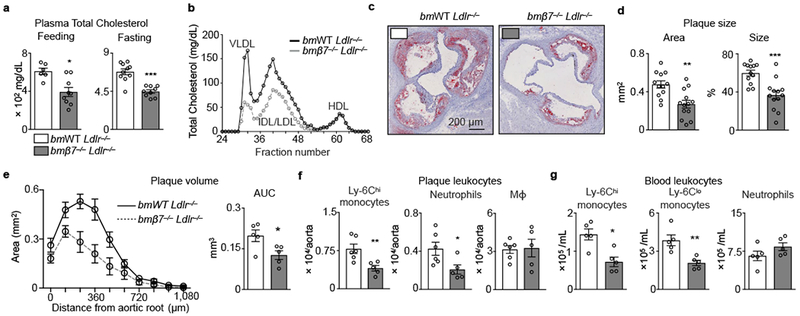
Ldlr−/− mice were lethally irradiated and reconstituted with bone marrow (BM) cells from either WT (bmWT Ldlr−/− ) or β7−/− (bmβ7−/− Ldlr−/−) mice. a, Plasma cholesterol in feeding and overnight-fasted animals consuming high-cholesterol diet (HCD) for 14 weeks (n = 6 bmWT Ldlr−/− , n = 9 bmβ7−/− Ldlr−/− mice while feeding; n = 10 bmWT Ldlr−/−, n = 9 bmβ7−/− Ldlr−/− mice while fasting). b, Plasma lipoprotein distribution measured by FPLC in bmWT Ldlr−/− and bmβ7−/− Ldlr−/− mice. Plasma from n = 5 mice per group was pooled. c, Representative images, and d, quantification of Oil-red O staining of aortic root sections from bmWT Ldlr−/− and bmβ7−/− Ldlr−/− mice consuming HCD for 14 weeks (n = 12 bmWT Ldlr−/− ; n = 13 bmβ7−/− Ldlr−/− mice). e, Plaque volume calculated by measuring plaque size at increasing distances from the aortic root (n = 5 mice per group).*P < 0.05, two-tailed unpaired Student’s t test. f, Leukocyte quantification in aortas, and g, blood of bmWT Ldlr−/− and bmβ7−/− Ldlr−/− mice consuming HCD for 14 weeks (n = 6 bmWT Ldlr−/− and 5 bmβ7−/− Ldlr−/− in f; 5 mice per group in g). Data presented as mean ± s.e.m, *P<0.05, **P < 0.01,***P < 0.001, Mann-Whitney two-tailed tests unless otherwise indicated.
Next, we sought to discover what cells account for our findings. Intra-epithelial lymphocytes residing in the small intestines had the highest β7 expression (Fig. 4a), in agreement with studies demonstrating that β7 guides leukocytes to the gut16,17. Although the intestinal intra-epithelium had fewer CD3+ cells in β7−/− mice (Extended Data Fig. 5a), we nevertheless enumerated β7+ cells’ relative propensity for entering tissues (Extended Data Fig. 5b). The blood contained β7−/− and WT cells at similar proportions (Fig. 4b) and, while many tissues accumulated β7−/− and WT cells in similar, if somewhat varied, proportions, precipitously fewer β7−/− cells accumulated in the gut, the small intestine intra-epithelium in particular (Fig. 4b and Extended Data Fig. 5b). These findings therefore confirm that β7 brings leukocytes to the gut.
Figure 4. Natural IELs calibrate metabolism and protect against cardiovascular disease via GLP-1.
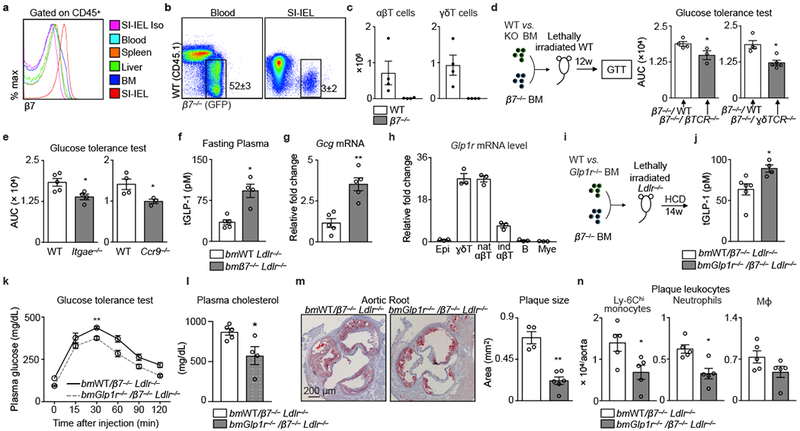
a, Histogram (of 4) showing β7 expression on leukocytes in WT mice. b, Flow dot plots showing leukocyte chimerism in blood and among small intestine intraepithelial leukocytes (SI-IEL). CD45.2+ mice were lethally irradiated and transplanted with a 1:1 ratio mixture of GFP+ β7−/− and CD45.1+ WT bone marrow. c, T cell quantification in SI in same mice as b (n = 4 recipient mice). d, WT mice were lethally irradiated and reconstituted with BM cell mixtures to generate mixed chimeric mice. Data show glucose tolerance tests and the AUC in β7−/− WT (n = 4 mice), β7−/− βTCR−/− (n = 3 mice), β7−/− γδTCR−/−(n = 5 mice). e, Glucose tolerance test (i.p.) in WT (n = 4 and 5 mice) and Itgae−/− (n = 4 mice) or Ccr9−/− mice (n = 3 mice). f, Fasting plasma total GLP-1 and g, Gcg mRNA in the ileum of bmWT Ldlr−/− (n = 5 mice) and bmβ7−/− Ldlr−/− (n = 4 and 5 mice) mice consuming HCD for 14 weeks. h, Glp1r in sorted IEL cells from WT mice (n = 3 mice). i, Experimental setup for generating mixed bone marrow chimeras. j, Fasting plasma total GLP-1 (n = 6 bmWT/β7−/− Ldlr−/− ; 4 bmGlpr1−/−/β7−/− Ldlr−/− mice). k, Glucose tolerance test (n = 5 mice). l, Plasma cholesterol (n = 5 bmWT/β7−/− Ldlr−/− ; 4 bmGlpr1−/−/β7−/− Ldlr−/− mice, mean ± s.e.m, *P < 0.05, two-tailed unpaired Student’s t test). m, Representative images and quantification of Oil-red O-stained aortic roots (n = 4 bmWT/β7−/− Ldlr−/− ; 6 bmGlpr1−/−/β7−/− Ldlr−/− mice). (n) Leukocyte quantification in aortas (n = 5 mice). For (k-n), mice consuming HCD. All data mean ± s.e.m, *P < 0.05, **P < 0.01, Mann-Whitney two-tailed tests unless otherwise indicated.
We identified the leukocytes relying on β7 influx to the gut as αβ and γδ T cells (Fig. 4c), B cells, and myeloid cells (Extended Data Fig. 5c), noting that β7−/− mice had similar leukocyte numbers to WT mice in metabolically important organs such as the liver and pancreas (Extended Data Fig. 5d, e). Although T cells were the most numerous β7-dependent assessed population in the gut, we nevertheless tested which of the three mediated the metabolic effects. We therefore generated five different mixed chimeric groups of mice (β7−/−/WT, β7−/−/βTCR−/−, β7−/−/γδTCR−/−, β7−/−/μMT, and β7−/−/Ccr2−/−) on a WT background and performed a glucose tolerance test to screen for the metabolic phenotype. We found that specific absence of β7 on either αβ (β7−/−/βTCR−/−) or γδ (β7−/−/γδTCR−/−) T cells improved glucose tolerance (Fig. 4d), with no changes in the other mixed chimeras (Extended Data Fig. 5f). Both Itgae−/− and Ccr9−/− mice18,19 showed similar improvement in glucose tolerance (Fig. 4e). Moreover, given the importance of B cells to gut homeostasis20,21, we analyzed this lymphocyte population’s contribution in more detail, but found no differences in glucose tolerance, cholesterolemia, or atherosclerosis (Extended Data Fig 6), indicating that β7-dependent B cells do not contribute to the metabolic phenotype. These data show that intraepithelial αβ and γδ T cells regulate systemic metabolism.
In response to dietary nutrients, enteroendocrine L-cells in the gut produce the incretin hormone GLP-1, which induces postprandial pancreatic insulin secretion and exerts glucose control22,23. GLP-1 mediates various other beneficial effects on metabolism, while its analogue improves cardiovascular outcomes in patients with diabetes24,25. We found that bmβ7−/− Ldlr−/− mice consuming HCD had elevated fasting GLP-1 in the plasma (Fig. 4f), along with elevated gut Gcg mRNA levels (Fig. 4g). Likewise, β7−/− mice also had elevated GLP-1 compared to WT mice on chow and on HFSSD (Extended Data Fig. 7a,b). To test whether αβ and γδ T cells controlled GLP-1 bioavailability, we measured expression of the GLP-1 receptor on gut leukocytes, and found that natural αβ and γδ T cells in WT mice expressed GLP-1R abundantly, consistent with Immgen (www.immgen.org) and a previous study26 (Fig. 4h). The guts of β7−/− mice, in contrast, were relatively GLP-1R deficient, containing fewer, predominantly Glp1rlow, T cells (Extended Data Fig. 5a and 7c,d). These results indicate that loss of Glp1rhigh natural IELs associates with increased plasma levels of the ligand (GLP-1), an observation that is consistent with previous identifications of elevated GLP-1 levels in whole body Glp1r−/− mice27.
To determine whether loss of GLP-1R on IELs protects against atherosclerosis via elevated systemic GLP-1R agonism, we generated mixed chimeras (bmGlp1r−/− /β7−/−) (Fig. 4i) on a Ldlr−/− background. After performing quality control experiments (Extended Data Fig. 7e and Extended Data Fig. 8a-e), we found that bmGlp1r−/− /β7−/− Ldlr−/− mice had elevated GLP-1 (Fig. 4j), were more glucose-tolerant (Fig. 4k), less hypercholesterolemic (Fig. 4l), and developed smaller atherosclerotic lesions (Fig. 4m), with fewer aortic leukocytes (Fig. 4n). Of note, no differences in glucose tolerance and GLP-1 levels were apparent between Glp1r−/− and WT chimeras on a WT (i.e., not Ldlr−/−) background, though we did see differences in the Glp1r−/− /β7−/− mixed chimeras (Extended Data Fig. 8f-i). We did, however, find attenuated atherosclerosis in Ldlr−/− mice receiving the GLP-1R agonist Exendin-4 (Extended Data Fig. 8j,k), consistent with data generated in Apoe−/− mice28,29.
Finally, we reasoned that Glp1rhigh IELs may be limiting GLP-1 bioavailability by several non-mutually exclusive mechanisms. First, we discovered that β7−/− mice have an increased number of GLP-1-producing L cells, suggesting that Glp1rhigh IELs may be controlling GLP-1 production (Extended Data Fig. 9a). Second, we confirmed that GLP-1R in Glp1rhigh IELs is functional, can bind to, capture (Extended Data Fig. 9b), and control GLP-1 bioavailability (Extended Data Fig. 9c-f). These results indicate that the loss of IEL GLP-1R triggers a systemic response and limits development of cardiovascular disease through regulation of GLP-1 availability (Extended Data Fig. 10).
In the gut, T cells help maintain barrier integrity by various pleiotropic functions. Here, we identified β7+ IEL as critical gatekeepers of dietary metabolism. Although the evolution of regulatory mechanisms that sense nutrient availability and regulate energy disposal and storage should offer a survival advantage over organisms that indiscriminately metabolize and expend their ingested energy, such mechanisms may backfire if they become too dominant. Future studies will therefore need to investigate IEL function in numerous contexts to determine whether specific targeting of this population or its products can mitigate cardio-metabolic disease.
Methods
Animals.
C57BL/6J (wild type, WT), Itgb7tm1Cgn (β7−/−), Ldlrtm1Her (Ldlr−/−), Tcrbtm1Mom (βTCR−/−), Tcrdtm1Mom (ɣδTCR−/−), Ccr2tm1Ifc (Ccr2−/−), Ighmtm1Cgn (μMt), Ccr9tm1Lov (Ccr9−/−), Itgaetm1Cmp (itgae−/−) mice were purchased from The Jackson Laboratory (Bar Harbor, ME, USA). Glp1r−/− mice on the C57BL/6 background were bred in-house as described30. Unless otherwise indicated age- and sex-matched animals were used starting at 8–12 weeks of age. Female mice were used for experiments in Fig. 1 h, k, l, Fig. 4e, Extended data Fig. 1g, 4c, d. A mix of sexes was used in Fig. 1j. Male mice were used in all other experiments. Investigators were blinded to group allocation during data collection and analysis. Where appropriate, animals were randomly assigned to interventions. All protocols were approved by the Animal Review Committee at Massachusetts General Hospital (Protocol No. 2011N000035 and 2015N000044) and were in compliance with relevant ethical regulations.
Animal models and in vivo interventions.
Diet: For studies on metabolic syndrome, WT mice and β7−/− mice were fed a high-fat, high-sugar, high sodium diet (HFSSD, Research Diets D12331). For studies on atherosclerosis, bone marrow chimeras on Ldlr−/− background or double knockouts were fed a high-cholesterol diet (HCD, Research Diets D12108C). HFSSD and HCD mice were single- or group-housed on a 12:12-h light-dark cycle at 22°C with free access to food and water. HFSSD mice were maintained under these conditions for 21 weeks and HCD mice were fed for 14 weeks. For studies on glucose tolerance in thermoneutrality, WT mice and β7−/− mice were housed for 3 days on a 12:12-h light-dark cycle at 30°C with free access to food and water. For studies on microbiota, mice were treated with an antibiotics cocktail (0.1% Ampicillin, 0.1% Metronidazole, 0.05% Vancomycin and 0.1% Neomycin) in drinking water for 4 weeks and equal number of 8-week old WT mice and β7−/− mice with the same day of birth were co-housed for 4 weeks. Bone marrow transplantation: Naive C57BL/6 or Ldlr−/− mice were lethally irradiated (950cGy) and reconstituted with indicated BM cells to generate different chimera groups: (i) bmWT Ldlr−/− and bmβ7−/− Ldlr−/− (irradiated Ldlr−/− mice reconstituted with either WT or β7−/− BM), (ii) bmWT/β7−/− Ldlr−/− (irradiated Ldlr−/− mice reconstituted with 1:1 BM mixture of CD45.1+WT and GFP+β7−/− BM), (iii) bmWT/β7−/− (irradiated WT mice reconstituted with 1:1 BM mixture of CD45.1+WT and GFP+β7−/− BM), (iv) β7−/−/ WT, β7−/−/ βTCR−/− and β7−/−/ ɣδTCR−/− (irradiated WT mice reconstituted with 1:1 BM mixture of β7−/− and WT, β7−/−and βTCR−/−, β7−/−and ɣδTCR−/−, respectively), (v) WT/β7−/− Ldlr−/− and Glp1r−/− /β7−/− Ldlr−/− (irradiated Ldlr−/− mice reconstituted with 1:1 BM mixture of WT and β7−/−, Glp1r−/− and β7−/−, respectively), (vi) bmWT and bmGlp1r−/− (irradiated WT mice reconstituted with either WT or Glp1r−/− BM) and (vii) bmWT/ GFP+ and bmGlp1r−/− / GFP+ (irradiated WT mice reconstituted with 1:1 BM mixture of WT and GFP+, Glp1r−/− and GFP+, respectively). Anti-β7 antibody treatment: Ldlr−/− mice on HCD were treated with anti-β7 antibodies (Clone FIB504, BioxCell) or IgG isotype control (Clone 2A3, BioxCell) i.p. for 14 weeks for quantification of atherosclerotic plaque size after sacrifice (500 μg/mouse/week). Glp1r agonist treatment: Ldlr−/− mice were treated with the Glp1r agonist Exendin-4 (Abcam) in a dose of 100 μg/kg/day via osmotic mini pumps (Alzet). After 8 weeks on HCD mice were sacrificed for atherosclerotic lesion quantification.
Metabolic measurements.
CLAMS: The Comprehensive Lab Animal Monitoring System (CLAMS, The Columbus Instruments, OH) was used to simultaneously measure a series of metabolic parameters including energy expenditure (heat production), oxygen consumption (VO2), carbon dioxide production (VCO2), respiratory exchange ratio (RER), food consumption, and locomotor activity levels. Blood pressure measurements: Systolic and diastolic blood pressure were measured using a non-invasive tail-cuff system (Kent Scientific, CT). Mice were initially acclimated to the instrument for 3 consecutive days prior to the measurements. [18F]-FDG-PET/CT: The uptake and distribution of glucose in vivo were determined by using positron-emitting 18F-fluorodeoxyglucose ([18F]-FDG) and non-invasive, high-resolution positron emission tomography/computed tomography (PET/CT) imaging and ex vivo biodistribution. Briefly, mice were anesthetized with isoflurane and injected intravenously via the tail vein with ~200 μCi of tracer diluted to a final volume of 150μL in isotonic saline. Following a 60 min uptake period, mice were imaged on a Siemens Inveon small-animal integrated PET/CT scanner. The CT was acquired over 360 projections utilizing a 80 kVp 500 μA x-ray tube on a CMOS detector and reconstructed using a modified Feldkamp cone beam reconstruction algorithm (COBRA, Exxim Computing Corporation, Pleasanton, CA). A 20 min PET image was acquired and reconstructed using the ordered subsets expectation maximization followed by maximum a posteriori. Regions of interest were manually drawn for standard uptake value calculations. After imaging, animals were sacrificed and tissues were collected for biodistribution analysis using gamma well counting on a 20% window on the 511 keV photopeak (Wizard2, PerkinElmer, Waltham, MA). [18F]-FDG levels were normalized to the weight of resected tissue and expressed as the percent injected dose per gram tissue weight (%ID/g). Glucose/insulin test: For glucose and insulin tolerance tests, overnight-fasted mice were injected i.p. or by oral gavage with glucose (2 g/kg body weight), or injected i.p. with insulin (0.75 U/kg body weight) . Blood glucose levels were measured at the basal level and at 15, 30, 60, 90 and 120 minutes after glucose or insulin administration using One Touch Ultra2 Blood Glucose Meter (OneTouch, LifeScan, PA). Fat tolerance test: Overnight fasted mice were injected i.p. with 200ul 20% Intralipid (vol/vol) fat emulsion (Sigma, MA), and blood that was drawn from the retroorbital plexus at the indicated time points for triglyceride (TG) measurement using L-Type Triglyceride M kit (Wako Diagnostics, VA). To measure hepatic lipid export, overnight-fasted mice were injected with 1 g/kg poloxamer 407 (Pluronic F-127, Sigma) and plasma was collected at the indicated time points for TG analysis. Fat absorption test: To measure fat absorption in the gut, overnight-fasted mice were injected i.p. with 1 g/kg poloxamer (P407). After 1 min the mice were gavaged with 0.4 mL corn oil. Plasma was collected at the baseline as well as at the indicated time points after gavage for TG level detection. FPLC: Mice were fasted for 12–16 h overnight before blood samples were collected by retro-orbital venous plexus puncture, and plasma was separated by centrifugation. The lipid distribution in plasma lipoprotein fractions were assessed by fast performed liquid chromatography (FPLC) gel filtration with 2 Superose 6 HR 10/30 columns (Pharmacia Biotech, Uppsala, Sweden). Total plasma cholesterol in each fraction was enzymatically measured (Wako Pure Chemicals Tokyo, Japan). Cholesterol: Plasma was collected from overnight-fasted mice or non-fasted mice that were fed on HCD for 14 weeks, and plasma total cholesterol was determined by a Cholesterol E kit (Wako Diagnostics, VA). Gut permeability test: Overnight-fasted mice were administered through oral gavage with Fluorescein isothiocyanate–dextran (Sigma) at a dose of 12mg/mouse, and plasma was collected 4 hours later for fluorescent intensity measurement. Mouse of a classical colitis model that was treated with Dextran sulfate sodium salt (36,000-50,000 M.Wt., MP Biomedicals) in drinking water for 6 days was used as a positive control for gut barrier disruption.
Cells.
Cell collection: Peripheral blood was collected by retro-orbital bleeding and red blood cells were lysed in RBC lysis buffer (Biolegend, San Diego, CA). Aortas were excised after PBS (Thermo Fisher Scientific, MA) perfusion, minced and digested with 450 U/ml collagenase I, 125 U/ml collagenase XI, 60 U/ml DNase I and 60 U/ml hyaluronidase (Sigma-Aldrich, St. Louis, MO) in PBS for 40 minutes at 37℃. Total viable cell numbers were counted using trypan blue (Cellgro, Mediatech, Inc. VA). Small intestine intraepithelial leukocytes (IEL) were isolated as follows: after excision of the small intestine, the Peyer’s patches were removed under microscope and the gut was cut open longitudinally to wash off the lumen contents in HBSS buffer. The gut was then cut into 1-2 cm pieces and subjected to 3 × dissociation in EDTA-containing buffer (7.5 mM HEPES, 2% FCS, 2 mM EDTA, 10.000 U/mL Penicillin-Streptomycin, 50 µg/mL Gentamycin in HBSS; all Thermo Fisher Scientific, MA) in a shaker at 37℃ for 15 minutes. After dissociation the IELs were collected by filtering lamina propria through a mesh. Cell sorting: The IEL flow-through after dissociation was further subjected to Percoll (GE Healthcare Bio-Sciences, MA) grade centrifugation to remove the mucus. Single cell suspension of IELs from indicated animals were then stained to identify indicated cell populations. Cells were sorted on a FACS Aria II cell sorter (BD Biosciences) directly into either RLT buffer for subsequent RNA isolation or collecting medium. Flow Cytometry: Single cell suspensions were stained in PBS supplemented with sterile 2% FBS and 0.5% BSA. The following monoclonal antibodies were used for flow cytometric analysis: anti-integrin β7 (clone FIB27), anti-CD45 (30-F11), anti-CD45.1 (clone A20), anti-CD45.2 (clone 104), anti-CD3 (clone 17A2), anti-CD90.2 (clone 53-2.1), anti-CD19 (clone 6D5), anti-B220 (clone RA3-6B2), anti-NK1.1 (clone PK136), anti-Ly-6G (clone 1A8), anti-Ly-6C (AL-21), anti-MHCII (clone AF6-120.1), anti-F4/80 (clone BM8) anti- CD11b (clone M1/70), anti-CD5 (clone 53-7.3), anti-βTCR (clone H57-597), anti-γ/δTCR (clone GL3), anti-CD326 (clone G8.8), anti- IgA (C10-3), anti- IgD (11-26c.2a), anti-CD115 (clone AFS98), anti-CX3CR1 (clone SA011F11). Antibodies were all purchased from BioLegend except anti-IgA (BD Biosciences). Viable cells were identified as unstained with Zombie Aqua (Biolegend). Cells were defined as: (i) Ly-6Chigh monocytes (CD45+Lin−CD11b+F4/80−Ly-6Chigh), (ii) neutrophils (CD45+CD11b+Lin+F4/80−), (iii) macrophages (CD45+Lin−CD11b+F4/80+Ly-6Clow), (iv) epithelial cells (CD45-CD326+CD3−), (v) myeloid cells (CD45+CD3−CD11b+), Lineages were defined as: Lin: CD3, CD90.2, CD19, B220, NK1.1, Ter119, Ly6G. Data were acquired on a LSRII (BD Biosciences, NJ) and analyzed with FlowJo (Tree Star, Ashland, OR, USA). Cell culture: In all different approaches cells / ex vivo ileum tissues were kept in a humidified 5% CO2 incubator at 37℃. (i) For in vitro GLP-1R agonist binding experiments small intestinal IELs were isolated and incubated with 50 pM fluorescence-labelled GLP-R agonist Exendin-4 Cys40SeTau647 for 1h, and IEL subsets were gated as follows: natural - Glp1rhigh - IELs (CD45+CD3+CD90.2−CD5−), induced - Glp1rlow - IELs (CD45+CD3+CD90.2+CD5+), non-T cells (CD45+CD3−) and epithelial cells (CD45-CD326+CD3-), the binding capacity was analyzed for Exendin-4 Cys40SeTau647 by flow cytometry. (ii) For in vitro co-culture experiments GLP-1 producing L-cells (GLUTag cells that were kindly provided by Daniel J. Drucker, authenticated multiple times, and tested for mycoplasma) were co-cultured together with sorted Glp1rhigh or Glp1rlow IELs in DMEM + GlutaMAX-I with glucose 1 g/L (Invitrogen) supplemented with 10% FBS and 1% penicillin/streptomycin (103 GLUTag cells + 105 IELs in a 96 well plate in 200 μL medium per well). After 24h supernatant GLP-1 concentrations were measured by using a total GLP-1 ELISA Kit (Millipore). In some experiments the GLP-1R agonist Exendin-4 (Abcam) was added to co-culture wells (100 nM). (iii) In the case of 2 step ex vivo experiments sorted Glp1rhigh IELs were incubated with Exendin-4 (100 nM) or control. After 24h samples were centrifuged (300 g, 5 min.) and supernatants were transferred to ileum ex vivo sections of previously sacrificed WT mice. GLP-1 levels were determined 24h later from ex vivo supernatants. (iv) In an ex vivo GLP-1R inhibition approach whole ileum preparations of WT or β7−/− mice were treated with the GLP-1R antagonist Exendin-9 (100 nM) or control. After 24h supernatant GLP-1 concentrations were measured by using a total GLP-1 ELISA Kit (Millipore).
Molecular Biology.
PCR: Total RNA was isolated using the RNeasy Mini Kit (Qiagen, Venlo, Netherlands) according to the manufacturer’s instructions. cDNA was generated from 1 μg of total RNA per sample using High Capacity cDNA Reverse Transcription Kit (Applied Biosystems, Foster City, CA). Quantitative real-time TaqMan PCR was performed using the following TaqMan primers (Applied Biosystems): Glp1r (Mm00445292_m1), Gcg (Mm00801714_m1) and housekeeping gene Actin (Mm02619580_g1). PCR was run on a 7500 thermal cycler (Applied Biosystems) and data were quantified with the 2-ΔCt method. ELISA: Total GLP-1 levels were measured in plasma of overnight-fasted mice or during oral glucose tolerance tests by using a commercial ELISA kit (Millipore, MA.) according to the manufacturer’s instructions. Gut IgA was retrieved by flushing the lumens of dissected guts with 5mL PBS, and both gut flush IgA and plasma IgA was detected using mouse IgA ELISA kit (Bethyl Laboratories, TX).
Histology.
Adipose tissue: Inguinal white adipose tissue (iWAT) and perigonadal white adipose tissue (pWAT) were excised, fixed in 10% formalin solution and paraffin-embedded. H&E staining was performed to assess overall tissue morphology. The adipocyte size distribution was determined with the NIH ImageJ program. Aortas: Aortic roots were dissected, embedded in Tissue-Tek O.C.T. compound (Sakura Finetek, Torrance, CA), and frozen in 2-Methylbutane (Fisher Scientific, Fair Lawn, NJ) cooled with dry ice. For comparisons of lesion size between the groups, sections with the maximum lesion area were used. To measure lesion volume, sections were collected at the first appearance of the aortic valves until lesions were no longer visible. Oil Red O staining (Sigma-Aldrich, St. Louis, MO) was performed to visualize lipid content and the lesion size was measured. To quantify lesion macrophage and smooth muscle cell content, immunohistochemical staining was performed with CD68 (BioLegend, San Diego, CA) and Myh11 (Millipore, Burlington, MA) antibodies. The positive cells were visualized using VECTASTAIN ABC kit (Vector Laboratories, Inc., Burlingame, CA) and AEC substrate (DAKO/Agilent technologies, Inc., Santa Clara, CA), and the slides were counterstained with Harris Hematoxylin (Sigma-Aldrich). To quantify collagen content, Masson Trichrome staining (Sigma-Adrich) was performed. lleum CD3 cell numbers: Small intestines were dissected and cut open. After rinsing away the lumen contents in PBS, ileum was rolled from proximal to distal parts and embedded for histological sectioning. Immunohistochemical staining was performed using a CD3 antibody (BioLegend) and CD3 positive cells were quantified. lleum L-cell numbers: lleum sections of WT and β7−/− mice were paraffin-embedded and GLP-1 staining (Abcam) was performed to quantify GLP-1 producing L-cells in the entire ileum of each mouse. A biotinylated secondary antibody and streptavidin DyLight 594 (Vector Laboratories, Inc.) were applied and nuclei were identified using DAPI (Thermo Fisher Scientific, Waltham, MA). All histological slide were scanned using a digital slide scanner NanoZoomer 2.0RS (Hamamatsu, Japan).
Statistics.
Results are shown as mean ± SEM. Unless indicated, statistical tests included unpaired, 2-tailed Student’s t-tests and nonparametric Mann-Whitney U tests (when Gaussian distribution was not assumed). For multiple comparisons test, nonparametric multiple comparisons test comparing mean rank of each group (when Gaussian distribution was not assumed) was performed. P values of 0.05 or less were considered to denote significance.
Extended Data
Extended Data Figure 1. Effects of integrin β7 deficiency on metabolism.

a, Metabolic cage measurements of activity (n = 4 mice per group, mean ± s.e.m), b, O2 consumption and CO2 production (n = 5 for WT and n = 4 for β7−/− mice, mean ± s.e.m) and c, respiratory exchange rate (RER) by CLAMS in WT and β7−/− mice on chow (n = 5 for WT and n = 4 for β7−/− mice, mean ± s.e.m, *P < 0.05, Mann-Whitney two-tailed test). d, Overnight fasted WT and β7−/− mice were administered with [18F]-FDG. The radioactivity in indicated organs was measured (n = 6 for WT and n = 5 for β7−/− mice, mean ± s.e.m, *P < 0.05, multiple t test). e, WT and β7−/− mice were housed in thermoneutral (TN) incubators for 3 days and then subjected to the glucose tolerance test. (n = 5 mice per group, mean ± s.e.m, **P < 0.01, Mann-Whitney two-tailed test). f, WT and β7−/− mice were treated with antibiotic cocktails in the drinking water for 4 weeks and then subjected to the glucose tolerance test. (n = 4 per group, mean ± s.e.m, *P < 0.05, Mann-Whitney two-tailed test). g, 8-week old WT and β7−/− mice were co-housed at a ratio of 1:1 for 4 weeks and then subjected to the glucose tolerance test. (n = 7 mice per group, mean ± s.e.m, *P < 0.05, Mann-Whitney two-tailed test). h, Fat absorption was performed by doing the fat tolerance test in the presence of P407 (n = 9 for WT and n = 6 for β7−/− mice, mean ± s.e.m). i, For assessment of permeability, mice were gavaged with FITC-dextran and fluorescence was measured in the plasma 4 h later. A WT mouse subjected to a colitis model (DSS) was used as a positive control for increased gut permeability. (n = 8 for WT and n = 7 for β7−/− mice, mean ± s.e.m, P = 0.17, Mann-Whitney two-tailed test).
Extended Data Figure 2. Effects of integrin β7 deficiency on obesity, cholesterolemia and atherosclerosis.
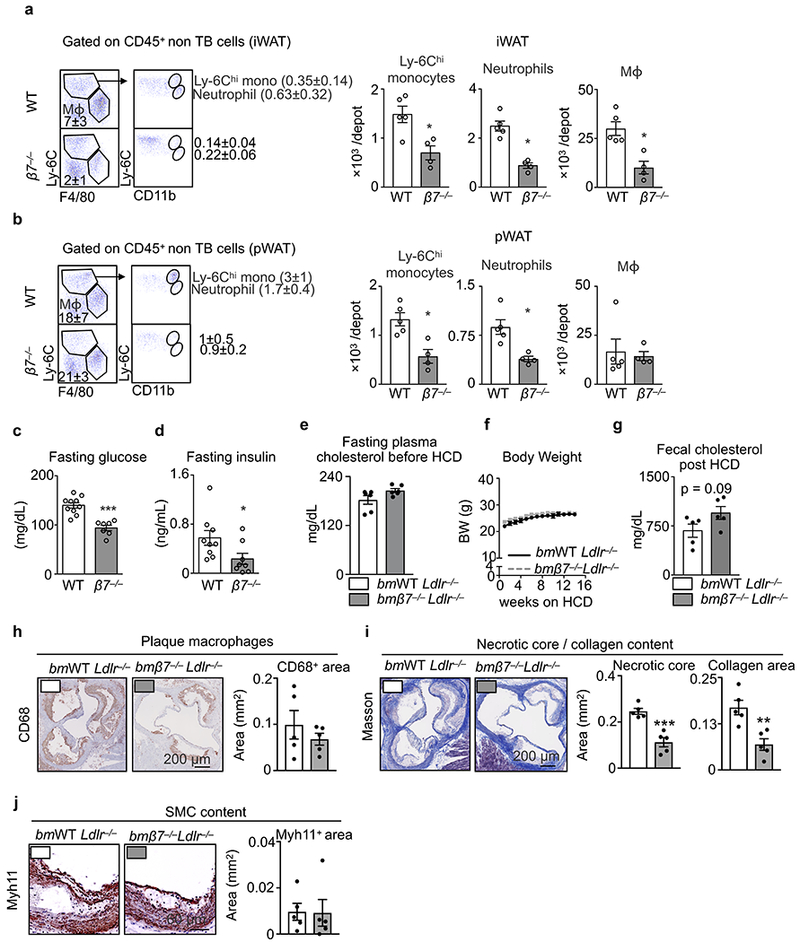
a, Representative flow dot plots and quantification of Ly-6Chi monocytes, neutrophils and macrophages in iWAT of WT and β7−/− mice on HFSSD for 5 months (n = 5 for WT and n = 4 for β7−/− mice, mean ± s.e.m, *P < 0.05, Mann-Whitney two-tailed test). b, Representative flow dot plots and quantification of Ly-6Chi monocytes, neutrophils and macrophages in pWAT of WT and β7−/− mice on HFSSD for 5 months (n = 5 for WT and n = 4 for β7−/− mice, mean ± s.e.m, *P < 0.05, Mann-Whitney two-tailed test). c, Plasma glucose (n = 10 for WT and n = 7 for β7−/− mice, mean ± s.e.m, ***P < 0.001, Mann-Whitney two-tailed test), and d, insulin levels (n = 9 for WT and n = 8 for β7−/− mice, mean ± s.e.m, *P < 0.05, Mann-Whitney two-tailed test) measured in overnight fasted animals on HFSSD for 5 months. e, Fasting plasma total cholesterol levels on chow diet (n = 6 mice per group, mean ± s.e.m) and f, body weight changes during 14-week HCD diet of bmWT Ldlr−/− vs. bmβ7−/−Ldlr−/− mice (n = 5 mice per group, mean ± s.e.m). g, Fecal cholesterol levels in bmWT Ldlr−/− vs. bmβ7−/−Ldlr−/− mice after 14-week HCD diet (n = 5 mice per group, mean ± s.e.m, P = 0.09, two-tailed unpaired Student’s t-test). h, Representative images and histological quantification of macrophage, i, collagen content/ necrotic core and, j, smooth muscle cell content of bmWT Ldlr−/− vs. bmβ7−/−Ldlr−/− mice after 14 weeks on HCD (n = 5 mice per group, mean ± s.e.m).**P < 0.01, ***P < 0.001. P values from two-tailed unpaired Student’s t-test.
Extended Data Figure 3. Effects of integrin β7 deficiency on myeloid cells and glucose tolerance.

a, Ldlr−/− mice were lethally irradiated and reconstituted with bone marrow mixtures of WT and β7−/− mice (1:1) and fed on chow or high-cholesterol diet (HCD) for 14 weeks. b, The aortic leukocytes from different origins were enumerated by flow cytometry (n = 4 mice for both HCD recipients and chow recipients, mean ± s.e.m). c, Ly-6Chi and Ly-6Clo monocyte numbers in blood (n = 3 for WT and n = 5 for β7−/− mice, mean ± s.e.m), bone marrow (n = 3 for WT and n = 5 for β7−/− mice, mean ± s.e.m) and spleen (n = 6 mice per group, mean ± s.e.m) of WT vs. β7−/− mice on chow diet. d, bmWT Ldlr−/− vs. bmβ7−/−Ldlr−/− mice on HCD were subjected to an intraperitoneal (IP) glucose tolerance test (n = 5 mice per group, mean ± s.e.m). *P < 0.05, Mann-Whitney two-tailed test.
Extended Data Figure 4. Effects of genetic deficiency and blocking of integrin β7 on atherosclerosis.

a, Body weights, cumulative food intake, and energy expenditure were measured in Ldlr−/− mice and β7−/− Ldlr−/− mice (n = 4 mice per group, mean ± s.e.m). b, Ldlr−/− mice and β7−/− Ldlr−/− mice were fed HCD for 14 weeks. Plasma cholesterol levels were determined in overnight fasted mice (n = 7 for Ldlr−/− and n = 5 for β7−/− Ldlr−/− mice, mean ± s.e.m, **P < 0.01, Mann-Whitney two-tailed test). c, Representative Oil-red O staining images and quantification of plaque size in the aortic roots (n = 7 for Ldlr−/− and n = 5 for β7−/− Ldlr−/− mice, mean ± s.e.m, *P < 0.05, Mann-Whitney two-tailed test). d, Quantification of Ly-6Chi monocytes, neutrophils, and macrophages in plaques (n = 7 mice per group). e, Ldlr−/− mice on HCD were treated with anti-β7 antibodies or IgG isotype control (500 μg/mouse/week) for 14 weeks. Mice were subjected to glucose tolerance test (i.p.) after 8 weeks on HCD (n = 6 mice per group, mean ± s.e.m, **P < 0.01, Mann-Whitney two-tailed test). f, Representative images of Oil-red O stained aortic cross sections and quantification of plaque size in the aortic roots after 14 weeks on HCD (n = 5 for IgG and n = 6 for anti-β7 mice, mean ± s.e.m), *P < 0.05, **P < 0.01, Mann-Whitney two-tailed test.
Extended Data Figure 5. Integrin β7 guides leukocytes to gut intraepithelium.
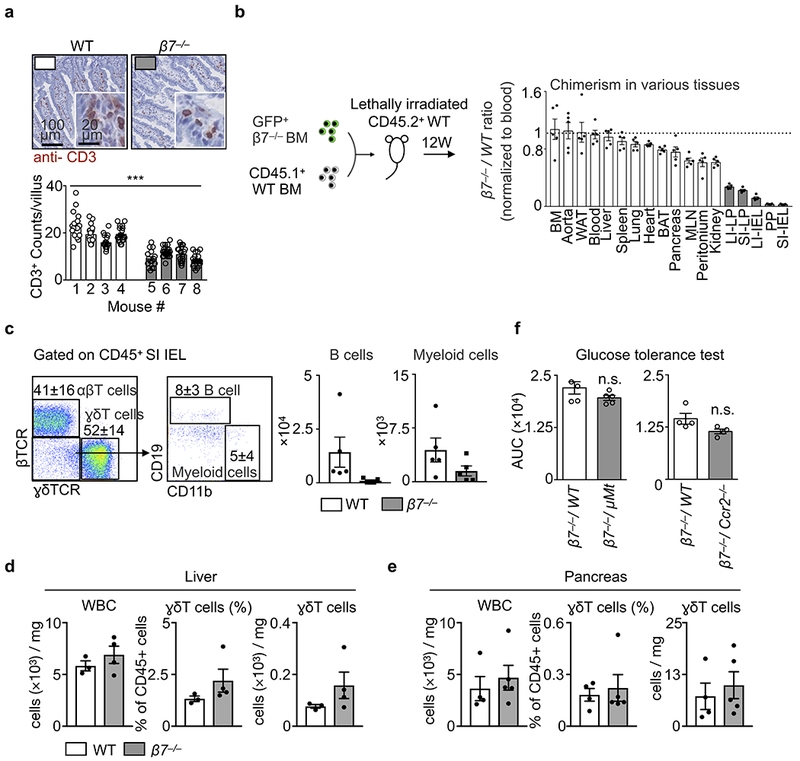
a, Representative histology staining for CD3 in small intestines of WT mice and β7−/− mice. Bottom panel shows the quantification of CD3+ cells in each villus (over 15 villi were counted for each mouse), ***P < 0.001, two-way ANOVA. b, The scheme of the competitive transfer: Mice (CD45.2+) were lethally irradiated and transplanted with 1:1 ratio mix of GFP+/+β7−/− bone marrows and CD45.1+WT bone marrows. The chimerism in different tissues was normalized by comparing the ratio in blood (n = 5 mice, mean ± s.e.m). c, Representative flow dot plots and quantification of B cells and myeloid cells in mice depicted in (b) (n = 5 biologically independent recipients, mean ± s.e.m). d, Quantification of ɣδT cells from the liver (n = 3 WT vs. 4 β7−/− mice, mean ± s.e.m) and e, pancreas (n = 4 WT vs. 5 β7−/− mice, mean ± s.e.m). f, WT mice were lethally irradiated and reconstituted with BM cell mixtures of β7−/− and WT (β7−/−/ WT, 1:1 ratio) or β7−/− and indicated KOs (β7−/−/ KO, 1:1 ratio). The indicated mixed chimeras that specifically lack intestinal B cell (β7−/−/ μMt) or myeloid cells (β7−/−/ Ccr2−/−) were subjected to oral glucose tolerance tests and the AUCs are shown. (n = 5 per group for β7−/−/ WT vs β7−/−/ μMt, and n = 4 per group for β7−/−/ WT vs β7−/−/ Ccr2−/− mice).
Extended Data Figure 6. B cells are dispensable for the altered metabolic phenotypes in integrin β7 deficient mice.
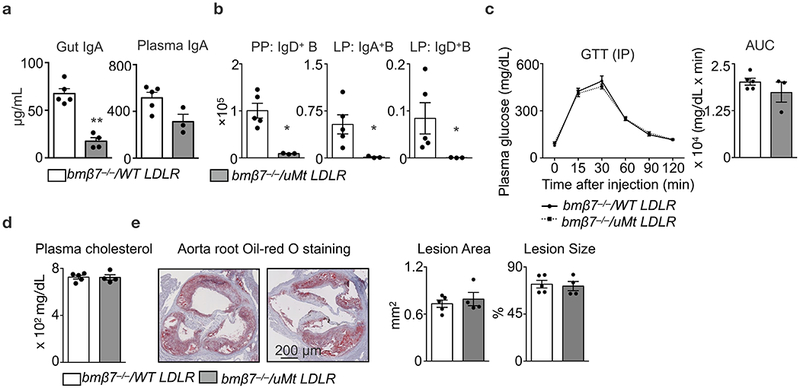
Ldlr−/− mice were lethally irradiated and reconstituted with BM cell mixtures of β7−/− and WT (β7−/−/ WT, 1:1 ratio), or, β7−/− and μMt (β7−/−/μMt, 1:1 ratio). The reconstituted mixed chimeras were fed on high-cholesterol diet (HCD) for 14 weeks. a, IgA levels in the gut flush (n = 5 for β7−/−/ WT vs n = 4 β7−/−/ μMt mice, mean ± s.e.m) and the plasma (n = 5 for β7−/−/ WT vs n = 3 β7−/−/ μMt mice, mean ± s.e.m), **P < 0.01, Mann-Whitney two-tailed test. b, Number of IgD+ B cells in Peyer’s patches and IgA+ B cells and IgD+ B cells in lamina propria as determined by flow cytometry (n = 5 for β7−/−/ WT vs n = 3 β7−/−/ μMt mice, mean ± s.e.m), *P < 0.05, Mann-Whitney two-tailed test. c, Glucose tolerance test in HCD-fed mixed chimeras (n = 5 for β7−/−/ WT vs n = 3 β7−/−/ μMt mice, mean ± s.e.m). d, Plasma cholesterol levels in overnight-fasted mice (n = 5 for β7−/−/ WT vs n = 4 β7−/−/ μMt mice, mean ± s.e.m). e, Representative images and quantification of Oil-red O staining in aorta root sections of bmβ7−/−/ WT Ldlr−/− and bmβ7−/−/ μMt Ldlr−/− mice on HCD for 14 weeks (n = 5 for β7−/−/ WT vs n = 4 β7−/−/ μMt mice, mean ± s.e.m).
Extended Data Figure 7. Integrin β7 deficiency and GLP-1.

a, Plasma total GLP-1 levels after overnight fasting and 15 minutes following oral glucose load (2 g/kg body weight) in WT and β7−/− mice on chow (Total GLP-1 fasting: n = 7 mice per group, mean ± s.e.m; Total GLP-1 OGTT 15 min: 7 WT vs. 6 β7−/− mice, mean ± s.e.m) and b, after 5 months of high-fat, high-sugar and high-sodium diet (HFSSD) (Total GLP-1 fasting: n = 7 mice per group, mean ± s.e.m; Total GLP-1 OGTT 15 min: 6 mice per group, mean ± s.e.m. c, Representative flow cytometry dot-blots of small intestinal IELs from WT and β7−/− mice. d, Glp1r mRNA levels in sorted different IEL subsets from WT and β7−/− mice (n = 4 WT vs n = 5 β7−/− mice, mean ± s.e.m). e, WT mice were lethally irradiated and transplanted with 1:1 BM mixture of WT and GFP+, Glp1r−/− and GFP+, respectively. The chimerism in different tissues was analyzed by comparing the percentage of GFP+ leukocytes normalized to WT/GFP+ blood leukocytes (n = 4 mice per group, mean ± s.e.m). *P < 0.05, ***P < 0.001. All P values from two-tailed unpaired Student’s t-test.
Extended Data Figure 8. Effects of Glp1r deficiency on IELs and atherosclerosis.

a, Quantification of small intestinal IEL subpopulations in bmWT/ β7−/− Ldlr−/− and bmGlp1r−/− /β7−/− Ldlr−/− mice (n = 5 mice per group, mean ± s.e.m). b, Glp1r mRNA expression from sorted IEL subpopulations from biologically independent 4 bmWT/ β7−/− and 5 bmGlp1r−/− /β7−/− mice (mean ± s.e.m, two-tailed unpaired Student’s t-test). c, Glp1r mRNA expression of liver (from 5 bmWT/ β7−/− and 4 bmGlp1r−/− /β7−/− mice) and heart and lung tissue (n = 5 mice per group, mean ± s.e.m). d, Quantification of ɣδT cells from the liver (n = 5 mice per group, mean ± s.e.m) and pancreas of 5 bmWT/ β7−/− Ldlr−/− and 4 bmGlp1r−/− /β7−/− Ldlr−/− mice (mean ± s.e.m). e, Glp1r mRNA expression of sorted ɣδT cells from pancreas, liver and small intestinal IELs (n = 3 mice per group, mean ± s.e.m, two-tailed unpaired Student’s t-test). f, Oral glucose tolerance test in 4 bmWT and 3 bmGlp1r−/− mice (mean ± s.e.m) g, GLP-1 levels after overnight fasting (n = 4 mice per group, mean ± s.e.m) or oral glucose challenge 4 bmWT and 3 bmGlp1r−/− mice (mean ± s.e.m). h, Oral glucose tolerance test in bmWT/ β7−/− and bmGlp1r−/−/β7−/− mice (n = 5 mice per group, mean ± s.e.m, two-tailed Mann-Whitney test). i, GLP-1 levels after overnight fasting or oral glucose challenge in bmWT/ β7−/− and bmGlp1r−/−/β7−/− mice (n = 5 mice per group, mean ± s.e.m, two-tailed unpaired Student’s t-test). j, Ldlr−/− mice were treated with GLP-1R agonist Exendin-4 (Ex-4) at a dose of 100 μg/kg/day via osmotic mini pumps (PBS as control). After 8 weeks on HCD mice were sacrificed for atherosclerotic lesion quantification. Representative images of Oil-red O stained aortas and quantification of plaque size. k, Quantification of blood Ly-6Chi monocytes, Ly-6Clo monocytes and neutrophils (n = 8 Ldlr−/− mice treated with Ex-4 vs. 6 Ldlr−/− mice with PBS as control, mean ± s.e.m, two-tailed unpaired Student’s t-test). *P < 0.05, **P < 0.01, ***P < 0.001.
Extended Data Figure 9. Gut intraepithelial Glp1rhigh IELs regulate GLP-1 bioavailability.
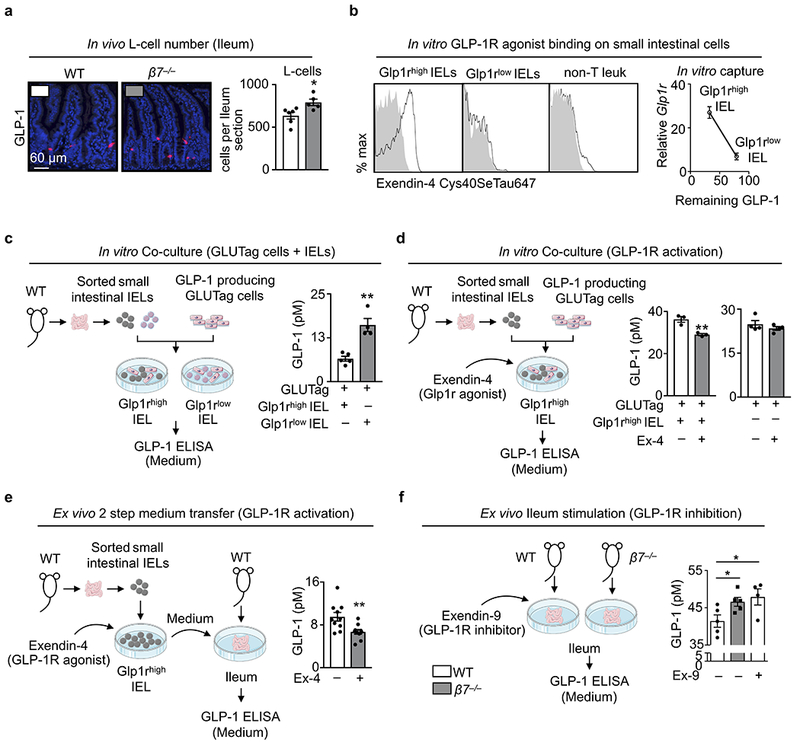
a, Immunohistochemical staining for GLP-1-producing L-cells in whole ileum preparations of 6 WT and 5 β7−/− mice (mean ± s.e.m). b, Small intestinal IEL mixtures were incubated with fluorescence (Cys40SeTau647)-labelled GLP1-R agonist Exendin-4 and the capacity of agonist binding by the different subsets: natural IELs (Glp1rhigh), induced IELs (Glp1rlow), and non-T cells were analyzed by flow cytometry. Sorted Glp1rhigh and Glp1rlow were also incubated with recombinant GLP-1 and the remaining supernatant GLP-1 were plotted against their relative Glp1r mRNA levels. c, GLP-1-producing GLUTag cells were co-cultured with sorted natural (Glp1rhigh) or induced (Glp1rlow) IELs. After 24h supernatant GLP-1 concentrations were measured (n = 5 biologically independent samples for Glp1rhigh IELs and 4 biologically independent samples for Glp1rlow IELs, mean ± s.e.m). d, Left: GLUTag cells were co-cultured with sorted Glp1rhigh IELs in the presence of Exendin-4 (100 nM) or control (n = 3 independent biologically samples per group, mean ± s.e.m). Right: GLUTag cells were stimulated with Exendin-4 (100 nM) or control (n = 4 independent biological samples per group, mean ± s.e.m). After 24h supernatant GLP-1 levels were measured. e, Sorted Glp1rhigh IELs were incubated with Exendin-4 (100 nM) or control. After 24h samples were centrifuged and supernatants were transfered to ex vivo ileum fractions of WT mice. GLP-1 levels were determined 24h later from ex vivo supernatants (n = 10 biologically independent mice per group, mean ± s.e.m). f, Whole gut preparations of WT or β7−/− mice were treated with or without the GLP-1R antagonist Exendin-9 (100 nM). After 24h supernatant GLP-1 concentrations were measured. (n = 5 biologically independent samples for WT or β7−/− mice without Exendin-9, and n = 4 biologically independent samples for WT mice with Exendin-9, mean ± s.e.m). *P < 0.05, **P < 0.01. All P values from two-tailed unpaired Student’s t-test.
Extended Data Figure 10. Model.
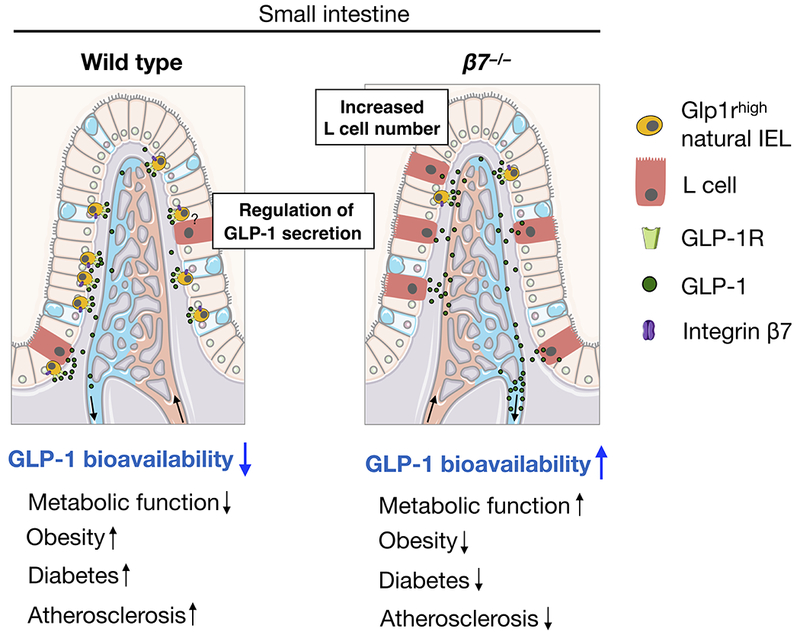
In this study we propose that β7-dependent Glp1rhigh IELs residing in the small intestine modulate dietary metabolism in part by restricting GLP-1 bioavailability. The illustration was modified from Servier Medical Art (http://smart.servier.com/), licensed under a Creative Common Attribution 3.0 Generic License.
Supplementary Material
Acknowledgements.
This work was supported by NIH grants R35 HL135752, R01 HL128264, P01 HL131478, the AHA EIA, and the Patricia and Scott Eston MGH Research Scholar (to F.K.S.). S.H. was supported by AHA Postdoctoral Award (16POST27250124); F.K. and W.C.P. by the German Research Foundation (DFG); S.R. by a postdoctoral fellowship from the Swedish Research Council; M. Nairz by FWF Erwin Schroedinger Fellowship (J3486-B13); J.E.M. by NIH training grant (T32 AI118692); L.H. by a Boehringer Ingelheim Fonds MD Fellowship; D.J.D. by CIHR grant 154321, the Canada Research Chairs program, and a BBDC-Novo Nordisk Chair in Incretin biology. We thank K. Joyes for copy-editing the manuscript.
Footnotes
Competing Financial Interests
None.
Data availability
All relevant data are included in the paper and its Extended Data Figures.
References
- 1.Begg DP & Woods SC The endocrinology of food intake. Nat Rev Endocrinol 9, 584–597 (2013). [DOI] [PubMed] [Google Scholar]
- 2.Drucker DJ The Cardiovascular Biology of Glucagon-like Peptide-1. Cell Metab 24, 15–30 (2016). [DOI] [PubMed] [Google Scholar]
- 3.Cerf-Bensussan N, Begue B, Gagnon J & Meo T The human intraepithelial lymphocyte marker HML-1 is an integrin consisting of a beta 7 subunit associated with a distinctive alpha chain. Eur J Immunol 22, 885 (1992). [DOI] [PubMed] [Google Scholar]
- 4.Cheroutre H, Lambolez F & Mucida D The light and dark sides of intestinal intraepithelial lymphocytes. Nat Rev Immunol 11, 445–456 (2011). [DOI] [PMC free article] [PubMed] [Google Scholar]
- 5.Holzmann B, McIntyre BW & Weissman IL Identification of a murine Peyer’s patch--specific lymphocyte homing receptor as an integrin molecule with an alpha chain homologous to human VLA-4 alpha. Cell 56, 37–46 (1989). [DOI] [PubMed] [Google Scholar]
- 6.Holzmann B & Weissman IL Peyer’s patch-specific lymphocyte homing receptors consist of a VLA-4-like alpha chain associated with either of two integrin beta chains, one of which is novel. EMBO J 8, 1735–1741 (1989). [DOI] [PMC free article] [PubMed] [Google Scholar]
- 7.Parker CM et al. A family of beta 7 integrins on human mucosal lymphocytes. Proc Natl Acad Sci U S A 89, 1924–1928 (1992). [DOI] [PMC free article] [PubMed] [Google Scholar]
- 8.Gorfu G, Rivera-Nieves J & Ley K Role of beta7 integrins in intestinal lymphocyte homing and retention. Curr Mol Med 9, 836–850 (2009). [DOI] [PMC free article] [PubMed] [Google Scholar]
- 9.Buck MD, Sowell RT, Kaech SM & Pearce EL Metabolic Instruction of Immunity. Cell 169, 570–586 (2017). [DOI] [PMC free article] [PubMed] [Google Scholar]
- 10.Johnson AM & Olefsky JM The origins and drivers of insulin resistance. Cell 152, 673–684 (2013). [DOI] [PubMed] [Google Scholar]
- 11.Lumeng CN & Saltiel AR Inflammatory links between obesity and metabolic disease. J Clin Invest 121, 2111–2117 (2011). [DOI] [PMC free article] [PubMed] [Google Scholar]
- 12.Odegaard JI & Chawla A The immune system as a sensor of the metabolic state. Immunity 38, 644–654 (2013). [DOI] [PMC free article] [PubMed] [Google Scholar]
- 13.Swirski FK & Nahrendorf M Leukocyte behavior in atherosclerosis, myocardial infarction, and heart failure. Science 339, 161–166 (2013). [DOI] [PMC free article] [PubMed] [Google Scholar]
- 14.Swirski FK et al. Ly-6Chi monocytes dominate hypercholesterolemia-associated monocytosis and give rise to macrophages in atheromata. J Clin Invest 117, 195–205 (2007). [DOI] [PMC free article] [PubMed] [Google Scholar]
- 15.Hilgendorf I & Swirski FK Making a difference: monocyte heterogeneity in cardiovascular disease. Curr Atheroscler Rep 14, 450–459 (2012). [DOI] [PMC free article] [PubMed] [Google Scholar]
- 16.Berlin C et al. Alpha 4 beta 7 integrin mediates lymphocyte binding to the mucosal vascular addressin MAdCAM-1. Cell 74, 185–195 (1993). [DOI] [PubMed] [Google Scholar]
- 17.Wagner N et al. Critical role for beta7 integrins in formation of the gut-associated lymphoid tissue. Nature 382, 366–370 (1996). [DOI] [PubMed] [Google Scholar]
- 18.Schon MP et al. Mucosal T lymphocyte numbers are selectively reduced in integrin alpha E (CD103)-deficient mice. J Immunol 162, 6641–6649 (1999). [PubMed] [Google Scholar]
- 19.Uehara S, Grinberg A, Farber JM & Love PE A role for CCR9 in T lymphocyte development and migration. J Immunol 168, 2811–2819 (2002). [DOI] [PubMed] [Google Scholar]
- 20.Lycke NY & Bemark M The regulation of gut mucosal IgA B-cell responses: recent developments. Mucosal Immunol 10, 1361–1374 (2017). [DOI] [PubMed] [Google Scholar]
- 21.Fagarasan S & Honjo T Intestinal IgA synthesis: regulation of front-line body defences. Nat Rev Immunol 3, 63–72 (2003). [DOI] [PubMed] [Google Scholar]
- 22.Baggio LL & Drucker DJ Biology of incretins: GLP-1 and GIP. Gastroenterology 132, 2131–2157 (2007). [DOI] [PubMed] [Google Scholar]
- 23.Kahles F et al. GLP-1 secretion is increased by inflammatory stimuli in an IL-6-dependent manner, leading to hyperinsulinemia and blood glucose lowering. Diabetes 63, 3221–3229 (2014). [DOI] [PubMed] [Google Scholar]
- 24.Marso SP et al. Liraglutide and Cardiovascular Outcomes in Type 2 Diabetes. N Engl J Med 375, 311–322 (2016). [DOI] [PMC free article] [PubMed] [Google Scholar]
- 25.Marso SP et al. Semaglutide and Cardiovascular Outcomes in Patients with Type 2 Diabetes. N Engl J Med 375, 1834–1844 (2016). [DOI] [PubMed] [Google Scholar]
- 26.Yusta B et al. GLP-1R Agonists Modulate Enteric Immune Responses Through the Intestinal Intraepithelial Lymphocyte GLP-1R. Diabetes 64, 2537–2549 (2015). [DOI] [PubMed] [Google Scholar]
- 27.Lamont BJ et al. Pancreatic GLP-1 receptor activation is sufficient for incretin control of glucose metabolism in mice. J Clin Invest 122, 388–402 (2012). [DOI] [PMC free article] [PubMed] [Google Scholar]
- 28.Arakawa M et al. Inhibition of monocyte adhesion to endothelial cells and attenuation of atherosclerotic lesion by a glucagon-like peptide-1 receptor agonist, exendin-4. Diabetes 59, 1030–1037 (2010). [DOI] [PMC free article] [PubMed] [Google Scholar]
- 29.Nagashima M et al. Native incretins prevent the development of atherosclerotic lesions in apolipoprotein E knockout mice. Diabetologia 54, 2649–2659 (2011). [DOI] [PMC free article] [PubMed] [Google Scholar]
- 30.Kim M et al. GLP-1 receptor activation and Epac2 link atrial natriuretic peptide secretion to control of blood pressure. Nat Med 19, 567–575 (2013). [DOI] [PubMed] [Google Scholar]
Associated Data
This section collects any data citations, data availability statements, or supplementary materials included in this article.