

Abstract
Abstract. Damage that engenders DNA double‐strand breaks (DSBs) activates ataxia telangiectasia mutated (ATM) kinase through its auto‐ or trans‐phosphorylation on Ser1981 and activated ATM is one of the mediators of histone H2AX phosphorylation on Ser139. The present study was designed to explore: (i) whether measurement of ATM activation combined with H2AX phosphorylation provides a more sensitive indicator of DSBs than each of these events alone, and (ii) to reveal possible involvement of ATM activation in H2AX phosphorylation during apoptosis. Activation of ATM and/or H2AX phosphorylation in HL‐60 or Jurkat cells treated with topotecan (Tpt) was detected immunocytochemically in relation to cell cycle phase, by multiparameter cytometry. Exposure to Tpt led to concurrent phosphorylation of ATM and H2AX in S‐phase cells, whereas G1 cells were unaffected. Immunofluorescence (IF) of the S‐phase cells immunostained for ATM‐S1981P and γH2AX combined was distinctly stronger compared to that of the cells stained for each of these proteins alone. However, because of the relatively high ATM‐S1981P IF of G1 cells, the ratio of IF of S to G1 cells, that is, the factor that determines competence of the assay in distinction of cells with DSBs, was 2‐ to 3‐fold lower for ATM‐S1981P alone, or for ATM‐S1981P and γH2AX IF combined, than for γH2AX alone. ATM activation concurrent with H2AX phosphorylation, likely triggered by induction of DSBs during DNA fragmentation, occurred during apoptosis. The data suggest that frequency of activated ATM and phosphorylated H2AX molecules, per apoptotic cell, is comparable.
INTRODUCTION
Ataxia telangiectasia mutated (ATM) plays a key role in surveillance of the genome's integrity and is the signal transducer in response to induction of DNA double‐strand breaks (DSBs) (Banin et al. 1998; Bakkenist & Kastan 2004). Proteins associated with recognition of DSBs such as components of the Mre11‐Rad50‐NBS1 (MRN) complex, histone H2AX and Rad17 are among the targets phosphorylated by ATM (Kastan & Lim 2000; Lim et al. 2000; Bakkenist & Kastan 2003; Bartek & Lukas 2003; Shiloh 2003; Bartek et al. 2004; Kastan & Bartek 2004; 2005a, 2005b). Also phosphorylated are p53 and the E2F1 transcription factors, mediator of DNA damage checkpoint protein 1 (MDC1), p53 binding protein 1 (53BP1) and BRCA1– mediator and adaptor proteins involved in assembly of multiprotein complexes at the sites of DSBs, as well as SMC1 and FANCD2, S‐phase checkpoint pathway constituents. Phosphorylation of the Chk1 and Chk2 kinases by ATM places this kinase at the crossroads of DNA repair and cell cycle progression pathways (Kristjansdottir & Rudolph 2004). ATM is activated through auto‐ or trans‐phosphorylation on Ser1981. This phosphorylation induces dissociation of the inactive dimer or oligomer form of this protein into enzymatically active monomers (Bakkenist & Kastan 2003). The activation can be detected immunocytochemically with antibodies that specifically react with the Ser1981 phosphorylated (ATM‐S1981P) epitope (Bartkova et al. 2005a).
One of several variants of the nucleosome core histone H2A, histone H2AX (West & Bonner 1980; Thatcher & Gorovsky 1994; Pehrson & Fuji 1998), is also phosphorylated (on Ser139) upon induction of DSBs (Rogakou et al. 1998; Sedelnikova et al. 2002). The phosphorylation is mediated by ATM‐ (Rogakou et al. 1998; Burma et al. 2001; Sedelnikova et al. 2002), ATR‐ (Furuta et al. 2003), and/or DNA‐dependent protein kinase (DNA‐PK) (Park et al. 2003), and occurs (in a domain of about one megabase) at the edges of DSBs (Rogakou et al. 1999). The Ser139 phosphorylated H2AX was named γH2AX and antibodies reactive with the Ser139P epitope of H2AX also have been developed (Paull et al. 2000; Sedelnikova et al. 2002). Upon induction of DSBs γH2AX can be detected immunocytochemically in the form of discrete nuclear foci, each focus assumed to represent a single DSB. DNA repair‐ and checkpoint‐associated proteins such as Rad50, Rad51 and BRCA1, as well as the 53BP1, colocalize with γH2AX (Furuta et al. 2003; Huyen et al. 2004). Similar to ATM (Bakkenist & Kastan 2003), H2AX is phosphorylated in cells not treated with genotoxic agents, in response to the formation of DSBs occurring during V(D)J and class‐switch recombination (Sedelnikova et al. 2003; Bassing & Alt 2004a, 2004b), as well as in association with DNA replication (MacPhail et al. 2003).
Inhibitors of DNA topoisomerases I and II (topo1 and topo2) are widely used anti‐tumour drugs. The mechanisms of their action involve binding to DNA and stabilization of covalently linked complexes between topo1 or topo2 and DNA, which otherwise would be transient (Hsiang et al. 1989; D’Arpa et al. 1990; Wu & Liu 1997). Collisions between the progressing DNA replication fork (during replication) or the progressing RNA polymerase molecule (during transcription) and the stabilized complex converts it into a secondary lesion that is a DSB. When in excess, the DSBs are recognized by the cell as lethal lesions that trigger apoptosis (Del Bino et al. 1991; Gorczyca et al. 1993). Predominantly, DNA‐replicating cells undergo apoptosis upon exposure to topo1 or topo2 inhibitors (Gorczyca et al. 1993).
We have recently reported that H2AX was phosphorylated in response to DNA damage induced by topo1 (camptothecin (Cpt) or topotecan (Tpt)) and topo2 (mitoxantrone (Mtx)) inhibitors, as well as in response to DNA fragmentation during apoptosis (2003, 2004). Using multiparameter cytometry, the induction of γH2AX was correlated with the cell cycle phase: as the topo1 inhibitor Tpt induced H2AX phosphorylation followed by apoptosis quite selectively in S‐phase cells, the topo2 inhibitor Mtx induced H2AX phosphorylation in all phases of the cycle but only S‐phase cells underwent apoptosis (2003, 2004). In the subsequent study (Huang et al. 2005; Kurose et al. 2005), we observed a temporal association between ATM activation and H2AX phosphorylation upon exposure of cells to Tpt or Mtx.
The aim of the present study was to explore whether concurrent measurement of ATM activation and H2AX phosphorylation by cytometry can be a more sensitive indicator of DSBs than each of these events individually. We also intended to reveal whether ATM is activated in response to DNA fragmentation during apoptosis, and how its activation corresponds to H2AX phosphorylation. Towards this end, we exposed cultures of two leukaemic cell lines to Tpt and using multiparameter cytometry, measured activated ATM (ATM‐Ser1981P) and/or Ser139 phosphorylated H2AX, concurrently with cellular DNA content (cell cycle phase). To reveal the possible involvement of ATM activation in H2AX phosphorylation in response to DNA fragmentation during apoptosis, we have also compared intensity of ATM‐S1981P or γH2AX immunofluorescence (IF) of the cells during their primary response to Tpt with that of cells undergoing apoptosis after treatment with Tpt.
MATERIALS AND METHODS
Cell culture and treatments
Human promyelocytic leukaemic HL‐60 cells were obtained from the American Type Culture Collection (ATCC) (Manassas,VA). Human acute T‐cell leukaemia Jurkat BαM cells were kindly provided by Dr D. Green. (La Jolla Institute for Allergy and Immunology, La Jolla, CA). Cells were grown in 25 ml FALCON flasks (Becton Dickinson Co., Franklin Lakes, NJ) in RPMI 1640 supplemented with 10% foetal calf serum, 100 units/ml penicillin, 100 µg/ml streptomycin and 2 mm l‐glutamine (all from Gibco/BRL Life Technologies, Inc., Grand Island, NY) at 37°C at 5% CO2 in air. At the onset of the experiments, there were fewer than 5 × 10⁵ cells per millilitre of culture medium, growing exponentially and asynchronously as described previously (2003, 2004, 2005). Cultures were treated with 75 or 150 nm Tpt, an analogue of Cpt (Hycamptin; Merck Pharmaceutical Co., Rahway, NJ), for a variety of time intervals as described in the figure legends, in succeeding discussions.
Immunocytochemistry
Cells were rinsed (200 g, 5 min) with phosphate‐buffered saline (PBS), and were then fixed in suspension with 1% methanol‐free formaldehyde in PBS at 0 °C for 15 min. They were then post‐fixed in 80% ethanol for at least 2 h at −20 °C. Cells were rinsed once more in PBS (200 g, 5 min) and were resuspended in 1% bovine serum albumin (BSA) (Sigma Chemical Co., St. Louis, MO) in PBS to suppress non‐specific antibody (Ab) binding. After centrifugation, the pellet was resuspended in 100 µl of 1% BSA containing antiphospho‐histone H2A.X (Ser‐139) mouse monoclonal Ab (mAb) (Upstate, Lake Placid, NY, 1 : 100) or antiphospho‐ATM (Ser‐1981) mouse mAb (Upstate, 1 : 100) and incubated for 2 h at room temperature. The cells were rinsed with 1% BSA in PBS (200 g, 5 min) and, after centrifugation, cell pellets were resuspended in 100 µl of 1% BSA containing fluorescein isothiocyanate (FITC)‐conjugated goat antimouse F(ab′)2 fragment (DAKO, Carpinteria, CA, OR) 1 : 30 for 30 min at room temperature in the dark. After washing with 1% BSA, the cells were counterstained with 10 µg/ml propidium iodide (PI) (Molecular Probes, Eugene, OR), or were dissolved in PBS containing 100 µg/ml RNase A (Sigma) for 30 min at room temperature.
Cytometry
The fluorescence of PI and FITC of individual cells induced by excitation with a 488‐nm argon ion laser, were measured using a FACScan cytometer (Becton Dickinson, San Jose, CA). Ten thousand cells were measured per sample. To compare the changes in ATM‐S1981P or γH2AX IF intensity, for example, in relation to cell cycle phase or drug concentration, the mean ATM‐S1981P or γH2AX IF intensity (integral values of individual cells) was calculated for cell subpopulations in G1, and mid S, by gating analysis based on differences in DNA content as illustrated in 1, 2, 3. Further details of ATM‐S1981P and γH2AX IF analysis are presented in ligure legends and have also been described elsewhere (2003, 2004, 2005; Halicka et al. 2005). All experiments were repeated at least three times.
Figure 1.

Induction of ATM activation and H2AX phosphorylation in HL‐60 cells treated in cultures with Tpt. Bivariate (cellular IF versus DNA content) distributions (scatterplots) showing selective response of S‐phase cells to Tpt‐induced DNA damage in terms of ATM activation (phosphorylation of Ser1981, top panels) and histone H2AX Ser139 phosphorylation (bottom panels). Untreated controls or cells exposed to 150 nm Tpt for up to 2 h were fixed and subjected to immunocytochemical detection of ATM‐S1981P or γH2AX concurrent with DNA content measurement, by flow cytometry. The mean values of ATM‐S1981P or γH2AX IF were estimated for G1 cells (marked with oval or circle boundaries) and for mid S‐phase cells (marked by vertical gates), and are shown in each panel. Also given is the ratio of the respective means of IF for S and G1 (S/G1). Insets show cellular DNA content frequency histograms (with marked gates for mid S‐phase cells) from the respective cultures; no significant changes in the cell cycle distribution were apparent during 2 h exposure to (Tpt). Lines marked with arrows (IgG) in the left panels represent the upper level of fluorescence intensity of the control cells stained with the irrelevant isotype IgG instead of specific primary Ab.
Figure 2.

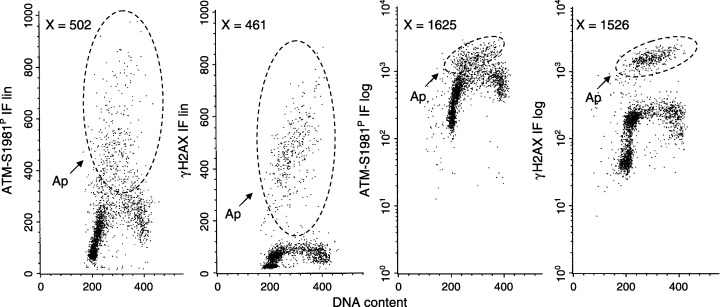
Induction of ATM activation and H2AX phosphorylation in Jurkat BαM cells treated with Tpt. Jurkat cells, like HL‐60 cells (Figure 1), demonstrate selective response of S‐phase cells to Tpt‐induced DNA damage in terms of ATM activation (top panels) and H2AX phosphorylation (bottom panels). Untreated controls or cells exposed to 150 nm Tpt for up to 4 h were subjected to immunocytochemical detection of ATM‐S1981P or γH2AX and DNA content measurement, as described in Figure 1 and in the Materials and methods section. The presence of apoptotic cells was apparent after 4 h treatment with Tpt (Ap; marked within the oval boundaries). Apoptotic cells had somewhat higher ATM‐S1981P and dramatically increased γH2AX IF compared to non‐apoptotic cells. Revealing their presence on the bivariate distributions was necessary to use exponential (log) scale for the γH2AX IF coordinate (right panels). The two distinct levels of ATM‐S1981P or γH2AX IF of the S‐phase cells in the cultures treated with Tpt for 4 h most likely represent the cell response to the primary DNA damage by Tpt (the lower (L) level of (IF) and subsequently to DNA fragmentation during apoptosis (the higher (H) level of (IF) as marked in these panels. As in Figure 1, the lines marked with arrows (IgG) in the left panels show the upper level of fluorescence intensity of the Tpt‐untreated cells stained with the control isotype IgG.
Figure 3.

Detection of Tpt‐induced DNA damage by immunocytochemical detection of γH2AX IF, ATM‐S1981P or combined ATM‐S1981P and γH2AX. Untreated control HL‐60 cells or cells exposed to 75 nm (a–c) or to 150 nm Tpt (d–f) for 1 h were immunostained either for γH2AX (a,d), ATM‐S1981P (b,e) or combined γH2AX IF + ATM‐S1981P (Ctrl, C,F); as described in Materials and methods section. The mean IF of G1 and mid S‐cell populations as well as the S/G1 ratio were estimated as described in 1, 2 and were given in each panel. Intensity of γH2AX, ATM‐S1981P or combined γH2AX IF + ATM‐S1981P IF was measured at an identical voltage setting of the photomuliplier.
In pilot experiments, we observed that intensity of ATM‐A1981P IF of the untreated (Ctrl) as well Tpt‐treated HL‐60 or Jurkat cells, was considerably higher compared to that of γH2AX IF. Therefore, to obtain patterns of cell response to Tpt with respect to ATM and H2AX phosphorylation (as revealed on the bivariate DNA content versus IF distributions) that could be best compared with each other, different voltages were applied to photomultipliers (PMT) during ATM‐S1981P‐ and H2AX‐ IF measurement, respectively (see 1, 2). Under such settings, the difference between the cells that maximally responded to the Tpt treatment (S‐phase cells) and the non‐responding G1‐phase cells, was optimally visualized. However, identical PMT settings for ATM‐S1981P‐ and H2AX‐IF measurement were used to visualize the differences in intensity of ATM‐S1981P‐ versus H2AX‐IF (data shown in Fig. 3).
RESULTS
The induction of expression of ATM‐S1981P and of γH2AX in HL‐60 cells treated with150 nm Tpt for up to 2 h, in relation to the cell cycle phase, is illustrated in Fig. 1. As is apparent, a considerable number of cells showed elevated levels of ATM S1981P‐ and γH2AX‐IF after as little as 10 min of exposure to Tpt. The frequency of such cells and intensity of their IF progressively increased with duration of the treatment. It is also apparent that the Tpt‐induced increase in ATM‐S1981P and γH2AX IF was essentially limited to the S‐phase cells, and mid S‐phase cells demonstrated maximal levels of both ATM‐S1981P and γH2AX IF. In contrast, there were subpopulations of cells in G1 (within the oval‐ or round‐marked boundaries, Fig. 1) that essentially showed no increase in ATM‐S1981P and γH2AX IF during the treatment.
To assess the increase in ATM‐S1981P and γH2AX IF in quantitative terms, the ratio of the IF of the mid S‐phase cells to the G1 cells that were not responding to Tpt (within the marked boundaries) was calculated. The S/G1 IF ratio, thus, reflecting the ‘signal to noise’ ratio in detecting responding cells, is an indicator of competence of the assay for identification of cells with DNA damage induced by Tpt, as assessed by activation ATM or H2AX phosphorylation, respectively. In the case of ATM activation in HL‐60 cells, this ratio increased from 1.4 to 1.8 during the initial 10 min, and rose to 3.1 after 2 h of treatment. In the case of H2AX phosphorylation, the S/G1 IF ratio increased from 2.2 during the initial 10 min, and subsequently rose to 7.7 after 2 h (Fig. 1). Thus, when ATM activation and H2AX phosphorylation (both detected immunocytochemically and measured by cytometry) are compared with each other as indicators of cells with damaged DNA, the latter provides over 2‐fold better resolution based on the higher S/G1 ratio. This higher S/G1 ratio of γH2AX IF of the Tpt‐treated cells is the result of the fact that the level of ATM‐S1981P IF of the G1 cells (the denominator (divisor) in the ratio), apparently reflecting intrinsic ATM activation in G1 cells, was distinctly higher than γH2AX IF of the G1‐phase cells.
Similar analysis carried out for Jurkat cells yielded analogous results (Fig. 2), which is, the mean intensity of ATM‐S1981P IF of the G1 cells, including the untreated cells, was higher than of γH2AX IF of the G1‐phase cells. Likewise, at all time intervals of the treatment with Tpt the S/G1 ratio of γH2AX IF was approximately 3‐fold higher that that of ATM‐S1981P IF. Similar to HL‐60 cells, thus, the distinction of S‐phase cells with DNA damaged by Tpt from G1 cells was better defined, based on differences in γH2AX than in ATM‐S1981 IF.
Analysis of Jurkat cells was carried out for longer intervals of Tpt treatment to observe the changes in ATM‐S1981 and γH2AX that occur during apoptosis, which starts to manifest in these cells after 3 h of continuous exposure to Tpt. Here, the presence of apoptotic cells was apparent after 4 h of treatment with Tpt. Apoptotic cells were independently identified in these cultures by fluorescence microscopy, as the cells with characteristically condensed chromatin and fragmented nuclei (1992, 1997). Apoptotic cells had dramatically increased intensity of γH2AX IF (Fig. 2). In fact, because of extremely strong fluorescence that exceeded limits of the display on the DNA content versus γH2AX IF bivariate distributions that utilized linear γH2AX IF coordinate, apoptotic cells were hardly detectable, nearly all being aligned at the single maximal fluorescence channel. To visualize apoptotic cells population, thus, an exponential γH2AX IF coordinate had to be used (Fig. 2, bottom right panel).
The ATM‐S1981P IF of apoptotic cells was also higher compared to the non‐apoptotic S‐phase cells from the Tpt‐treated cultures. However, the extent of increase above the level of ATM‐S1981P IF of the non‐apoptotic S‐phase cells, was less pronounced than in the case of γH2AX IF. The two distinct levels of ATM‐S1981P or γH2AX IF of the S‐phase cells seen in cultures treated with Tpt for 4 h, thus, represent the cells’ response to the primary DNA damage by Tpt (the lower (L) level of (IF) and subsequently, to DNA fragmentation during apoptosis (the higher (H) level of (IF), respectively (Fig. 2 right panels).
The next experiments were designed to assess whether combined immunostaining of ATM‐S1981P and γH2AX with the same fluorescence‐coloured Ab could provide a better means for detection of cells with damaged DNA than immunostaining of either of these proteins alone. Towards this end, HL‐60 cells were exposed in culture to 75 or 150 nm Tpt and subsequently stained either with a single ATM‐S1981P or γH2AX Ab, or with the combined ATM‐S1981P and γH2AX Abs, and intensity of IF of mid‐S phase cells, as well as S/G1 IF ratio of these cells, were estimated (Fig. 3). Unlike with the data presented in 1, 2, the ATM‐S1981P and γH2AX IF were measured in this experiment under identical PMT voltage so the differences in intensity of ATM‐S1981P versus γH2AX IF could be directly compared. Consistent with the data shown in 1, 2, primarily S‐phase cells responded to Tpt in terms of induction of ATM‐S1981P versus γH2AX IF. The intensity of ATM‐S1981P IF of the mid‐S phase cells was about 2‐ to nearly 3‐fold stronger compared with the intensity of γH2AX IF (for example, 214 versus 466 at 150 nm, and 168 versus 488 at 75 nm Tpt). As would be expected, the concurrent combined detection of γH2AX and ATM‐S1981P resulted in the increased IF of S‐phase cells, compared to the IF of S‐phase cells immunostained with each of these DNA damage markers alone (Fig. 3). The observed increase, however, was less than one would anticipate from the additive effect of γH2AX and ATM‐S1981P IF intensities (617 versus 214+466 at 150 nm and 554 versus 168+488). Yet, the combined immunostaining with ATM‐S1981P and γH2AX IF Ab resulted in the IF signal of S‐phase cells that was distinctly stronger than following immunostaining them with each of these antibodies alone.
Although the IF signal intensity of cells immunostained with the combined Abs was improved compared to each of Ab alone, the S/G1 ratio was only slightly higher than that of the cells immunostained for ATM‐S1981P (2.5 versus 2.3 or 2.8 versus 2.5), and was distinctly lower than of the cells stained for γH2AX alone (2.5–2.8 versus 7.0–8.9). As mentioned previously, the lower S/G1 ratio of ATM‐S1981P or ATM‐S1981P + γH2AX IF is a consequence of the strong ATM‐S1981P IF of the G1 cells (divisor in the ratio). As is evident in Fig. 3, the level of ATM‐S1981P IF or of combined ATM‐S1981P + H2AX IF of G1 cells, that is the cells that essentially did not respond to Tpt treatment, was about 8–9‐fold higher than that of H2AX IF of G1 cells (for example 24 versus 184–225, or 24 versus 218–225).
It should be noted that in untreated cultures, strong labelling of a small fraction of G1 and G2M cells with ATM‐S1981P (not shown), and with combined ATM‐S1981P and γH2AX Ab, was apparent (Fig. 3, Ctrl). We have identified these cells as mitotic (M) and early post‐mitotic (pM) cells. Studies are in progress in our laboratory to reveal the role of ATM activation in these cells.
The data presented in Fig. 2 indicated that induction of γH2AX in Jurkat cells treated with Tpt for 4 h, observed in apoptotic cells, was accompanied by ATM activation. This observation suggests that ATM mediates H2AX Ser139 phosphorylation during apoptosis. The data also suggested that the increase in expression of γH2AX above the level of its expression induced by primary DNA damage in S‐phase cells by Tpt was much more pronounced than the respective increase in expression of activated ATM. On the appearance of these data, thus, it was tempting to speculate that during apoptosis, more H2AX molecules become phosphorylated compared to the number of activated ATM molecules; hence a single ATM molecule may phosphorylate a number of H2AX molecules. However, the data presented in Fig. 2 were collected at different sensitivities of the photodetector set up for the detection of ATM‐S1981P and γH2AX IF, and these results cannot be used to compare ATM‐S1981P versus γH2AX IF in quantitative terms. To reveal a quantitative relationship between ATM activation and H2AX phosphorylation therefore, expression of ATM‐S1981P and γH2AX IF was measured under identical settings of the PMT (Fig. 4). Under these conditions of fluorescence intensity measurement the level of ATM‐S1981P and γH2AX IF of apoptotic cells was remarkably close. Experiments in which the intensity of ATM‐S1981P and γH2AX IF of apoptotic cells was compared, as shown in Fig. 4, were repeated four times, and in each experiment the difference in their IF did not exceed 25%. Furthermore, intensity of ATM‐S1981P versus H2AX IF of apoptotic cells from the cultures treated with Tpt for 4, 5 and 6 h were compared, and the differences also did not exceed 30% (data not shown). Thus, absolute levels of ATM‐S1981P and of γH2AX IF were quite similar in apoptotic cells. However, because the constitutive expression of ATM‐S1981P in the untreated cells (intrinsic expression), as well as in the Tpt‐treated cells, was much higher than that of γH2AX, it is the increase from that level during apoptosis, which was seen to be more pronounced for γH2AX IF.
Figure 4.
ATM‐S1981P and γH2AX IF level of apoptotic cells. Jurkat cells were treated with 150 nm of Tpt for 4 h, immunostained for ATM‐S1981P or γH2AX IF and were stained for DNA. Their fluorescence was measured under identical settings of photodetector sensitivities. The IF intensity on these bivariate distributions is presented using either linear (a,b) or exponential (c,d; 4× log) scale. The mean values of ATM‐S1981P and γH2AX IF of the apoptotic cells (within the marked boundaries) were estimated and are shown in the respective panels.
DISCUSSION
This group has recently reported that activation of ATM (ATM Ser1981 phosphorylation) can be detected immunocytochemically and that intensity of ATM‐S1981P IF can be conveniently measured by multiparameter flow or laser scanning cytometry and correlated with H2AX phosphorylation, cell cycle phase and initiation of apoptosis (Huang et al. 2005; Kurose et al. 2005). The increase in intensity of ATM‐S1981P IF observed upon exposure of cells to topo1 or topo2 inhibitors was consistent with the notion that these drugs induce DSBs and that triggered by their presence, ATM may be either a sole, or one of the protein kinases, that phosphorylate H2AX (Rogakou et al. 1998; Burma et al. 2001; Sedelnikova et al. 2002). Our data thus confirmed the observations of 2005a, 2005b), that this Ab is specific to activated ATM and can be used to monitor activation of this kinase. Attenuation of the Tpt‐mediated induction of ATM‐S1981P IF by caffeine and wortmannin, inhibitors of PI‐3 like kinases (Halicka et al. 2005), provided further evidence of the specificity of this Ab to the ATM‐S1981P and its usefulness for in situ detection of ATM activation.
One of the aims of the present study was to compare the utility of the immunocytochemical detection of ATM activation with the detection of H2AX‐Ser139 phosphorylation and with the combined ATM activation plus H2AX phosphorylation, as indicators of DNA damage induced by Tpt. As mentioned in the Introduction section, the topo1 inhibitor Tpt is known to selectively affect DNA‐replicating cells, inducing DNA damage followed by apoptosis (Del Bino et al. 1991). In the present study, we observed that ATM activation as expressed by the rise in ATM1981P IF as well H2AX phosphorylation (increase in γH2AX IF) were maximal for mid S‐phase cells. We have measured therefore the mean intensity of IF of the mid S‐phase cell population, reflecting the height of the fluorescence signal as a marker reporting sensitivity of the assay in detection of DNA damage by Tpt. The S/G1 ratio of IF, which reflects the ‘signal to noise’ ratio between maximally responding mid S‐phase cells and the non‐responding G1 cells, was also measured. The latter parameter reports on the competence of the assay in distinguishing cells with DNA damaged by Tpt. The data demonstrate that the intensity of ATM‐S1981P IF alone, or of combined ATM‐S1981P plus γH2AX IF, of mid S‐phase cells, was greater that that of γH2AX alone. Thus, in terms of sensitivity of the assay (height of the fluorescence signal), combined immunostaining using the Abs that cumulatively detect both the activated ATM and phosphorylated H2AX, is superior, because it reflects the additive effects of each of these immunostains to elevate IF of the cells with damaged DNA to maximal level. In contrast to maximal intensity of IF, the S/G1 ratio of the IF was distinctly the highest for γH2AX IF alone, compared with ATM‐S1981P or for ATM‐S1981P plus γH2AX IF. Thus, when sensitivity of instrumentation is adequate, the intensity of γH2AX IF alone provides better means to distinguish populations of cells with damaged DNA (DSBs).
Expression of activated ATM in untreated cells (its ‘intrinsic’ or constitutive expression) was distinctly higher than of the phosphorylated H2AX, and was particularly strong in mitotic cells. This appears to contradict the observations of Bartkova et al. (2005a) who were unable to detect significant presence of cells with activated ATM in several tissues, except in bone marrow lymphocytes and spermatocytes, the cells known to contain DSBs that are generated during V(D)J recombination and meiotic recombination, respectively (Bassing & Alt 2004b; Hamer et al. 2004). It is likely, however, that because different techniques were used to detect activated ATM, the contradiction may be more apparent than real. Specifically, the IF of activated ATM as presently measured by cytometry may be a more sensitive approach to detect cells with moderate levels of ATM activation than the indirect immunoperoxidase method and visual cell examination by microscopy, the method used by Bartkova et al. (2005a). It is possible, thus, that we were able to detect ATM‐S1981P‐positive cells because of the higher sensitivity of our method. We are currently investigating the role of ATM activation during mitosis and our preliminary evidence suggests that ATM activation occurs in association with the formation of centrosomes (X. Huang, unpublished). This finding is in support of the observations of Tritarelli et al. (2004) that ATM phosphorylates p53 on Ser15 to target it to centrosomes where p53 appears to play a role in surveillance mechanism for preventing DNA reduplication downstream of the spindle assembly point.
We have recently reported that histone H2AX is phosphorylated in response to DNA fragmentation during apoptosis (Huang et al. 2004). Reflecting the plethora of DSBs induced during apoptosis, the extent of H2AX phosphorylation per individual apoptotic cell was much greater than the extent of H2AX phosporylation reflecting the primary DSBs induced by UV radiation or DNA topoisomerase inhibitors (Huang et al. 2004; Halicka et al. 2005, Kurose et al. 2005). The present data show that apoptotic cells express a distinctly higher level of ATM‐S1981P IF compared to that of the S‐phase cells initially responding to Tpt; that is, those induced by the primary DNA damage, prior to apoptosis. This observation suggests that ATM also mediates H2AX phosphorylation during apoptosis.
Interestingly, the level of ATM‐S1981P expression as reflected by the intensity of its IF in apoptotic cells was quite similar to that of γH2AX IF (Fig. 4). This was the case regardless of whether the cells were treated with Tpt for 4, 5 or 6 h; that is when the duration of apoptosis was prolonged. This suggests that the frequency of activated ATM molecules (reactive with γH2AX Ab), was comparable to the frequency of phosphorylated H2AX molecules per cell. Given the above, it is tempting to speculate that during apoptosis, ATM may be a sole protein kinase that phosphorylates H2AX and that a single ATM molecule may phosphorylate a single H2AX molecule.
ACKNOWLEDGEMENTS
Supported by NCI RO1 CA 28704.
TT and AK contributed equally to this study.
REFERENCES
- Bakkenist CJ, Kastan MB (2003) DNA damage activates ATM through intermolecular autophosphorylation and dimer dissociation. Nature 421, 486. [DOI] [PubMed] [Google Scholar]
- Bakkenist CJ, Kastan MB (2004) Initiating cellular stress responses. Cell 118, 9. [DOI] [PubMed] [Google Scholar]
- Banin S, Moyal L, Shieh S, Taya Y, Anderson CW, Chessa L, Smorodinsky NI, Prives C, Reiss Y, Shiloh Y, Ziv Y (1998) Enhanced phosphorylation of p53 by ATM in response to DNA damage. Science 281, 1674. [DOI] [PubMed] [Google Scholar]
- Bartek J, Lukas J (2003) Chk1 and Chk2 kinases in checkpoint control and cancer. Cancer Cell 3, 421. [DOI] [PubMed] [Google Scholar]
- Bartek J, Lukas C, Lukas J (2004) Checking on DNA damage in S phase. Nat. Rev. Mol. Cell Biol. 5, 792. [DOI] [PubMed] [Google Scholar]
- Bartkova J, Bakkenist CJ, Rajpert‐De Meyts E, Skakkebaek NE, Sehested M, Lukas J, Kastan MB, Bartek J (2005a) ATM activation in normal human tissues and testicular cancer. Cell Cycle 4, 838. [DOI] [PubMed] [Google Scholar]
- Bartkova J, Horejsi Z, Koed K, Kramer A, Tort F, Ziegler K, Guldberg P, Sehested M, Nesland JM, Lukas C, Orntoft T, Lukas J, Bartek J (2005b) DNA damage response as a candidate anti‐cancer barrier in early human tumorigenesis. Nature 434, 829. [DOI] [PubMed] [Google Scholar]
- Bassing CH, Alt FW (2004a) H2AX may function as an anchor to hold broken chromosomal DNA ends in close proximity. Cell Cycle 3, 149. [DOI] [PubMed] [Google Scholar]
- Bassing CH, Alt FW (2004b) The cellular responses to general and programmed DNA double‐strand breaks. DNA Repair 3, 781. [DOI] [PubMed] [Google Scholar]
- Burma S, Chen BP, Murphy M, Kurimasa A, Chen DJ (2001) ATM phosphorylates histone H2AX in response to DNA double‐strand breaks. J. Biol. Chem. 276, 42462. [DOI] [PubMed] [Google Scholar]
- D’Arpa P, Beardmore C, Liu LF (1990) Involvement of nucleic acid synthesis in cell killing mechanisms of topoisomerase poisons. Cancer Res. 50, 6916. [PubMed] [Google Scholar]
- Darzynkiewicz Z, Bruno S, Del Bino G, Gorczyca W, Hotz MA, Lassota P, Traganos F (1992) Features of apoptotic cells measured by flow cytometry. Cytometry 13, 795. [DOI] [PubMed] [Google Scholar]
- Darzynkiewicz Z, Juan G, Li X, Gorczyca W, Murakami T, Traganos F (1997) Cytometry in cell necrobiology. Analysis of apoptosis and accidental cell death (necrosis). Cytometry 27, 1. [PubMed] [Google Scholar]
- Del Bino G, Lassota P, Darzynkiewicz Z. (1991) The S‐phase cytotoxicity of camptothecin. Exp. Cell Res. 193, 27. [DOI] [PubMed] [Google Scholar]
- Furuta T, Takemura H, Liao Z‐Y, Aune GJ, Redon C, Sedelnikova OA, Pilch DR, Rogakou EP, Celeste A, Chen HT, Nussenzweig A, Aladjem MI, Bonner WM, Pommier Y (2003) Phosphorylation of histone H2AX and activation of Mre11, Rad50, and Nbs1 in response to replication‐dependent DNA double‐strand breaks induces by mammalian topoisomerase I cleavage complexes. J. Biol. Chem. 278, 20303. [DOI] [PubMed] [Google Scholar]
- Gorczyca W, Gong J, Ardelt B, Traganos F, Darzynkiewicz Z (1993) The cell cycle related differences in susceptibility of HL‐60 cells to apoptosis induced by various antitumor agents. Cancer Res. 53, 3186. [PubMed] [Google Scholar]
- Halicka HD, Huang X, Traganos F, King MA, Dai W, Darzynkiewicz Z. (2005) Histone H2AX phosphorylation after cell irradiation with UV‐B: Relationship to cell cycle phase and induction of apoptosis. Cell Cycle 4, 339. [PubMed] [Google Scholar]
- Hamer G, Kal HB, Westphal CH, Ashley T, de Rooij DG (2004) ATM expression and activation in the testis. Biol. Reprod. 70, 1206. [DOI] [PubMed] [Google Scholar]
- Hsiang YH, Lihou MG, Liu LF (1989) Arrest of replication forks by drug stabilized topoisomeraseI‐DNA cleavable complexes as a mechanism of cell killing by camptothecin. Cancer Res. 49, 5077. [PubMed] [Google Scholar]
- Huang X, Traganos F, Darzynkiewicz Z. (2003) DNA damage induced by DNA topoisomerase I‐ and topoisomerase II‐ inhibitors detected by histone H2AX phosphorylation in relation to the cell cycle phase and apoptosis. Cell Cycle 2, 614. [PubMed] [Google Scholar]
- Huang X, Okafuji M, Traganos F, Luther E, Holden E, Darzynkiewicz Z. (2004) Assessment of histone H2AX phosphorylation induced by DNA topoisomerase I and II inhibitors topotecan and mitoxantrone and by DNA crosslinking agent cisplatin. Cytometry 58A, 99. [DOI] [PubMed] [Google Scholar]
- Huang X, Halicka HD, Traganos F, Tanaka T, Kurose A, Darzynkiewicz Z. (2005) Cytometric assessment of DNA damage in relation to cell cycle phase and apoptosis. Cell Prolif. 38, 223. [DOI] [PMC free article] [PubMed] [Google Scholar]
- Huyen Y, Zgheib O, Ditullio RA Jr, Gorgoulis VG, Zacharatos P, Petty TJ, Sheston A, Mellert HS, Stavridi ES, Halazonetis TD (2004) Methylated lysine 79 of histone H3 targets 53BP1 to DNA double‐strand breaks. Nature 432, 406. [DOI] [PubMed] [Google Scholar]
- Kastan MB, Bartek J (2004) Cell cycle checkpoints and cancer. Nature 432, 316. [DOI] [PubMed] [Google Scholar]
- Kastan MB, Lim DS (2000) The many substrates and functions of ATM. Nat. Rev. Mol. Cell Biol. 1, 79. [DOI] [PubMed] [Google Scholar]
- Kristjansdottir K, Rudolph J (2004) Cdc25 phosphatases and cancer. Chem. Biol. 11, 1043. [DOI] [PubMed] [Google Scholar]
- Kurose A, Tanaka T, Huang X, Halicka HD, Traganos F, Dai W, Darzynkiewicz Z. (2005) Assessment of ATM phosphorylation on Ser‐1981 induced by DNA topoisomerase I and II inhibitors in relation to Ser‐139‐histone H2AX phosphorylation, cell cycle phase and apoptosis. Cytometry A 68, 1–9. [DOI] [PubMed] [Google Scholar]
- Lim DS, Kim ST, Xu B, Maser RS, Lin J, Petrini JH, Kastan MB (2000) ATM phosphorylates p95/nbs1 in an S‐phase checkpoint pathway. Nature 404, 613. [DOI] [PubMed] [Google Scholar]
- MacPhail SH, Banath JP, Yu Y, Chu E, Olive PL (2003) Cell cycle‐dependent expression of phosphorylated histone H2AX: reduced expression in unirradiated but not X‐irradiated G1‐phase cells. Radiat. Res. 159, 759. [DOI] [PubMed] [Google Scholar]
- Park EJ, Chan DW, Park JH, Oettinger MA, Kwon J (2003) DNA‐PK is activated by nucleosomes and phosphorylates H2AX within the nucleosomes in an acetylation‐dependent manner. Nucleic Acids Res. 31, 6819. [DOI] [PMC free article] [PubMed] [Google Scholar]
- Paull TT, Rogakou EP, Yamazaki V, Kirchgesser CU, Gellert M, Bonner WM (2000) A critical role for histone H2AX in recruitment of repair factors to nuclear foci after DNA damage. Curr. Biol. 10, 886. [DOI] [PubMed] [Google Scholar]
- Pehrson JR, Fuji RN (1998) Evolutionary conservation of histone macro‐H2A subtypes and domains. Nucleic Acids Res. 26, 2837. [DOI] [PMC free article] [PubMed] [Google Scholar]
- Rogakou EP, Pilch DR, Orr AH, Ivanova VS, Bonner WM (1998) DNA double‐stranded breaks induce histone H2AX phosphorylation on serine 139. J. Biol. Chem. 273, 5858. [DOI] [PubMed] [Google Scholar]
- Rogakou EP, Boon C, Redon C, Bonner WM (1999) Megabase chromatin domains involved in DNA double‐strand breaks in vivo . J. Cell Biol. 146, 905. [DOI] [PMC free article] [PubMed] [Google Scholar]
- Sedelnikova OA, Rogakou EP, Panuytin IG, Bonner W (2002) Quantitive detection of 125IUdr‐induced DNA double‐strand breaks with γ‐H2AX antibody. Radiat. Res. 158, 486. [DOI] [PubMed] [Google Scholar]
- Sedelnikova OA, Pilch DR, Redon C, Bonner WM (2003) Histone H2AX in DNA damage and repair. Cancer Biol. Ther. 2, 233. [DOI] [PubMed] [Google Scholar]
- Shiloh Y (2003) ATM and related protein kinases safeguarding genome integrity. Nat. Rev. Cancer 3, 155. [DOI] [PubMed] [Google Scholar]
- Thatcher TH, Gorovsky MA (1994) Phylogenetic analysis of the core histones H2A, H2B, H3 and H4. Nucleic Acids Res. 22, 174. [DOI] [PMC free article] [PubMed] [Google Scholar]
- Tritarelli A, Orricchio E, Ciciarello M, Mangiacasale R, Palens A, Lavia P, Soddu S, Cundari E (2004) p53 Localization at centrosomes during mitosis and postmitotic checkpoint are ATM‐dependent and require serine 15 phosphorylation. Mol. Biol. Cell 15, 3751. [DOI] [PMC free article] [PubMed] [Google Scholar]
- West MH, Bonner WM (1980) Histone 2A, a heteromorphous family of eight protein species. Biochemistry 19, 3238. [DOI] [PubMed] [Google Scholar]
- Wu J, Liu LF (1997) Processing of topoisomerase I cleavable complexes into DNA by transcription. Nucleic Acids Res. 25, 4181. [DOI] [PMC free article] [PubMed] [Google Scholar]