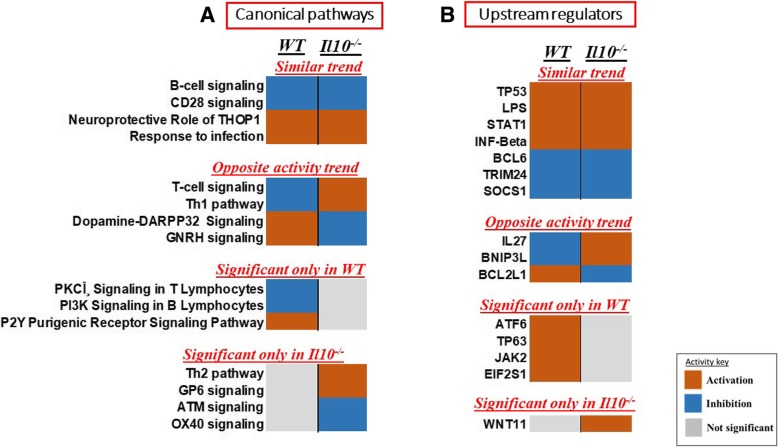
Fig. 5.
Comparative analysis of a) Canonical pathways and b) Upstream regulators responding to radiation in WT and Il10−/− mice. IPA based statistical z-score was used to predict activation (z ≥ 2, orange) or suppression (z ≤ − 2, blue) of a particular pathway or regulator. Grey color indicates no significant activity

