

Abstract
Lymph node (LN) stromal cell populations expand during the inflammation that accompanies T cell activation. Interleukin 17 (IL-17)-producing T helper (TH17) cells promote inflammation through induction of cytokines and chemokines in peripheral tissues. We demonstrate a critical requirement for IL-17 in the proliferation of lymph node (LN) and spleen stromal cells, particularly fibroblastic reticular cells (FRCs), during experimental autoimmune encephalomyelitis and colitis. Without IL-17 receptor signaling, activated FRCs underwent cell cycle arrest and ultimately apoptosis, accompanied by signs of nutrient stress in vivo. IL-17 signaling in FRCs was not required for TH17 cell development, but failed FRC proliferation impaired germinal center formation and antigen-specific antibody production. IL-17 induction of the transcriptional coactivator IκBζ mediated increased glucose uptake and mitochondrial Cpt1a expression. Hence, IL-17 produced by locally differentiating TH17 cells is an important driver of inflamed LN stromal cell activation, through metabolic reprogramming required to support proliferation and survival.
INTRODUCTION
TH17 cells promote pathology in a variety of autoimmune conditions, and therapies targeting TH17 cells are proving highly effective in some autoimmune diseases1, 2. Interleukin 17 (IL-17), the prototypical TH17 cytokine, targets non-hematopoietic cells to induce production of chemokines that attract myeloid cells, pro-inflammatory cytokines such as IL-6, and antimicrobial peptides2. TH17 cells are therefore important regulators of extracellular bacterial and fungal pathogens. In the healthy skin and gut, IL-17 maintains microbial homeostasis without overt inflammation, and supports gut epithelial healing following toxic injury3, 4. IL-17 also promotes development of tertiary lymphoid structures that support protective immunity, but may perpetuate chronic inflammation during autoimmunity5, 6. Hence, the context of IL-17 signaling plays an important role in eliciting an inflammatory or tissue-protective response.
Like all naïve T cells, TH17 cells are activated and differentiate in secondary lymphoid organs (SLOs) including lymph nodes (LNs) and spleen, where they have an opportunity to interact with resident stromal cells during differentiation. Fibroblastic reticular cells (FRCs) are the critical non-hematopoietic stromal cells in SLOs. T cell zone FRCs were the first identified FRC population, characterized to express the chemokine CCL19 and IL-7 to attract T cells and support their survival7. They also secrete extracellular matrix (ECM) that ensheaths conduits carrying lymph for dendritic cell (DC) sampling, and forms a cellular scaffold that facilitates T cell migration7. In addition to T cell zone stroma, FRCs are now known to comprise heterogeneous subpopulations occupying distinct niches throughout the LN. Recent single-cell level analyses of LN stromal cells delineated seven podoplanin (PDPN)+ FRC subpopulations8. These subsets include follicular dendritic cells (FDCs) in B cell follicles, marginal zone reticular cells (MRCs) in the subcapsullar sinus, 2 populations of medullary reticular cells (MedRCs) known to support plasma cells9, and 3 subsets of T zone reticular cells (TRCs): classical CCL19hi TRCs, a CXCL9+ interfollicular TRC population, and a CCL19lo TRC population that expresses the B cell survival factor BAFF and the B cell-attracting chemokine CXCL13 at B:T zone borders10.
FRC depletion or dysfunction in mouse models causes SLO follicular disorganization, reduced T and B cell viability, and impaired antiviral immunity10,11,. Chronic fibrosis of LNs that occurs during HIV or SIV infection exacerbates T cell loss due to reduced access to IL-7 from FRCs coated in excess ECM12, 13. Similar LN fibrosis with reduced FRC numbers was found in subjects from Uganda with chronic immune activation syndrome, corresponding to reduced T cells and impaired antibody production following vaccination14. Conversely, FRCs regulate the magnitude of type 1 CD4+ T helper (TH1) and CD8+ T cell responses through production of nitric oxide in response to interferon-γ (IFN-γ)15, 16, 17. Similarly, FRCs regulate type 1 innate lymphoid cell (ILC1) responses by reducing IL-15 production in response to MyD88 signaling18. Thus FRCs are thought to reduce immunopathology during viral infection. By presenting self antigens, FRCs can delete self-reactive CD8+ T cells and induce CD4+ regulatory T (Treg) cells 19, 20. Hence FRCs play important roles both in supporting and regulating adaptive immune responses.
Following pathogen invasion or immunization, activated DCs migrate to local LNs and trigger endothelial ‘shutdown’, generating rapid organ size increase due to retained lymphocytes21. At first, cytoskeletal relaxation in FRC allows stretching of the network22. Then, FRCs proliferate to provide the increased stromal support needed by the expanded lymphoid tissue23, 24. The kinetics of FRC proliferation are offset against LN size increase by several days24 and more closely follow activation kinetics of T cells, which are thought to provide proliferation-supporting signals24, 25. However, the nature of these signals have been unclear. In this study, we investigated the role of IL-17 produced by differentiating TH17 cells on local FRCs during inflammation in SLOs.
RESULTS
TH17 cells drive increased ECM in inflamed LNs
Increased production of ECM components such as fibronectin and collagen are features of TH17-mediated inflammation, including the central nervous system (CNS) during multiple sclerosis (MS) or its animal model experimental autoimmune encephalomyelitis (EAE)26, 27. Following immunization with the myelin oligodendrocyte glycoprotein peptide MOG(aa35–55) in complete Freund’s adjuvant (CFA) to induce EAE, we observed that expression of Fn1 (encoding fibronectin) increased along with Il17a in draining LNs (Supplementary Fig. 1a). Immunization-induced Fn1 required IL-23R (Fig. 1a), implicating ‘type-17’ IL-23R+ cells that could be TH17 cells, type 3 innate lymphoid cells (ILC3) or γδ T cells. We therefore dissected the role of de novo generated antigen-specific TH17 cells in driving Fn1 expression following immunization. Wild-type or Il23r−/− CD4+ TCR-transgenic OT-II cells were transferred into wild-type or Il23r−/− hosts, which were then immunized with the OT-II-activating ovalbumin peptide OVA(aa323–339) in CFA. As expected28, IL-17 was only strongly induced when OT-II cells expressed IL-23R (i.e. wild-type OT-II), and did not require host IL-23R (Fig. 1b). Similarly, Fn1 expression was only increased when OT-II cells were able to successfully produce IL-17 (Fig. 1c).
Figure 1: IL-23R-IL-17 axis drives increased fibronectin in dLN following immunization for EAE.

A: Fn1 gene expression (relative values normalized to Gapdh) in inguinal LN from naïve wild-type mice and from wild-type and Il23r−/− mice analyzed on day 15 post-immunization with MOG(35–55) in CFA. B,C: Wild-type or Il23r −/− OT-II T cells were transferred to wild-type or Il23r−/− hosts, as indicated, and mice were immunized with OVA (323–339) in CFA the following day. Il17a (B) and Fn1 (C) gene expression were analyzed on day 15 in inguinal LN. D-L: Indicated mice were immunized with MOG(35–55) in CFA, and dLN analyzed on day 15 post-immunization with LN from naïve mice as controls; D-F: Fn1 gene expression relative to Gapdh; Data in (A-F) are representative of two independent experiments. Data show mean +/− S.D; each symbol represents an individual mouse G: Immunofluorescence staining of fibronectin; H: Col1a1 gene expression; Data representative of two independent experiments. Data show mean +/− S.D; each symbol represents an individual mouse I: Collagen stained by Masson’s Trichrome (blue) with hematoxylin (pink); J-L: Gross appearance (J), weights (K) and total cell counts (L). Data in (K-L) show mean +/− S.D. pooled from 2–3 experiments, each symbol represents an individual mouse, except G, I, J are representative images from n=4 mice/group. G and I were repeated twice with similar results. P values calculated by one-way ANOVA except F,K and L by Student’s t-test, * P<0.05, ** P<0.01, ***P<0.001, ****P<0.0001.
To determine whether IL-17 itself was required for Fn1 increases in inflamed LNs, we immunized Il17a−/− mice with MOG(35–55) in CFA. Indeed, Fn1 expression was impaired in dLNs of Il17a−/− mice compared to wild-type following immunization (Fig. 1d). Immunization-elicited Fn1 was dependent on IL-17RA and the signaling adaptor Act1, further confirming the requirement for the IL-17 signaling pathway (Fig. 1e, f). To confirm these gene expression changes resulted in protein changes, we performed immunofluorescence (IF) staining. Fibronectin expression again increased in wild-type but not Il17ra−/− dLNs following immunization (Fig. 1g). Expression of Col1a1, encoding collagen type 1a was also increased in dLNs in an IL-17RA-dependent manner following immunization (Fig. 1h), but Col3a1 did not change indicating some specificity to the ECM components that were regulated by IL-17 (Supplementary Fig. 1b). Correspondingly, collagen deposition was increased in wild-type but not Il17ra−/− mouse dLNs (Fig 1I). Despite these defects in ECM, the gross appearance, mass and cell numbers were similar between dLNs from immunized Il17ra−/− , Il17−/− and wild-type controls (Fig 1J-L, Supplementary Fig. 1c). These data thus suggested that TH17 cells promote expression of ECM in inflamed dLNs through IL-17 signaling, independently of LN size or hypercellularity.
IL-17 signaling is required for FRC population expansion
FRCs are the major cell type that expresses fibronectin and type I collagen in LN7, and IF staining confirmed co-localized expression of the FRC marker ERTR7 with fibronectin in dLN (Supplementary Fig. 2a). We therefore analyzed the stromal cell composition of naïve LNs and inflamed dLNs from immunized wild-type and Il17ra−/− mice. CD45–CD31–PDPN+ FRC were significantly increased in number in wild-type inflamed LN and spleen from immunized animals compared to naïve LN, and this increase required IL-17 signaling as dLN from immunized Il17ra−/− or Il17−/− had significantly reduced FRC numbers compared to wild-type (Fig. 2a, b and Supplementary Fig. 2b, c). As further confirmation of the importance of IL-17 signaling in inflamed LN, FRC numbers were reduced in absence of the IL-17R signaling adaptor Act1 (Fig 2c). Regnase-1 is a potent negative regulator of IL-17 signaling29, and accordingly mice with reduced Regnase-1 expression had increased numbers of FRCs following immunization (Fig 2d). In contrast, numbers of CD45–PDPN+CD31+ lymphoid endothelial cells (LECs) and CD45–PDPN–CD31+ blood endothelial cells (BECs) were not different in dLN from immunized l17ra−/− compared to controls (Fig. 2e, f, Supplementary Fig. 2b). PDPN+CD21+CD35+ follicular dendritic cells (FDC) and PDPN+MadCAM1+ marginal zone reticular cells (MRC), were unchanged by IL-17 deficiency (Fig 2g,h). While not an exhaustive characterization of stromal cell subsets, these data suggested that the CD21–MadCAM1–CCL19+ TRC population, which is also the largest and best positioned to interact with TH17 cells, may be a functional target of IL-17 signaling in lymphoid tissues.
Figure 2: FRC population expansion during TH17 response requires IL-17 signaling.

Wild-type or indicated knockout mice were immunized for EAE and dLN analyzed on day 15, compared to naïve wild-type LN by flow cytometry. A-D: Numbers of CD45–PDPN+CD31– FRC cells in dLN (A,C,D) and spleen (B) from indicated mice. E: Numbers of CD45–PDPN+CD31+ lymphatic endothelial cells; F: numbers of CD45–PDPN–CD31+ blood endothelial cells; G: numbers of PDPN+CD21+CD35+ follicular dendritic cells (FDC). H: numbers of PDPN+MadCAM1+ marginal zone reticular cells (MRC); Data in (A-H) show mean +/− S.D. pooled from 2–3 experiments, each symbol represents an individual mouse. P values calculated by one-way ANOVA except C,D,G and H by Student’s t-test, * P<0.05, ** P<0.01, ***P<0.001, ****P<0.0001.
FRC respond directly to IL-17 during inflammation
We next sought to determine the factors that regulate IL-17-dependent increases in FRC numbers. Lymphotoxin (LT)α and LTβ are critical for development, expansion and maintenance of FRC populations in LN11. Lta and Ltb expression increased in response to immunization, but were not different between wild-type and Il17ra−/− mice, suggesting that IL-17 does not regulate lymphotoxin availability (Fig. 3a,b). FRC numbers in LN from naïve Il17ra−/− mice were similar to wild-type mice (Supplementary Fig. 3a), further supporting an IL-17-independent function of lymphotoxins in FRC development. To rule out any contribution of developmental defects to the impaired FRC response in Il17−/− mice, we immunized wild-type mice with MOG(35–55) in CFA and administered IL-17 neutralizing antibodies (Supplementary Fig. 3b). FRC numbers were again significantly reduced in LN from anti-IL-17 treated mice compared to isotype controls (Fig. 3c), despite similar LN size between these groups (Supplementary Fig. 3c). Moreover, Fn1 expression was significantly reduced when IL-17 was neutralized (Supplementary Fig. 3d).
Figure 3: FRC-specific ablation of IL-17RA results in defective expansion.

A,B: Gene expression of lymphotoxin α (Lta) (A) and lymphotoxin β (Ltb) (B) in naïve, wild-type EAE and 17RA−/−EAE inguinal LN on day 15 post-immunization. Data in (A-B) are representative of two independent experiments. Data show mean +/− S.D; each symbol represents an individual mouse C: Numbers of FRC cells in dLN from wild-type mice immunized for EAE with administration of 100ug anti-IL-17 or isotype control, analyzed by flow cytometry on day 15. D: Frequencies of neutrophils in indicated naïve and day 15 EAE LN. E-G: CCL19Cre x IL17RAfl/fl (FRC∆Il17ra) mice and CCl19Cre × IL17RAfl/+ littermate controls (FRCctrl) were immunized for EAE and dLN analyzed on day 15 (except F is day 12) by flow cytometry for neutrophils (E) and numbers of FRC (F,G). Data in (C-G) are pooled from 2–3 experiments, represented as mean +/− S.D. and each symbol represents an individual mouse. P values calculated by one-way ANOVA except C,E,F and G by Student’s t-test, * P<0.05, ** P<0.01, ***P<0.001, ****P<0.0001.
These data confirmed a role for IL-17 in promoting FRC proliferation in mature SLO following immunization. However, they did not rule out an indirect effect of IL-17 within the LN. For example, IL-17 signaling leads to neutrophil recruitment30, and accordingly neutrophils were decreased in immunized Il17ra−/− dLN compared to wild-type (Fig. 3d). To determine whether IL-17 signaling is required in FRC, FRCΔIl17ra mice were generated by crossing Il17rafl/fl mice with the FRC-specific CCL19Cre11, 22, 31 (Supplementary Fig. 3e). Ccl19CreIl17rafl/+ littermates were analyzed as controls (FRCctrl). FRCΔIl17ra showed no defect in neutrophil recruitment following immunization (Fig. 3e), indicating that FRC are not a necessary source of neutrophil-attracting chemokines in response to IL-17 signaling in LN. As observed in Il17ra−/− dLN, LEC and BEC numbers were unchanged in FRCΔIl17ra (Supplementary Fig. 3f, g). Expression of Fn1 and Col1a1, but not Col3a1, were also significantly decreased in FRCΔIl17ra mice compared to FRCctrl (Supplementary Fig. 3h-j). Furthermore, numbers of FRC in LN of FRCΔIl17ra mice were significantly decreased on day 12 and 15 post-immunization (Fig. 3f,g). Thus we concluded that FRC-intrinsic IL-17 signaling is required for their successful proliferation during LN inflammation.
FRC-intrinsic IL-17 signaling promotes antibody production
It might be expected that reduced numbers of FRCs would impact the adaptive immune system. However, numbers of CD4+ T cells and B cells were not different between immunized FRCΔIl17ra and FRCctrl mice (Fig. 4a, b). The disruption of FRC stromal architecture in immunized FRCΔIl17ra dLN did not disrupt B and T cell zones, and frequencies of naïve and effector T cell populations, as well as IL-17-producing TH17 cells, were unaffected (Fig. 4c, Supplementary Fig. 4a-c). Since already-differentiated TH17 cells produce IL-17 to then potentiate FRC proliferation, this is perhaps unsurprising in this acute model. However, there was a significant decrease in the frequency of germinal center B cells from immunized dLN when FRCs could not respond to IL-17 (Fig. 4d, Supplementary Fig. 4c), and a corresponding defect in induction of total immunoglobulin G (IgG) as well as MOG-specific IgG production (Fig. 4e, f). B cell activating factor (BAFF) is produced by FRCs to support B cell survival under homeostatic conditions10. IL-17 did not stimulate increased BAFF production in FRC in vitro (Fig. 4g). However, corresponding to reduced numbers of FRC, BAFF levels were significantly decreased in LN from immunized FRCΔIl17ra mice (Fig. 4h). Hence, lack of IL-17 signaling in FRC does not lead to global immune defects, but does cause impaired B cell responses, most likely through reduced availability of BAFF at a critical juncture for germinal center formation and maintenance.
Figure 4: IL-17 signaling in FRC is required to support germinal centers and antibody production.
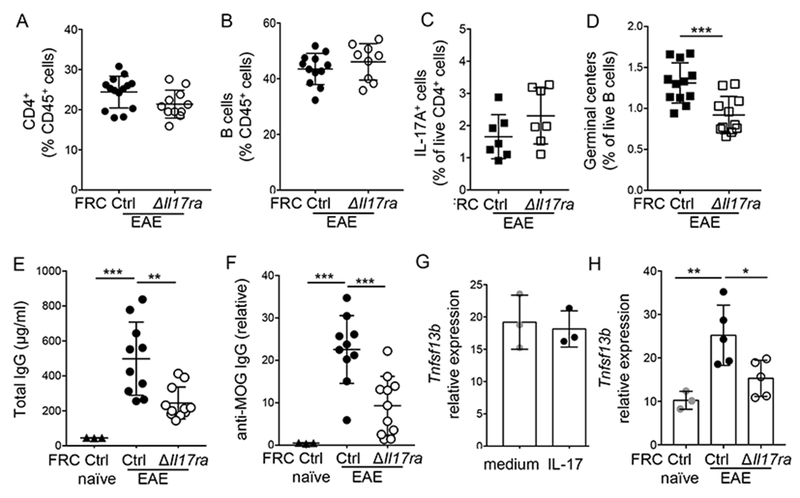
FRCctrl and FRC∆Il17ra mice were immunized with MOG(35–55) in CFA, and frequencies and phenotype of adaptive response was analyzed on days 12–14; A: Frequency of CD4+ T cells out of total live cells, B: Frequency of B220+ B cells out of live cells; C: Frequency of IL-17+ cells out of live CD4+ T cells following stimulation with PMA/ionomycin; D: Frequency of germinal center B cells analyzed as GL-7+CD95+ cells out of live B220+ cells; E: Concentration of total IgG in serum, F: Concentration of MOG-specific IgG in serum, Data in (A-F) are pooled from 2–3 experiments, represented as mean +/− S.D. and each symbol represents an individual mouse. G: GP38+ FRC were isolated from day 6 immunized wild-type LN and spleen, and stimulated with IL-17 for 12 hours, then gene expression of Tnfsf13b encoding BAFF was analyzed by qPCR and normalized to GAPDH; H: Gene expression of Tnfsf13b analyzed by qPCR in dLN on day 14 post-immunization. Data in (G-H) are representative of two independent experiments. Data show mean +/− S.D; each symbol represents an individual mouse. P values calculated by one-way ANOVA except A-D and G by Student’s t-test, * P<0.05, ** P<0.01, ***P<0.001, ****P<0.0001.
Colitis increases local IL-17-dependent FRC numbers
CFA is a potent long-acting adjuvant, and we wanted to test whether the IL-17-dependent increase in FRC numbers was more broadly applicable to inflamed LN. We therefore analyzed FRC in gut-draining mesenteric LN (MLN) during DSS colitis, a colon injury model in which IL-17 plays a protective role in restoring epithelial barrier integrity3, 4. As expected, Il17ra–/– mice developed more severe colitis, as determined by weight loss and colon length, while FRCΔIL17RA mice developed colitis of similar severity to controls since the gut epithelium response to IL-17 was intact (Fig. 5a, b, c, Supplementary Fig. 5a). Naïve mice with FRC-specific ablation of IL-17RA showed no difference in MLN FRC numbers compared to littermate controls, again confirming that IL-17 is not required for FRC development (Supplementary Fig. 5b). Numbers of FRC increased in the inflamed MLN of wild-type mice after administration of DSS compared to water controls (Fig. 5d). Strikingly, the colitis-driven MLN FRC population expansion was critically dependent on IL-17RA expression by FRC, rather than differing gut epithelial cell IL-17RA expression and disease severity in Il17ra−/− and FRCΔIL17RA mice (Fig. 5d). Therefore, these data support the conclusion that FRC-intrinsic IL-17RA expression is required for FRC remodeling in the dLN during inflammation that elicits an IL-17 response, regardless of the type of peripheral tissue insult.
Figure 5: Acute colon inflammation drives IL-17-dependent increase of FRC in mesenteric LN.
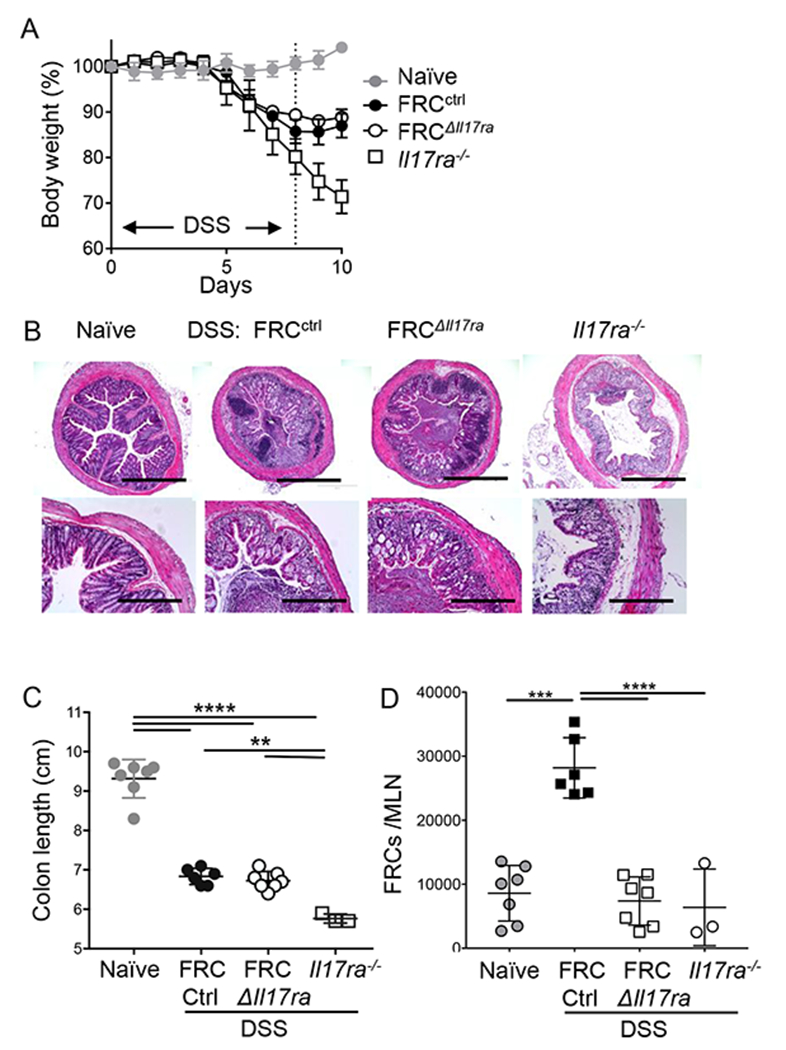
FRCctrl, FRC∆Il17ra and Il17ra–/– mice received 2.5% DSS in drinking water for 7 days followed by 3 days of water, naïve control received normal drinking water. A: Body weights shown as % of starting weight; B: representative H&E images of day 10 colon in indicated naïve and DSS mice; C: Colon length on day 10; D: Numbers of FRC in mesenteric LN (MLN) analyzed on day 10 by flow cytometry gating on live CD45–CD31–PDPN+ cells. Data in A is pooled from two independent experiments and shown as mean +/− S.D. (Naïve=7, FRCctrl=6, FRC∆Il17ra=7 and Il17ra–/–= 6 mice), Data in B is representative images from n=4 mice/group repeated twice with similar results, and data in (C-D) are pooled from 2 experiments, represented as mean +/− S.D. and each symbol represents an individual mouse. P values calculated by one-way ANOVA, * P<0.05, ** P<0.01, ***P<0.001, ****P<0.0001.
IL-17 potentiates FRC proliferation and survival
To further understand how IL-17 promotes FRC activation, we performed transcriptomic analysis of dLN FRC isolated at day 12 post-immunization (Supplementary Fig. 6a). Known IL-17 targets were increased in wild-type compared to Il17ra−/− FRC (Fig. 6a), including genes encoding CXCL1, CXCL2, s100a8, s100a9, C/EBPβ and IκBζ32. Fitting with decreased FRC numbers, gene set enrichment analysis (GSEA) showed significant dysregulation of the cell cycle pathway in Il17ra−/− FRC (Fig. 6b). There was a trend towards reduced expression of the cell cycle-associated protein ki67 in Il17ra−/− FRC in LN and a significant decrease in Ki67 in spleen (Fig. 6c and Supplementary Fig. 6b, c). Ki67 marks all cells that have initiated cell cycle. In fact, a number of the genes identified by GSEA to be increased in Il17ra−/− FRC are negative regulators of cell cycle, including Trp53, Nek2, Tfdp1, Chek2 and Rad17 (Fig. 6d). We therefore analyzed cell cycle stages and found that similar proportions of cells were in G2/M phase, but significantly fewer FRCΔIl17ra cells were in S phase compared to FRCctrl, with an inverse trend towards increased G0/G1, which includes resting cells (Fig. 6e, Supplementary Fig. 6d). Fibroblasts have been shown to actively express genes that maintain cellular quiescence and suppress proliferation following in vitro triggers of quiescence such as growth factor withdrawal or cell-contact inhibition33. Il17ra−/− FRC had high expression of these fibroblast quiescence-associated genes when compared to wild-type FRC (Supplementary Fig. 6e), further supporting that cell cycle was stalled.
Figure 6: IL-17 promotes proliferation and cell survival of inflamed LN FRC.

A: Wild-type and IL-17RA−/− FRC (live CD45–CD31–PDPN+ cells) were sorted from dLN (N=2, each sample was pooled from 4 mice) on day 12 post-immunization for RNA-sequencing, heat map shows relative expression of IL-17-responsive genes in wild-type FRCs compared to IL-17RA−/− FRCs, * indicates genes with p<0.05 in global differential gene expression analysis (Partek). B: Gene set enrichment analysis (GSEA) of cell cycle pathway; C: Frequency of Ki67+ cells out of CD45–CD31–PDPN+ FRCs determined by flow cytometry in indicated groups in inguinal LN, day 12 post-immunization. Data pooled from 2 experiments, represented as mean +/− S.D. and each symbol represents an individual mouse. D: Heat map of GSEA-identified cell cycle pathway genes, * indicates genes with p<0.05 in global differential gene expression analysis (Partek).; E: FRCctrl and FRC∆Il17ra mice were immunized for EAE, and BrdU pulse administered 24hr before harvest, cell cycle status of live CD45–PDPN+CD31– splenic FRC analyzed by BrdU and 7-AAD staining on day 12 post-immunization; Data pooled from 2 experiments, represented as mean +/− S.D. and each symbol represents an individual mouse F: Gene set enrichment analysis of apoptosis pathway; G: ERTR7 and TUNEL immunofluorescence analysis in dLN on day 15 post-immunization; Data are representative images from n=4 mice/group repeated twice with similar results, H: Quantification of TUNEL+ cells in ERTR7+ zones from indicated LN, each symbol represents counts from a separate field of view, data pooled from two separate experiments; I: Frequency of FRC staining positive for active caspase 3 in dLN of FRCctrl and FRC∆Il17ra mice on day 15 post-immunization analyzed by flow cytometry. Data pooled from 2 experiments, represented as mean +/− S.D. and each symbol represents an individual mouse. P values calculated by one-way ANOVA except I by Student’s t-test, * P<0.05, ** P<0.01, ***P<0.001, ****P<0.0001.
Cell cycle analysis also revealed increased apoptotic cells in IL-17RA-deficient FRC (Fig. 6e). There was no difference in total cell viability of digested wild-type and Il17ra−/− LN, in accord with similar total LN cell numbers (Supplementary Fig. 6f). However, GSEA pathway analysis supported significant upregulation of apoptotic pathways in IL-17RA-deficient FRC (Fig. 6f). Immunofluorescence staining confirmed significantly increased frequencies of cells that were positive for the apoptosis markers TUNEL and active caspase 3 in dLN of immunized Il17ra–/– mice compared to wild-type (Fig. 6g, h, Supplementary Fig. 6g, h). As further confirmation of the FRC-intrinsic role of IL-17 in maintaining FRC viability, there were significantly increased frequencies of apoptotic FRC in dLN from immunized FRCΔIl17ra compared to controls (Fig. 6i, Supplementary Fig. 6i). Taken together, these data indicate a critical role for IL-17 in promoting survival and continued proliferation of activated FRC.
IL-17 drives metabolic reprogramming in proliferating FRC
Proliferation requires increased energy, and insufficient nutrient availability can be a cause of halted cell cycle and increased apoptosis in proliferating cells. Nutrient stress, including low glucose, leads to induction of autophagy through activation of AMPK34. Il17ra−/− FRC had increased expression of genes regulating autophagy (Fig. 7a), corresponding with increased activation of AMPK (Fig. 7b). GSK3β phosphorylation can also be an indicator of glucose uptake and glycolysis35, and IL-17 signaling has previously been associated with regulation of GSK3β activity32. Indeed, Il17ra−/− FRC had decreased phosphorylation of GSK3β (Fig. 7c), further supporting a possible defect in energy metabolism in absence of IL-17 signaling. We therefore directly assessed the ability of FRC to take up glucose in vivo by injecting the fluorescent glucose analog 2-NBDG on day 12 post-immunization. FRC from immunized LN had significantly increased 2-NBDG uptake compared to naïve controls (Fig. 7d, e Supplementary Fig. 7a), while FRC from immunized Il17ra–/–, as well as FRCΔIl17ra LN and spleen, showed a striking defect in 2-NBDG uptake (Fig. 7d-g, Supplementary Fig. 7b). These data show that IL-17 signaling is required to increase the capacity for glucose uptake in proliferating FRC.
Figure 7: FRC undergo an IL-17-dependent metabolic shift during inflammation.

A: Relative expression of markers of autophagy (from RNA-Seq analysis described in Fig 6), * indicates genes with p<0.05 in global differential gene expression analysis (Partek); B: FRC from wild-type and Il17ra–/– EAE inguinal LN on day 12 post-immunization, immunoblotted for Phosphorylated AMPKα and total AMPKα. Data are representative of two independent experiments; C: pGSK3β analyzed by flow cytometry in FRC isolated from naïve, wild-type EAE and Il17ra–/– EAE dLN on day 12 post-immunization. Data are representative of two independent experiments with n=3–4 mice/group; D,E: Frequencies of 2-NBDG+ FRC (D) and geometric mean fluorescence intensity (GMFI) of 2-NBDG in total FRC (E) in dLN from indicated mice injected with 2-NBDG 30 minutes prior to sacrifice and analyzed on day 12 post-immunization, gating on live CD45–CD31–PDPN+ cells. Each symbol represents inguinal LN from separate mice. F,G: Frequencies of 2-NBDG+ FRC (F) and GMFI of 2-NBDG in total FRC (G) in dLN from FRCctrl and FRC∆Il17ra treated as in D. Data in (D-G) are pooled from 2 experiments, represented as mean +/− S.D. and each symbol represents an individual mouse. H-I: FRCs isolated as CD45–CD31–PDPN+ cells from naïve, wild-type EAE and Il17ra–/– EAE dLN and spleen on day 12 post-immunization were subjected to Seahorse metabolic analysis; H: Extracellular acidification rate (ECAR); I: Oxygen consumption rate (OCR) trace; J: spare respiratory capacity (SRC) calculated as the difference between initial OCR values and maximal OCR values achieved after FCCP uncoupling from FRC analyzed by Seahorse as in F. H-J show mean +/− S.D. of pooled data from 3 experiments, each performed with pooled FRC from 2–3 mice/group and 2–5 technical replicates; K: heatmap of relative expression of metabolic genes on day 12 post-immunization (p<0.05), RNA-Seq as described in Figure 6. L: Cpt1a expression in day 12 FRC analyze by flow cytometry of dLN from FRCctrl and FRC∆Il17ra mice on day 12 of EAE. Data pooled from 2 experiments, represented as mean +/− S.D. and each symbol represents an individual mouse. P values calculated by one-way ANOVA except F, G and L by Student’s t-test, * P<0.05, ** P<0.01, ***P<0.001, ****P<0.0001.
To determine the functional metabolic capacity of FRC activated in presence or absence of IL-17, we performed Seahorse extracellular flux analysis on pooled LN and spleen FRC from immunized wild-type and Il17ra–/– mice and compared to naïve wild-type controls. Corresponding to increased glucose uptake, aerobic glycolysis (as assessed by extracellular acidification rate (ECAR)), was increased following immunization in wild-type but not Il17ra−/− FRC (Fig. 7h). Similarly, wild-type FRC from immunized mice showed a strong increase in basal oxygen consumption rate (OCR), indicating enhanced oxidative phosphorylation (OXPHOS) (Fig. 7i), and correspondingly had a high spare respiratory capacity (SRC) compared to naïve FRC (Fig. 7i, j). In contrast, FRC from immunized Il17ra−/− LN had relatively lower basal OXPHOS rates with minimal SRC, more similar to naïve FRC (Fig. 7i ,j). Gene expression data supported the IL-17RA-dependent increases in metabolic activity: compared to wild-type, FRC from Il17ra−/− immunized LN had low expression of the inflammation-induced glycolytic enzyme Hk2, and the rate limiting enzyme of mitochondrial fatty acid oxidation Cpt1a, along with several subunits of mitochondrial complex I NADH:ubiquitinone oxidoreductase (NDUF) (Fig. 7k). However, mitochondrial mass per FRC was not dependent on IL-17RA (not shown). We further confirmed that Cpt1a protein expression was reduced when IL-17RA was specifically deleted in FRC (Fig. 7l and Supplementary Fig. 7c). These data thus demonstrate that IL-17 signaling is required for activated FRC to increase their glucose uptake, glycolysis and particularly mitochondrial bioenergetic activity, corresponding with the requirement for IL-17 signaling in promoting successful proliferation of FRC.
IL-17 promotes metabolic changes through IκBζ
The data so far clearly implicate FRC-intrinsic IL-17 signaling in driving metabolic changes. However, FRC isolated from naive LN and stimulated in vitro with IL-17 did not increase their glucose uptake, as assessed by 2-NBDG (Fig. 8a). In contrast, dLN FRC from mice immunized 6 days previously did increase 2-NBDG uptake in response to IL-17 stimulation (Fig. 8b). These data therefore suggest that IL-17 modulation of glucose absorption requires that cells have first received ‘priming’ signals in an inflamed LN.
Figure 8: IL-17 promotes glucose uptake through Iκbζ expression.

FRCs were isolated from wild-type dLN and spleen on day 6 post-immunization for EAE or naïve as indicated in A-C. A,B: FRC were stimulated in vitro with IL-17 followed by incubation with 2-NBDG to assess glucose uptake, A shows representative FACS plots, B shows GMFI of pooled data. Data in (A-B) are representative of two independent experiments, show mean +/− S.D with n=3 mice/group and were repeated thrice with similar results; C: FRCs from naïve, wild-type EAE and Il17ra–/– EAE dLN (day 12) were cultured in media or in presence of LPS, and glucose uptake measured via luciferase assay to detect 2-deoxyglucose-6-phosphate. Data pooled from 2 experiments, represented as mean +/− S.D. and each symbol represents an individual mouse; D-F: FRC were transfected in triplicate with IκBζ siRNA for 24 hours then stimulated with IL-17 for 12 hours before analysis, D: Nfkbiz gene expression, E: Fibronectin gene expression F: Collagen 1a (Col1a1) gene expression, G: glucose-uptake competency assessed by flow cytometry of 2-NBDG added for final 30 minutes of culture, H: Cpt1a gene expression, all gene expression normalized to Gapdh. Data in (D-H) are representative of two independent experiments, represented as mean +/− S.D. and each symbol represents an individual mouse. P values calculated by one-way ANOVA, * P<0.05, ** P<0.01, ***P<0.001, ****P<0.0001.
We then tested the converse question: does prior IL-17 signaling in vivo alter the threshold for glucose uptake in response to distinct stimuli? Lipopolysaccharide (LPS), a prototypical TLR agonist known to drive glycolysis in myeloid cells, strongly increased glucose uptake in wild-type FRC from immunized LN, but not from naïve LN (Fig. 8c). Interestingly, FRC from immunized Il17ra−/− dLN did respond to LPS, but with significantly lower rates of glucose uptake compared to wild-type FRC (Fig. 8c), supporting the idea that FRC receiving activating signals that render them responsive to further stimuli, but require IL-17 to reach full bioenergetic potential.
One intriguing link between the IL-17 and LPS signaling pathways is that they both induce IκBζ, a co-activator of the NF-κB signal transduction pathway, to drive a subset of target inflammatory genes32,36. Nfkbiz, which encodes IκBζ, was accordingly decreased in FRC from immunized Il17ra−/− mice compared to wild-type controls (Fig. 6a). IL-17 stimulation induced Nfkbiz expression in FRC from day 6 primed LN, as expected, and Nfkbiz expression was effectively depleted by siRNA (Fig. 8d). IL-17-induced expression of Fn1 and Col1a1 were unaffected by Nfkbiz deletion, confirming that IL-17 signaling was intact and that IκBζ does not regulate all IL-17 target genes (Fig. 8e, f). However, IL-17-stimulated glucose uptake was significantly decreased in Nfkbiz-deleted FRC (Fig. 8g). Furthermore, IL-17 induced Cpt1a expression in an Nfkbiz-dependent manner (Fig. 8h). Therefore we conclude that IL-17 directs metabolic shifts in activated FRC through induction of the transcriptional co-activator IκBζ, leading to increased glucose uptake and expression of rate-limiting enzymes for mitochondrial oxidative phosphorylation.
DISCUSSION
The most well-known function of IL-17 is to promote inflammation through induction of chemokines and cytokines that recruit and activate myeloid cells during inflammation32. However, IL-17 is implicated in diseases that include proliferation of non-immune cells as a pathological feature, and it has been reported that IL-17 signaling promotes proliferation of keratinocytes in models of psoriasis37 and skin tumorigenesis38, and of oligodendrocyte precursors in a model of MS39. Our finding that IL-17 potentiates proliferation and survival of FRC through enhanced metabolic capacity now makes it very interesting to consider the potential contribution of IL-17-induced metabolic shifts in other cell targets in the context of pathologic tissue remodeling and fibrosis that accompany chronic inflammation. In addition, our data lead us to speculate that metabolic changes could underlie the synergistic activity of IL-17 with lymphotoxin in driving de novo FRC differentiation and proliferation for tertiary lymphoid follicle formation in autoimmunity6.
IL-17 is known to play a critical role in promoting B cell antibody responses. IL-17-deficient mice have defective IgA and IgG1 responses to oral immunization with cholera toxin40. Similarly, IL-17 is required for formation of GC and antibody class-switching in models of autoimmune disease41, 42. The mechanisms by which IL-17 promotes B cell activation remain unclear. It has been proposed that TH17 cells promote intestinal IgA production through conversion to T follicular helper cells (TfH) that can then drive GC reactions43, however this does not explain the role of IL-17 itself. In immunized Il17ra–/– mice, TfH cells are present in normal numbers, but may not correctly localize to GC light zones44. Complete depletion of FRC in naïve CCL19creDTXfl/fl mice results in reduced numbers of T and B cells, disorganized B cell follicles, and impaired adaptive immunity to influenza virus infection10. Although FRC numbers were reduced when they could not respond to IL-17, we did not find that Il17ra deficiency caused a clear defect in effector T cell responses in either EAE or DSS colitis. Similarly, total B cell and plasma cell frequencies were unchanged in EAE, suggesting that impaired antibody response in Il17ra−/− mice is not a simple outcome of reduced FRC numbers leading to reduced T and B cell survival. The connection between IL-17 signaling in FRC and antibody response is particularly interesting in context of autoimmune diseases, where both autoantibody and TH17 responses are commonly present.
Unlike lymphotoxin, IL-17 does not appear to be required for development of the FRC network. Instead, the role of IL-17 in promoting metabolic fitness was restricted to inflammation-induced FRC proliferation. The corresponding finding that FRC from naïve mice were unresponsive to IL-17-stimulated glucose uptake leads us to speculate that IL-17 acts as ‘signal 2’ in FRC activation, while prior signals such as clec2, mechanical stretch or lymphotoxin provide ‘signal 1’ to drive proliferation. Given the roles of FRC in SLO homeostasis, it seems likely that this provides an extra layer of regulation to avoid tolerance breakdown due to inappropriate activation of FRC. It is thus interesting to speculate that IL-17-stimulated FRC are more prone to inappropriate or exaggerated responses to activating stimuli due to their heightened metabolic status, providing a clue to the involvement of IL-17 in loss of tolerance and in relapses that characterize autoimmune inflammation.
IL-17 is itself a relatively weak activator of NF-κB signaling45, but strongly synergizes with other NF-ΚB-activating cytokines, including TNF and lymphotoxin32. IL-17 signaling will inevitably synergize with additional cytokines present in the inflamed local milieu, making the profound impact of IL-17 deficiency even more remarkable under TH17-activating conditions. The observation that IL-17 signaling lowered the threshold of activated FRC to stimulation from LPS suggested that the heightened metabolic function of IL-17-stimulated stromal cells is an additional modus operandi for the synergistic activities of IL-17 with a surprising range of cytokines and TLR stimuli.
IL-17 signaling not only directly modulates gene expression through NF-κB activation, it also strongly alters signaling transduction networks through induction of transcriptional regulators32. IκBζ is an inducible transcriptional coactivator with NF-ΚB in driving inflammatory cytokine expression, in response to stimulation of either the IL-17-Act145 or TLR/IL-1-Myd88 pathways36. IκBζ expression is negatively regulated by Regnase129, corresponding to increased FRC numbers in mice with reduced Regnase1 activity. Although IκBζ has not previously been linked to metabolism, it has been shown to promote survival of epithelial cells46, and B cell lymphoma cells47, the latter through co-activation of NF-κB. Indeed, NF-κB activity links metabolism to cell survival in cancer cells by increasing mitochondrial respiration48, 49 and glucose uptake50. It will be interesting in future to further investigate molecular mechanisms by which IκBζ regulates metabolism, and the associated influence on inflammation. Since IκBζ did not regulate ECM production, this also suggests that divergent IL-17 signaling pathways could be targeted in disease states to separate tissue remodeling and fibrosis effects from cell metabolism and proliferation.
In conclusion, we show that during TH17 cell differentiation in draining LN, IL-17 signals to FRC had a profound impact on LN stromal organization by promoting FRC activation through a phenotypic switch from quiescence to a highly metabolically active phenotype. Most strikingly, IL-17 deficiency resulted in stalled proliferation and increased apoptosis of FRC, accompanied by signs of severe metabolic stress. Hence these data reveal the intimate connections between differentiation of a pro-inflammatory effector TH17 response and alterations in the FRC network that support the inflamed hypercellular LN environment, with outcomes on B cell adaptive responses. These findings provide new insight into mechanisms by which TH17 cells can mediate inflammation and tissue remodeling in lymphoid organs, and support further investigation of this role for IL-17 in peripheral tissue targets of TH17-dependent inflammation.
METHODS
Mice
The following mice were used: C57BL/6, Il17a−/−, OT-II, Il17rafl/fl 51mice (Jackson Laboratory), Act1−/− (Traf3ip2−/−)mice52, CCL19Cre mice (EMMA repository, Infrafrontier), Il23r−/− mice53, Il17ra−/− (Amgen, Inc), Regnase1+/– (Zc3h12a+/–) mice54. All experiments included age- and sex-matched controls. Mice were housed under SPF conditions in an AAALAC-approved facility. Protocols were approved by the University of Pittsburgh IACUC and adhered to guidelines in the Guide for the Care and Use of Laboratory Animals of the NIH.
Experimental Autoimmune Encephalomyelitis
Mice were immunized subcutaneously in 2 sites on the back with 100 μg myelin oligodendrocyte glycoprotein (MOG) peptide (35–55) (Biosynthesis) emulsified with Complete Freund’s Adjuvant (CFA) with M. tuberculosis strain H37Ra (DIFCO Laboratories). Mice also received 100 ng pertussis toxin (List Biological Laboratories) i.p. on day 0 and day 2. Mice were assessed daily and scored as follows: 1, flaccid tail; 2, impaired righting reflex and hindlimb weakness; 3, partial hindlimb paralysis; 4, complete hindlimb paralysis; 5, hindlimb paralysis with partial forelimb paralysis; 6, moribund. For IL-17 neutralization studies, mice were treated i.p. with 100 μg of anti-IL-17A (clone 17F3, BioXCell) or mouse IgG1 isotype control anitbody (clone MOPC-21, BioXCell) every 3 days starting at day of EAE immunization till day 12 of immunization.
OT-II transfer
Wild-type or Il23r−/− recipient mice received 1 × 10⁵ Il23r−/− or Il23r+/+ OT-II CD4+ T cells i.p. 1 day before being immunized subcutaneously in the flank with 100 μg OVA (323–339) in CFA.
DSS colitis
Mice received 2.5% DSS (36,000–50,000 M.W.; MP Biomedicals) in their drinking water for 7 days, followed by 3 days of distilled water without DSS. Control animals received distilled water for the entire period. Mice were monitored daily for body weight and sacrificed on day 10 for MLN isolation.
qPCR
RNA isolated with RNeasy Mini Kits (QIAGEN), cDNA generated with Superscript III First Strand kits (Invitrogen), followed by real-time RT-PCR (qPCR) using SYBR Green Master mix with ROX (Invitrogen) and RT2 qPCR Primers (QIAGEN) on a 7300 Real Time instrument (Applied Biosystems). Gene expression normalized to GAPDH.
FRC preparation for flow cytometry
LNs, and spleens where indicated, were incubated in digestion medium (RPMI, 0.1 mg/ml DNase I (Invitrogen), 0.1–0.2 mg/ml liberase (Roche) and 0.8 mg/ml dispase (Roche)19. Collected single-cell suspensions were filtered. Spleen samples underwent red blood cell lysis. For flow cytometry, cells were stained with Ghostdye510 viability dye (Tonbo Biosciences) in PBS, followed by labeling with CD45 (30-F11, Invitrogen), CD45.2 (104, BD Biosciences), PDPN (8.1.1, Biolegend), CD31 (MEC 13.3, BD Biosciences) and Ki67 (SolA15, eBioscience), Madcam-1 (MECA-89, BD), CD21/CD35 (Clone: 7G6, BD), Cpt1a (8F6AE9, Abcam), CD4 (GK1.5, Invitrogen), B220 (RA3–6B2, BD), IL-17RA (PAJ-17R, Invitrogen) and CountBright™ Absolute Counting Beads (Molecular Probes). For detection of apoptosis, FRC were stained with FITC Active Caspase-3 Apoptosis Kit (BD Biosciences), as per manufacturer’s protocol. For in vivo cell cycle analysis, mice were injected i.p. with 1 mg of bromodeoxyuridine (BrdU flow kit; BD Biosciences) 24 h before sacrifice. Data acquired with a FACS Fortessa (BD Biosciences), analyzed using FlowJo (Tree Star).
Histology and Immunocytochemistry
Sections from frozen LNs were fixed in 4% paraformaldehyde, stained with Masson Trichrome (Sigma) to detect collagen deposition according to manufacturer’s instructions; Primary antibodies used for immunofluorescence staining: ERTR7 (Santacruz; sc73355), Fibronectin (Thermoscientific; FBN11), CD4 (BioLegend; GK1.5), B220 (BioLegend; RA3–6B2) and cleaved caspase-3 (Cell Signaling; D175), TUNEL staining performed using apoptosis detection kit (Millipore). Images acquired with EVOS FL Auto microscope (Life Technologies). TUNEL+ cells enumerated in 6–10 randomly selected high-powered fields (400X) per slide.
RNA sequencing and GSEA
Live CD45–CD31–PDPN+ FRC from wild-type and Il17ra−/− mice (4/group, day 12 post-immunization) were sorted on a FACSAria directly into SmartSeq low-input RNA kit lysis buffer. DNA libraries were prepared (Nextera XT kit) and RNA-Sequencing was performed on Illumina NextSeq500 by Health Sciences Sequencing Core at University of Pittsburgh. Raw sequence reads were cleaned for adapter sequences using Trimmomatic with default parameters 55. Trimmed reads were mapped onto mouse genome build mm9 using TopHat2.1.1 and gene expression values (FPKM; fragments per kilobase exon per million mapped reads) calculated using Cufflinks2.2.1 56. Unbiased hierarchical clustering of differentially expressed genes with P < 0.05 calculated using Partek software. Relative expression shown in heatmaps was calculated as fpkm for each sample divided by mean expression of that gene in all samples. Gene set enrichment analysis (GSEA) from the Broad Institute (http://www.broad.mit.edu/gsea) was used to calculate enrichment of genes in each set. Cell cycle and apoptosis pathway gene lists were assembled using Qiagen’s SABiosciences pathway PCR arrays.
Antibody ELISA
Total IgG concentrations in serum detected by mouse IgG ELISA kit (Invitrogen). For detection of MOG-specific antibody in serum, 96-well-plates were coated overnight with recombinant MOG protein (AnaSpec) (10 μg/ml), blocked for 2 h, then incubated with sera (serial dilutions starting from 1:100) for 3 h. After washing, antibody bound to rMOG were detected by HRP-labeled anti-IgG antibody, and developed using mouse IgG ELISA kit (Invitrogen), O.D. values of 1:333 dilution were normalized relative to standard curve for anti-IgG for each experiment, since standards for anti-MOG IgG are not commercially available.
FRC isolation
LNs and spleens digested as described above. Resulting cell suspension was incubated with anti-CD31-APC (MEC13.3; BioLegend) and anti-CD45-APC (30-F11; BioLegend), followed by anti-APC selection cocktail and magnetic particles (EasySep; StemCell Technologies). After negative selection (MACS column, Miltenyi Biotech), the flow-through containing FRC was further incubated with anti-PDPN-PE (8.1.1; BioLegend) and anti-PE selection cocktail and magnetic particles (EasySep; StemCell Technologies) followed by positive selection. This typically resulted in 80–95% CD45–PDPN+CD31– FRCs.
Immunoblotting
CD45–CD31– cells isolated from LNs as described above were immediately lysed on ice in lysis buffer (50 mM Tris pH 8, 150 mM NaCl, 2 mM NaF and 0.01% NP40) containing 1 mM sodium orthovanadate (phosphatase inhibitor), 50 mM PMSF, and protease inhibitor cocktail (Calbiochem). Samples were boiled in 4× sample buffer (Bio-Rad) and immunoblotted using anti-Phospho-AMPKα and anti-AMPKα (Cell Signaling Technology).
Seahorse metabolic assay
FRC were plated on Cell-Tak coated Seahorse culture plates (50,000 cells/well) in DMEM with 25 mM glucose, 1% BSA, 1 mM pyruvate, 2 mM glutamine, and analyzed using a Seahorse XFe96 (Agilent). EACR (Basal extracellular acidification) and OCR (oxygen consumption rates) for 160 min, as cells were stimulated with oligomycin (2 mM), carbonyl cyanide 4-(trifluoromethoxy) phenylhydrazone (FCCP); 0.5 mM, 2-deoxyglucose (100 mM) and rotenone/antimycin A (100 mM) to obtain maximal and control OCR values. SPR (Spare respiratory capacity) measured as the difference between basal and maximal OCR values before and after addition of FCCP.
siRNA transfection
Isolated FRC were rested overnight then transfected with 50nM ON-TARGETplus SMARTpool siRNAs targeting Nfkbiz or scrambled control (Dharmacon) in DharmaFECT Reagent 1 (Dharmacon) for 24 h before stimulation with 200ng/ml IL-17 (Peprotech) for 12hr.
Glucose uptake
In vivo, 500 nM of 2-NBDG (2-(N-(7-Nitrobenz-2-oxa-1,3-diazol-4-yl)Amino)-2-Deoxyglucose) (Cayman Chemicals) was injected via tail vein 30 min prior to sacrifice. In vitro, 2-NBDG was added for final 30 min. of culture. Uptake of 2-NBDG (a fluorescent glucose analog) was then assessed by flow cytometry. Glucose uptake following LPS stimulation ex vivo measured by Glucose Uptake-Glo™ Assay kit (Promega) according to the manufacturer’s instructions.
Statistics
Experimental results were analyzed for significance using ONE-WAY ANOVA (for multiple groups) or Student’s t-test, except EAE clinical data analyzed by Mann-Whitney test on each day of scoring. Statistical analyses were performed using GraphPad Prism. P values are shown as *, P <0.05, **, P < 0.01, and ***, P < 0.001, where statistical significance was found, and all data are represented as mean ± standard deviation.
Supplementary Material
ACKNOWLEDGEMENTS
Funding for this study provided by NIH AI110822, AI128991 (M.J.M.); NIH T32-AI089443 (I.R.), NIH DK104680 (P.S.B.), NIH DE022550, DE023815 and AI107825 (S.L.G.), R.K. Mellon Institute for Pediatric Research (T.W.H.), AACR SU2C-AACR-IRG-04-16 and NIH DP2AI136598 (G.M.D.). This research was supported in part by the University of Pittsburgh Center for Research Computing through the resources provided. We thank V. Kuchroo (Harvard University) for Il23r−/− mice, P. Kolattukudy (University of Central Florida) for zc3h12a+/– (Regnase1)+/– mice, J. Kolls (Tulane University) for Il17rafl/fl mice (now available at JAX labs), and Louise D’Cruz for critical reading of the manuscript.
Footnotes
ACCESSION NUMBERS
GEO accession number GSE124649 for RNA sequencing data.
COMPETING INTERESTS STATEMENT
The authors declare no competing interests
REFERENCES
- 1.Patel DD & Kuchroo VK Th17 Cell Pathway in Human Immunity: Lessons from Genetics and Therapeutic Interventions. Immunity 43, 1040–1051 (2015). [DOI] [PubMed] [Google Scholar]
- 2.Gaffen SL, Jain R, Garg AV & Cua DJ The IL-23-IL-17 immune axis: from mechanisms to therapeutic testing. Nat Rev Immunol 14, 585–600 (2014). [DOI] [PMC free article] [PubMed] [Google Scholar]
- 3.Lee JS et al. Interleukin-23-Independent IL-17 Production Regulates Intestinal Epithelial Permeability. Immunity 43, 727–738 (2015). [DOI] [PMC free article] [PubMed] [Google Scholar]
- 4.Maxwell JR et al. Differential Roles for Interleukin-23 and Interleukin-17 in Intestinal Immunoregulation. Immunity 43, 739–750 (2015). [DOI] [PubMed] [Google Scholar]
- 5.Grogan JL & Ouyang W A role for Th17 cells in the regulation of tertiary lymphoid follicles. Eur J Immunol 42, 2255–2262 (2012). [DOI] [PubMed] [Google Scholar]
- 6.Pikor NB et al. Integration of Th17- and Lymphotoxin-Derived Signals Initiates Meningeal-Resident Stromal Cell Remodeling to Propagate Neuroinflammation. Immunity 43, 1160–1173 (2015). [DOI] [PubMed] [Google Scholar]
- 7.Brown FD & Turley SJ Fibroblastic reticular cells: organization and regulation of the T lymphocyte life cycle. J Immunol 194, 1389–1394 (2015). [DOI] [PMC free article] [PubMed] [Google Scholar]
- 8.Rodda LB et al. Single-Cell RNA Sequencing of Lymph Node Stromal Cells Reveals Niche-Associated Heterogeneity. Immunity 48, 1014–1028 e1016 (2018). [DOI] [PMC free article] [PubMed] [Google Scholar]
- 9.Huang HY et al. Identification of a new subset of lymph node stromal cells involved in regulating plasma cell homeostasis. Proc Natl Acad Sci U S A 115, E6826–E6835 (2018). [DOI] [PMC free article] [PubMed] [Google Scholar]
- 10.Cremasco V et al. B cell homeostasis and follicle confines are governed by fibroblastic reticular cells. Nat Immunol 15, 973–981 (2014). [DOI] [PMC free article] [PubMed] [Google Scholar]
- 11.Chai Q et al. Maturation of lymph node fibroblastic reticular cells from myofibroblastic precursors is critical for antiviral immunity. Immunity 38, 1013–1024 (2013). [DOI] [PMC free article] [PubMed] [Google Scholar]
- 12.Zeng M et al. Cumulative mechanisms of lymphoid tissue fibrosis and T cell depletion in HIV-1 and SIV infections. J Clin Invest 121, 998–1008 (2011). [DOI] [PMC free article] [PubMed] [Google Scholar]
- 13.Estes JD et al. Antifibrotic therapy in simian immunodeficiency virus infection preserves CD4+ T-cell populations and improves immune reconstitution with antiretroviral therapy. J Infect Dis 211, 744–754 (2015). [DOI] [PMC free article] [PubMed] [Google Scholar]
- 14.Kityo C et al. Lymphoid tissue fibrosis is associated with impaired vaccine responses. J Clin Invest (2018). [DOI] [PMC free article] [PubMed] [Google Scholar]
- 15.Khan O et al. Regulation of T cell priming by lymphoid stroma. PLoS One 6, e26138 (2011). [DOI] [PMC free article] [PubMed] [Google Scholar]
- 16.Lukacs-Kornek V et al. Regulated release of nitric oxide by nonhematopoietic stroma controls expansion of the activated T cell pool in lymph nodes. Nat Immunol 12, 1096–1104 (2011). [DOI] [PMC free article] [PubMed] [Google Scholar]
- 17.Siegert S et al. Fibroblastic reticular cells from lymph nodes attenuate T cell expansion by producing nitric oxide. PLoS One 6, e27618 (2011). [DOI] [PMC free article] [PubMed] [Google Scholar]
- 18.Gil-Cruz C et al. Fibroblastic reticular cells regulate intestinal inflammation via IL-15-mediated control of group 1 ILCs. Nat Immunol 17, 1388–1396 (2016). [DOI] [PMC free article] [PubMed] [Google Scholar]
- 19.Fletcher AL et al. Lymph node fibroblastic reticular cells directly present peripheral tissue antigen under steady-state and inflammatory conditions. J Exp Med 207, 689–697 (2010). [DOI] [PMC free article] [PubMed] [Google Scholar]
- 20.Dubrot J et al. Lymph node stromal cells acquire peptide-MHCII complexes from dendritic cells and induce antigen-specific CD4(+) T cell tolerance. J Exp Med 211, 1153–1166 (2014). [DOI] [PMC free article] [PubMed] [Google Scholar]
- 21.Cyster JG Chemokines, sphingosine-1-phosphate, and cell migration in secondary lymphoid organs. Annu Rev Immunol 23, 127–159 (2005). [DOI] [PubMed] [Google Scholar]
- 22.Astarita JL et al. The CLEC-2-podoplanin axis controls the contractility of fibroblastic reticular cells and lymph node microarchitecture. Nat Immunol 16, 75–84 (2015). [DOI] [PMC free article] [PubMed] [Google Scholar]
- 23.Chyou S et al. Coordinated regulation of lymph node vascular-stromal growth first by CD11c+ cells and then by T and B cells. J Immunol 187, 5558–5567 (2011). [DOI] [PMC free article] [PubMed] [Google Scholar]
- 24.Yang CY et al. Trapping of naive lymphocytes triggers rapid growth and remodeling of the fibroblast network in reactive murine lymph nodes. Proc Natl Acad Sci U S A 111, E109–118 (2014). [DOI] [PMC free article] [PubMed] [Google Scholar]
- 25.Katakai T, Hara T, Sugai M, Gonda H & Shimizu A Lymph node fibroblastic reticular cells construct the stromal reticulum via contact with lymphocytes. J Exp Med 200, 783–795 (2004). [DOI] [PMC free article] [PubMed] [Google Scholar]
- 26.Teesalu T, Hinkkanen AE & Vaheri A Coordinated induction of extracellular proteolysis systems during experimental autoimmune encephalomyelitis in mice. Am J Pathol 159, 2227–2237 (2001). [DOI] [PMC free article] [PubMed] [Google Scholar]
- 27.Han MH et al. Proteomic analysis of active multiple sclerosis lesions reveals therapeutic targets. Nature 451, 1076–1081 (2008). [DOI] [PubMed] [Google Scholar]
- 28.McGeachy MJ et al. The interleukin 23 receptor is essential for the terminal differentiation of interleukin 17-producing effector T helper cells in vivo. Nat Immunol 10, 314–324 (2009). [DOI] [PMC free article] [PubMed] [Google Scholar]
- 29.Garg AV et al. MCPIP1 Endoribonuclease Activity Negatively Regulates Interleukin-17-Mediated Signaling and Inflammation. Immunity 43, 475–487 (2015). [DOI] [PMC free article] [PubMed] [Google Scholar]
- 30.Khader SA, Gaffen SL & Kolls JK Th17 cells at the crossroads of innate and adaptive immunity against infectious diseases at the mucosa. Mucosal Immunol 2, 403–411 (2009). [DOI] [PMC free article] [PubMed] [Google Scholar]
- 31.Chung J et al. Fibroblastic niches prime T cell alloimmunity through Delta-like Notch ligands. J Clin Invest 127, 1574–1588 (2017). [DOI] [PMC free article] [PubMed] [Google Scholar]
- 32.Amatya N, Garg AV & Gaffen SL IL-17 Signaling: The Yin and the Yang. Trends Immunol 38, 310–322 (2017). [DOI] [PMC free article] [PubMed] [Google Scholar]
- 33.Coller HA, Sang L & Roberts JM A new description of cellular quiescence. PLoS Biol 4, e83 (2006). [DOI] [PMC free article] [PubMed] [Google Scholar]
- 34.Okoshi R et al. Activation of AMP-activated protein kinase induces p53-dependent apoptotic cell death in response to energetic stress. J Biol Chem 283, 3979–3987 (2008). [DOI] [PubMed] [Google Scholar]
- 35.Loberg RD, Vesely E & Brosius FC 3rd. Enhanced glycogen synthase kinase-3beta activity mediates hypoxia-induced apoptosis of vascular smooth muscle cells and is prevented by glucose transport and metabolism. J Biol Chem 277, 41667–41673 (2002). [DOI] [PubMed] [Google Scholar]
- 36.Yamamoto M et al. Regulation of Toll/IL-1-receptor-mediated gene expression by the inducible nuclear protein IkappaBzeta. Nature 430, 218–222 (2004). [DOI] [PubMed] [Google Scholar]
- 37.Ha HL et al. IL-17 drives psoriatic inflammation via distinct, target cell-specific mechanisms. Proc Natl Acad Sci U S A 111, E3422–3431 (2014). [DOI] [PMC free article] [PubMed] [Google Scholar]
- 38.Wu L et al. A novel IL-17 signaling pathway controlling keratinocyte proliferation and tumorigenesis via the TRAF4-ERK5 axis. J Exp Med 212, 1571–1587 (2015). [DOI] [PMC free article] [PubMed] [Google Scholar]
- 39.Wang C et al. IL-17 induced NOTCH1 activation in oligodendrocyte progenitor cells enhances proliferation and inflammatory gene expression. Nat Commun 8, 15508 (2017). [DOI] [PMC free article] [PubMed] [Google Scholar]
- 40.Datta SK et al. Mucosal adjuvant activity of cholera toxin requires Th17 cells and protects against inhalation anthrax. Proc Natl Acad Sci U S A 107, 10638–10643 (2010). [DOI] [PMC free article] [PubMed] [Google Scholar]
- 41.Hsu HC et al. Interleukin 17-producing T helper cells and interleukin 17 orchestrate autoreactive germinal center development in autoimmune BXD2 mice. Nat Immunol 9, 166–175 (2008). [DOI] [PubMed] [Google Scholar]
- 42.Mitsdoerffer M et al. Proinflammatory T helper type 17 cells are effective B-cell helpers. Proc Natl Acad Sci U S A 107, 14292–14297 (2010). [DOI] [PMC free article] [PubMed] [Google Scholar]
- 43.Hirota K et al. Plasticity of Th17 cells in Peyer’s patches is responsible for the induction of T cell-dependent IgA responses. Nat Immunol 14, 372–379 (2013). [DOI] [PMC free article] [PubMed] [Google Scholar]
- 44.Ding Y et al. IL-17RA is essential for optimal localization of follicular Th cells in the germinal center light zone to promote autoantibody-producing B cells. J Immunol 191, 1614–1624 (2013). [DOI] [PMC free article] [PubMed] [Google Scholar]
- 45.Sonder SU et al. IL-17-induced NF-kappaB activation via CIKS/Act1: physiologic significance and signaling mechanisms. J Biol Chem 286, 12881–12890 (2011). [DOI] [PMC free article] [PubMed] [Google Scholar]
- 46.Okuma A et al. Enhanced apoptosis by disruption of the STAT3-IkappaB-zeta signaling pathway in epithelial cells induces Sjogren’s syndrome-like autoimmune disease. Immunity 38, 450–460 (2013). [DOI] [PubMed] [Google Scholar]
- 47.Nogai H et al. IkappaB-zeta controls the constitutive NF-kappaB target gene network and survival of ABC DLBCL. Blood 122, 2242–2250 (2013). [DOI] [PubMed] [Google Scholar]
- 48.Mauro C et al. NF-kappaB controls energy homeostasis and metabolic adaptation by upregulating mitochondrial respiration. Nat Cell Biol 13, 1272–1279 (2011). [DOI] [PMC free article] [PubMed] [Google Scholar]
- 49.Johnson RF, Witzel II & Perkins ND p53-dependent regulation of mitochondrial energy production by the RelA subunit of NF-kappaB. Cancer Res 71, 5588–5597 (2011). [DOI] [PMC free article] [PubMed] [Google Scholar]
- 50.Sommermann TG, O’Neill K, Plas DR & Cahir-McFarland E IKKbeta and NF-kappaB transcription govern lymphoma cell survival through AKT-induced plasma membrane trafficking of GLUT1. Cancer Res 71, 7291–7300 (2011). [DOI] [PMC free article] [PubMed] [Google Scholar]
Methods references:
- 51.Kumar P et al. Intestinal Interleukin-17 Receptor Signaling Mediates Reciprocal Control of the Gut Microbiota and Autoimmune Inflammation. Immunity 44, 659–671 (2016). [DOI] [PMC free article] [PubMed] [Google Scholar]
- 52.Claudio E et al. The adaptor protein CIKS/Act1 is essential for IL-25-mediated allergic airway inflammation. J Immunol 182, 1617–1630 (2009). [DOI] [PMC free article] [PubMed] [Google Scholar]
- 53.Awasthi A et al. Cutting edge: IL-23 receptor gfp reporter mice reveal distinct populations of IL-17-producing cells. J Immunol 182, 5904–5908 (2009). [DOI] [PMC free article] [PubMed] [Google Scholar]
- 54.Jin Z, Liang J, Wang J & Kolattukudy PE MCP-induced protein 1 mediates the minocycline-induced neuroprotection against cerebral ischemia/reperfusion injury in vitro and in vivo. J Neuroinflammation 12, 39 (2015). [DOI] [PMC free article] [PubMed] [Google Scholar]
- 55.Bolger AM, Lohse M & Usadel B Trimmomatic: a flexible trimmer for Illumina sequence data. Bioinformatics 30, 2114–2120 (2014). [DOI] [PMC free article] [PubMed] [Google Scholar]
- 56.Trapnell C et al. Differential gene and transcript expression analysis of RNA-seq experiments with TopHat and Cufflinks. Nat Protoc 7, 562–578 (2012). [DOI] [PMC free article] [PubMed] [Google Scholar]
Associated Data
This section collects any data citations, data availability statements, or supplementary materials included in this article.