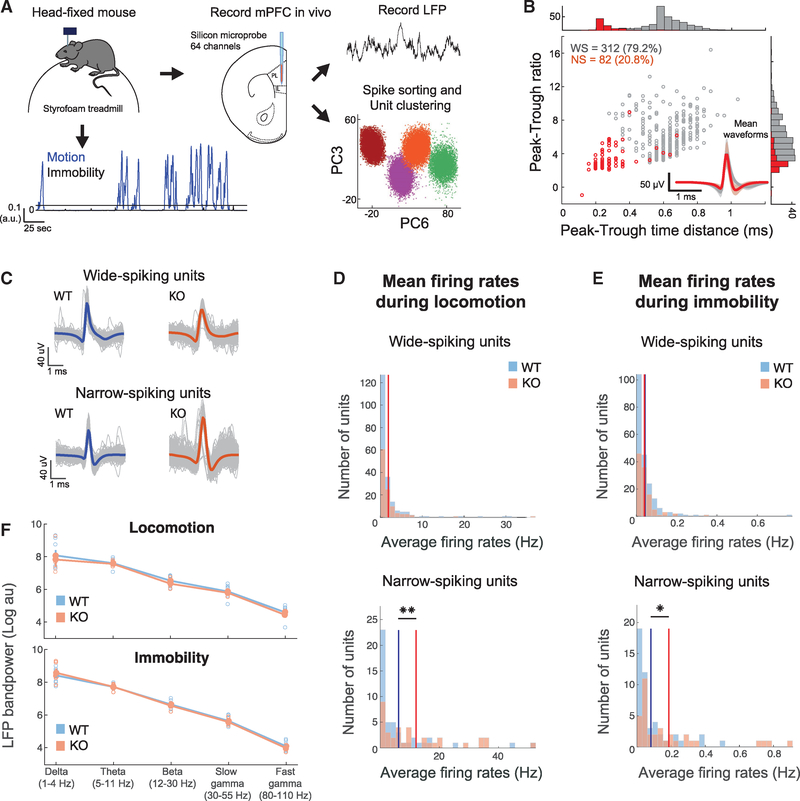
Figure 4. Increased Activity in In Vivo-Recorded Narrow-Spiking Units of Cntnap2 KO Mice, but Normal LFP Oscillations.
(A) Schematic of in vivo recordings and subsequent analysis of electrophysiological data. Mice were head fixed while free to run on a spherical treadmill. Extracellular signals were recorded from all layers of the mPFC of both WT (n = 8) and KO mice (n = 5) using multi-electrode silicon microprobes. Spikes were sorted into tentative single units methods(see Method Details). Motion on the treadmill was also recorded, and traces were separated into locomotion and immobility segments.
(B) Distribution and corresponding histograms of mean waveform peak-to-trough ratios versus peak-to-trough time distances for the two unit clusters consisting of WS and NS units. The inset depicts the average waveforms from all units in the two clusters.
(C) Unit spike waveforms averaged over all individual spikes (gray) from two example units from a WT mouse and a KO mouse.
(D and E) Distributions of average firing rates during locomotion (D) and immobility (E) for all WS and NS units in WT versus KO mice. Solid lines indicate the mean rates over all cells in the two groups. No significant difference for WS units. **p < 0.01; two-sample t test; Bonferroni corrected.
(F) Mean LFP bandpower during motion (top) and immobility (bottom) in WT and Cntnap2 KO mice, calculated from a single representative channel per mouse, located in the prelimbic mPFC. No significant differences were observed (p > 0.05, Wilcoxon test).
All errors bars indicate the SEM.

