

Abtract
Tau is a microtubule‐associated protein (MAP) that is localized to the axon. In Alzheimer's disease (AD), the distribution of tau undergoes a remarkable alteration, leading to the formation of tau inclusions in the somatodendritic compartment. While the abnormal aggregated tau has been extensively studied in human patient tissues and animal models of AD, how normal tau localizes to the axon, which would be the foundation to understand how the mis‐localization occurs, has not been well studied due to the poor detectability of normal unaggregated tau in vivo. Therefore, we developed immunohistochemical techniques that can detect normal mouse and human tau in brain tissues with high sensitivity. Using these techniques, we demonstrate the global distribution of tau in the mouse brain and confirmed that normal tau is exclusively localized to the axonal compartment in vivo. Interestingly, tau antibodies strongly labeled nonmyelinated axons such as hippocampal mossy fibers, while white matters generally exhibited low levels of immunoreactivity. Furthermore, mouse tau is highly expressed not only in neurons but also in oligodendrocytes. With super resolution imaging using the stimulated‐depletion microscopy, axonal tau appeared punctate rather than fibrous, indicating that tau decorates microtubules sparsely. Co‐labeling with presynaptic and postsynaptic markers revealed that normal tau is not localized to synapses but sparsely distributes in the axon. Taken together, this study reports novel antibodies to investigate the localization and mis‐localization of tau in vivo and novel findings of normal tau localization in the mouse brain.
Keywords: axon, localization, microtubule, RRID:AB_10711040, RRID:AB_1281142, RRID:AB_2028812, RRID:AB_2157541, RRID:AB_223648, RRID:AB_2314906, RRID:AB_305869, RRID:AB_397999, RRID:AB_441973, RRID:AB_477193, RRID:AB_530937, RRID:AB_839504, RRID:AB_887878, RRID:AB_922392, RRID:AB_94855, RRID:AB_94944, STED, tau
1. INTRODUCTION
Tau is a microtubule (MT)‐associated protein that is preferentially expressed in neuronal cells; within neurons, tau is exclusively expressed in axons. Tau is also known to be a component of the paired helical filament that is found in neurofibrillary tangles (NFTs) or neuropil threads in “tauopathies,” including Alzheimer's disease (AD) (Johnson & Jenkins, 1999). Both pathological evidence, which indicates a strong correlation between the formation of tau pathologies and neuronal degeneration (Delacourte et al., 1999; Gomez‐Isla et al., 1997), and genetic evidence strongly suggest that tau can directly cause neurodegeneration and dementia (Ghetti et al., 2015).
Despite the axonal localization of tau in normal neurons, in AD and other tauopathies, tau inclusions are formed in the somatodendritic compartments of affected neurons (Braak & Braak, 1994; Kowall & Kosik, 1987). Cumulative evidence indicates that the formation of NFTs itself might not directly cause neuronal dysfunction and degeneration (Kuchibhotla et al., 2014; Miyasaka et al., 2005; Santacruz et al., 2005) and that the abnormal distribution of presumably unaggregated tau into dendrites or spines is a critical determinant for neurodegeneration (Frandemiche et al., 2014; Zempel, Thies, Mandelkow, & Mandelkow, 2010). Therefore, the abnormal distribution of tau into sites where it is not normally localized may be a key step in the pathogenesis of tauopathies (Zempel & Mandelkow, 2014).
Although several previous studies have shown the overall distribution of tau in normal brain tissues (Binder, Frankfurter, & Rebhun, 1985; Kowall & Kosik, 1987; Trojanowski, Schuck, Schmidt, & Lee, 1989; Viereck, Tucker, Binder, & Matus, 1988), the precise subcellular localization of endogenous tau and how this localization pattern changes in Tauopathy models have not yet been extensively demonstrated, presumably due to the poor antigenicity of unaggregated endogenous tau (Trojanowski et al., 1989). Therefore, we optimized procedures to reliably detect endogenous normal, unaggregated tau in brain tissues and investigated its physiological distribution in vivo unambiguously for the first time. We believe that our data would be a good foundation for future studies aiming at how axonal tau mis‐localizes to the soma and dendrites in AD and other tauopathies.
2. MATERIALS AND METHODS
2.1. Animals and human tissues
In this study, we used wild‐type nontransgenic mice, P301L tau‐transgenic mice (P301L‐Tg; [Kimura et al., 2010]), and tau knockout mice (tau‐KO; [Dawson et al., 2001]). All animal experiments were approved by the institutional animal care and use committees. Both male and female animals were used. The autopsy brain tissues were obtained from the Brain Bank for Aging Research, Tokyo Metropolitan Institute of Gerontology (TMIG), Japan (URL: www.mci.gr.jp/BrainBank/index.cgi) with written informed consents for their use in medical research from the patients or their families. Their use in this particular study was approved by the ethics committee at Doshisha University and TMIG.
2.2. Recombinant proteins
Escherichia coli expression vectors, pRK172‐0N4R human tau was provided from Dr. M. Goedert. Mouse tau cDNA corresponding to the whole sequence of 0N4R isoform was amplified from an adult mouse brain cDNA library (Takara bio Inc., Shiga, Japan). Each cDNA fragment was subcloned into NdeI‐ and EcoRI‐ digested site of pRK172 vector (Goedert & Jakes, 1990). Recombinant tau was purified as described previously (Xie et al., 2014). Briefly, expression of human or mouse 0N4R tau were induced in E. coli, BL21(DE3) by 0.5 mM of isopropyl β‐D‐1‐thiogalactopyranoside for 2 hr. Tau expressing bacteria were harvested and lysed in Homogenize buffer (50 mM PIPES, 1 mM EGTA, and 1 mM DTT [pH 6.4]) with sonication. After centrifugation at 3000g at 4°C for 10 min, the soluble fractions were applied to phosphocellulose columns (P11, Whatmann) and eluted by a stepwise gradient of 0.1 M–0.3 M NaCl. The soluble fractions were then precipitated by dialyzing against saturated ammonium sulfate and collected by ultracentrifugation at 100,000g at 2°C for 15 min. Resultant pellets were resuspended in Homogenize buffer containing 0.5 M NaCl and 2% 2‐mercaptoethanol and heated at 100°C for 5 min. Insoluble materials were removed by centrifugation at 15,000g for 15 min. The soluble heat stable fractions containing tau proteins were further fractionated using reverse‐phase HPLC with Cosmosyl Protein‐R column (Nacalai tesque). These fractions were dried and stored in −80°C. Recombinant N‐terminal fragment of MAP2 used for anti‐MAP2N production was expressed in the E. coli BL21(DE3) strain and the soluble fraction was prepared similar to tau. MAP2N fragment was purified by ammonium sulfate precipitation followed by heating at 100°C for 5 min. After centrifugation, heat stable fraction was subjected to the SDS‐PAGE. Peptide of interest was electro eluted from gel‐piece corresponding to 25 kDa. Purity and concentrations of proteins were evaluated by SDS‐PAGE followed by Coomassie Brilliant Blue staining. We verified that purity of all recombinant proteins used here were better than 95% of total protein.
2.3. Antibody production
Anti‐tauN and anti‐MAP2N rabbit polyclonal antibodies were raised against the N‐term peptide (AEPRQEFEVMEDHAGGGC) of human tau and the N‐terminal 150 amino acid fragment of recombinant human MAP2, respectively. Anti‐human tau peptide rabbit polyclonal antibody was raised against the peptide (GTYGLGDRKDQGGYTMHQGGC). Antirodent tauN (anti‐RtauN) rabbit polyclonal antibody was raised against the peptide (DTMEDHAGDYTLLQDEG) corresponding to the N‐terminal potion of mouse tau. Anti‐total tau (RTM38), anti‐human tau specific (RTM49) and anti‐mouse tau specific (RTM47) rat monoclonal antibodies were raised against purified recombinant human and mouse tau, respectively. All antibodies were screened by one site enzyme‐linked immunosorbent assay using the antigenic peptides or recombinant tau proteins. Positive clones were further screened based on their specificity to tau in immunohistochemistry and Western blotting using wild‐type, tau‐KO, and tau‐Tg mice brains (Dawson et al., 2001; Kimura et al., 2010). In this study, tissue culture media of hybridoma were used here.
2.4. Antibody dilutions
Dilutions of the antibodies for immunostaining are listed below and in Table 1; anti‐tauN, anti‐MAP2N, and anti‐RtauN (1:1000), anti‐tau12 (tau12, mouse monoclonal antibody, 1:2000, Abcam Cat# ab74137, RRID:AB_1281142), tau1 (tau1, mouse monoclonal antibody, 1:1000, Millipore Cat# MAB3420, RRID:AB_94855), anti‐MAP2 (HM2, mouse monoclonal antibody, 1:1000, Sigma‐Aldrich Cat# M4403, RRID:AB_477193), RTM49, RTM47 and RTM38 (1:300), tau5 (tau5, mouse monoclonal antibody, 1:1000, Millipore Cat# MAB361, RRID:AB_94944), BD‐anti‐tau (anti‐tau, mouse monoclonal antibody, 1:1000, BD Biosciences Cat# 610672, RRID:AB_397999), anti‐NeuN (mouse monoclonal antibody, 1:500, Abcam Cat# ab104224, RRID:AB_10711040), anti‐S100b (rabbit monoclonal antibody, 1:500, Novus Cat# NB110‐57478, RRID:AB_922392), Iba‐1 (rabbit polyclonal, 1:1000, Wako Cat# 019–19,741, RRID:AB_839504), anti‐olig2 (rabbit polyclonal, 1:500, Proteintech Group Cat# 13999‐1‐AP, RRID:AB_2157541), anti‐Drebrin (Drebrin, mouse monoclonal antibody, 1:1000, Novus Cat# NB 100–1951, RRID:AB_530937), anti‐VGlut1 (VGlut1, guinea pig polyclonal antibody, 1:1000, Synaptic Systems Cat# 135304, RRID:AB_887878), anti‐Pan‐Axonal Neurofilament maker (SMI‐312, mouse monoclonal antibody, 1:1000, Covance Research Products Inc Cat# SMI‐312R, RRID:AB_2314906), antiphosphorylated neurofilament (SMI31, 1:500, Covance Research Products Inc Cat# SMI‐31P‐100, RRID:AB_2028812), anti‐amyloid β (anti‐human amyloid β[N], rabbit polyclonal antibody, 1:500, IBL, Takasaki, Japan), AT8 (mouse monoclonal antibody, 1:200, Thermo Fisher Scientific Cat# MN1020B, RRID:AB_223648), anti‐MBP (rat monoclonal antibody, 1:200, Abcam Cat# ab7349, RRID:AB_305869) and Alexa 488‐conjugated DM1A (DM1A‐488, 1:100, Millipore Cat# 16–232, RRID:AB_441973).
Table 1.
Antibodies used in this study
| Antibody | Immunogen | Dilution | Manufacturer |
|---|---|---|---|
| RTM38 | Recombinant human tau | 1:300 | In house |
| RTM47 | Recombinant human tau | 1:300 | In house |
| RTM49 | Recombinant mouse tau | 1:300 | In house |
| Anti‐tauN | Human tau peptide, AEPRQEFEVMEDHAGGGC | 1:1,000 | In house |
| Anti‐RtauN | Mouse tau peptide, DTMEDHAGDYTLLQDEG | 1:1,000 | In house |
| tau1 | Bovine MAPs | 1:1,000 | Millipore |
| tau5 | Bovine MAPs | 1:1,000 | Millipore |
| tau12 | Human tau peptide, QEFEVMEDHAGTY | 1:2,000 | Abcam |
| BD anti‐tau | Rat tau | 1:1,000 | Becton Dickinson |
| Anti‐MAP2 N | N‐terminal 150 amino acid fragment of recombinant human MAP2 | 1:1,000 | In house |
| HM2 | 1:1,000 | Sigma‐Aldrich | |
| Anti‐NeuN | 1:500 | Abcam | |
| Anti‐S100β | 1:500 | Novus Biologicals | |
| Anti‐Iba1 | 1:1,000 | Wako Chemicals | |
| Anti‐Olig2 | 1:500 | Protein Tech | |
| Anti‐drebrin | 1:1,000 | Novus Biologicals | |
| Anti‐VGLUT1 | 1:1,000 | Synaptic Systems | |
| Anti‐MBP | 1:200 | Abcam | |
| SMI31 | 1:500 | Covance | |
| SMI‐132R | 1:1,000 | Covance |
2.5. Hypothermia induction and Western blotting
Hypothermia was induced by anesthesia as previously reported (Planel et al., 2008). Briefly, adult mice (3–6 months old) were anesthetized by intraperitoneal injections of pentobarbital (Somnopentyl, 50 mg/kg; Kyoritsu Seiyaku, Tokyo, Japan) and kept at room temperature. Mouse body temperature was monitored with a rectal probe (Thermalert TH‐5, Physitemp). After confirming that rectal temperatures drop below 30°C, the mice were subjected to the perfusion fixation as described below. Control mice were immediately perfused after anesthesia induction. For the biochemical analyses, brains were harvested and frozen in liquid nitrogen immediately after confirming that the body temperature, and stored in −80°C. The tissues were homogenized in O+ buffer and prepared the total lysates as described in previously (Planel et al., 2008). Solubilized proteins were fractioned by 10% SDS‐PAGE and electro‐transferred onto polyvinylidene difluoride membrane. After blocking by 5% skim milk in TBS‐T, the membranes were incubated with primary antibodies. Bound antibodies were detected by anti‐IgG antibodies (Jackson Immunoresearch, West Grove, PA), and developed by enhanced chemiluminescence (ECL; Amersham, Buckingham, UK).
2.6. Immunostaining of brain tissue sections
Animals were anesthetized with pentobarbital and fixed via transcardial perfusion with 4% paraformaldehyde (PFA) in phosphate buffered saline (PBS). Heads were post‐fixed in the same fixative for 48 hr at room temperature. Brains were harvested and sliced into 6 μm‐thick paraffin embedded sections or 50 μm‐thick sections using a vibrating microtome (LinearSlicer Pro7, Dosaka EM Co. Ltd, Kyoto, Japan). The formalin‐fixed human brain tissues were sliced at 50 μm‐thickness and stored in PBS. The paraffin embedded sections were deparaffinized and hydrated, and followed by blocked by 10% goat serum in Tris buffered saline (TBS; 150 mM NaCl, 50 mM Tris, pH 7.6). The sections were incubated with primary antibodies diluted in 1% BSA in TBS with 0.1% Tween 20 (TBS‐T) overnight at room temperature. After brief washing by TBS‐T, the sections were immersed in 1% BSA in TBS‐T containing biotinylated second antibodies (Vector Laboratories, Inc., Burlingame, CA). Bound antibodies were labeled by avidin and biotinylated HRP (Vectastain ABC kit; Vector Laboratories, Inc.) and developed with 3,3‐diaminobenzidine (DAB) in the presence of hydrogen peroxide. For fluorescent immunostaining of vibrating microtome sections, the tissue sections were permeabilized with methanol and blocked in 10% goat serum in PBS with 0.1% Tween 20 (PBS‐T) for 60 min. They were then incubated with primary antibodies diluted in 1% BSA‐PBS‐T for 48 to 72 hr at room temperature. After the sections were rinsed with PBS‐T, bound antibodies were visualized with secondary antibodies that were conjugated to Alexa Fluor Dyes (Thermo Fisher Scientific, Waltham, MA). The human autopsy tissue sections were stained by Sudan Black B to eliminate lipofuscin autofluorescence (Miyasaka et al., 2005; Schnell, Staines, & Wessendorf, 1999), and then immunostained as above except that the PBS was used in all procedure instead of PBS‐T. The specimens were observed under a LSM700 (Carl Zeiss Inc., Jena, Germany), a TCS SP8 LASER scanning confocal (Leica Microsystems, Wetzlar, Germany), or a Leica TCS SP8 STED (Leica Microsystems) microscope using ×10 and ×40 dry objectives and ×63 and ×100 oil objectives.
3. RESULTS
3.1. Generation and validation of novel anti‐tau antibodies
To investigate the tissue distribution of tau unambiguously, we raised anti‐tau antibodies, as most of commercially available antibodies are not sufficient to detect endogenous unaggregated tau. Therefore, we raised phosphorylation‐independent anti‐tau antibodies, namely, RTM38 and anti‐tauN (which react with both mouse and human tau), RTM49 (human tau specific), and RTM47 and anti‐rodent tauN (mouse tau specific) (Figure 1). These antibodies showed strong immunolabeling on the mossy fiber axons in the wild‐type nontransgenic (non‐Tg) or human tau transgenic mice (Figure 1a), which were absent in either tau knockout (tau‐KO) or non‐Tg mouse hippocampi. The sensitivity and specificity of these tau antibodies were also demonstrated by Western blot analysis against recombinant human and mouse tau proteins (Figure 1b).
Figure 1.

Validation of new tau antibodies. (a) Immunolabeling of endogenous mouse and exogenous human tau in the hippocampi of non‐Tg, P301L‐Tg, and tau KO mice with commercial and homemade antibodies indicated. Antibodies are categorized to those labeling both mice and human tau (anti‐total tau), specific to human tau (anti‐human tau), and selective for mouse tau (anti‐mouse tau). Anti‐total tau and anti‐mouse tau antibodies were tested against non‐Tg and tau‐KO mice for specificity. Anti‐human tau was verified using non‐Tg and P301L‐Tg mice. Scale bar, 200 μm. (b) Western blotting of recombinant mouse and human tau at different amounts. Same categorization was used as in (a). the purity and the amount of loaded proteins were indicated by the CBB staining
To demonstrate that our new antibodies are phosphorylation‐independent in immunohistochemistry, we induced hyperphosphorylation of tau in the mouse brain by applying anesthesia‐induced hypothermia to non‐Tg mice (Planel et al., 2008). This procedure has been shown to induce robust phosphorylation in multiple sites (Planel et al., 2008). We confirmed on Western blotting that the immunoreactivity of an anti‐phosphorylated tau antibody, AT8, was greatly increased in the hypothermia samples, whereas that of an anti‐phosphorylated tau antibody, tau1, was decreased (Figure 2a). RTM38 detected both higher molecular weight phosphorylated‐ and low molecular weight unphosphorylated‐tau (Figure 2a), and the total intensity of the immunoreactive bands were not different between the samples from control and hypothermic animals (Figure 2b). In contrast, the immunoreactivity of AT8 and tau1 significantly changed in these samples (Figure 2b). We then tested our antibodies on tissue staining. As expected, the immunoreactivity of tau1 was also greatly diminished in immunofluorescence staining of the hippocampus in hypothermic animals (Figure 2c). Thus, it is highly possible that tau1, which had been used for immunostaining of tau, had missed tau phosphorylated in its epitope. In contrast, RTM38 and anti‐tauN (not shown) antibodies exhibited consistent signals in both conditions. These results therefore indicate that this method can reliably visualize the distribution of tau from physiological to pathological state in tissue sections.
Figure 2.
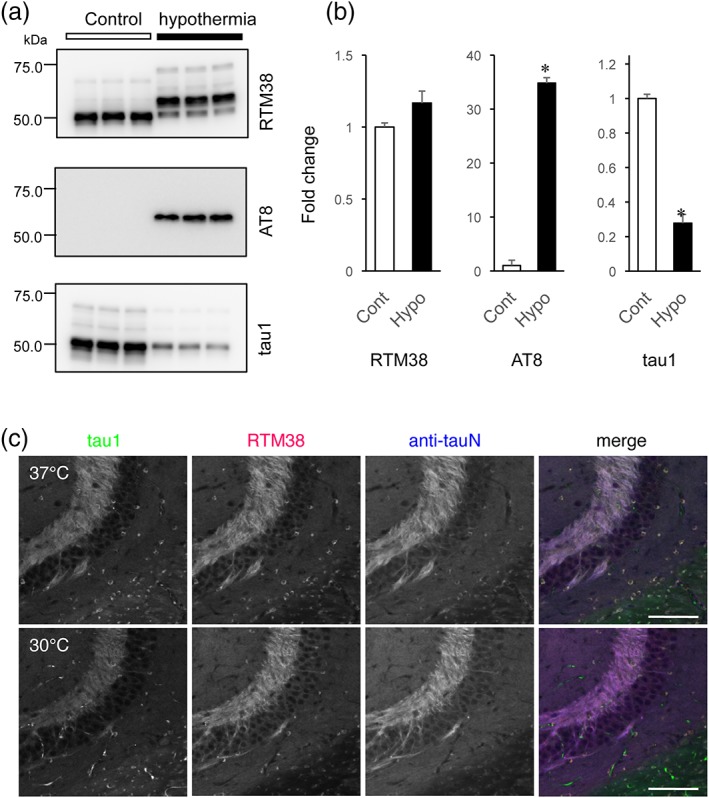
Phosphorylation‐independent detection of endogenous mouse tau with the new antibodies. (a) Western blot analysis to confirm phosphorylation of tau in hypothermic animals. To induce hyperphosphorylation of tau in the mouse brain, animals were anesthetized and kept at room temperature to induce anesthesia‐induced hypothermia. The samples were subjected to Western blotting with RTM38, AT8, and tau1 antibodies. (b) Quantification of the immunoreactive bands in (a). The optical density of the total immunoreactive bands in each blot was measured in samples from three animals in each condition, averaged, and normalized to the mean of the control samples. The mean values were compared between the control (Cont) and hypothermic (hypo) conditions using Student's t test. *p < .0001. There was no significant difference for RTM38. (c) Immunofluorescence staining of tau in the hippocampus of control and hypothermic animals. Brains of animals fixed via transcardiac perfusion were immunostained with tau‐1 (green), RTM38 (red), or anti‐tauN (blue) antibodies. Images were taken with a fixed setting for each antibody. Note that the immunoreactivity is reduced for tau‐1 after hypothermia. Scale bar, 100 μm
3.2. Overall distribution of endogenous tau in the mouse brain
Using these new antibodies, we investigated the detailed localization of endogenous mouse tau in non‐Tg mouse brains. As shown here, our new antibodies are available for the immunostaining of paraffin embedded sections. DAB immunostaining with RTM38 showed global but nonuniform tau labeling in the mouse brain (Figure 3a,b). Most regions of the brain were diffusely labeled including the cerebral cortex, thalamus, basal ganglia, and hypothalamus. However, there were several regions showing robust and fibrous labeling of tau as described below. The labeling was absent in tau knockout mouse brain sections (Figure 3a inset), confirming the specificity of the staining. We also provide a negative control without the primary antibody (Figure 3b inset).
Figure 3.

Overall distribution of endogenous tau in the mouse brain. (a) Overall expression of endogenous tau in the mouse brain revealed by DAB immunostaining with RTM38. Sagittal paraffin embedded sections from non‐Tg mice and tau‐KO mice were immunostained with RTM38. Inset, labeling of a tau‐KO mouse section with RTM38. Scale bar, 2 mm. (b) Selected coronal paraffin embedded sections immunostained with RTM38. The numbers on the top left corner indicate the relative distances from Bregma. High magnification images of the dotted boxes (i–x) are shown in Figures 5 and 6. Inset, brain section stained only with the secondary antibody without RTM38. Ob = olfactory bulb; mi = mitral cell layer; Gl = glomeruli layer; GrO = granule cell layer of olfactory bulb; Cor = cerebral cortex; CPu = caudate putamen, GP = globus pallidus; cc = corpus callosum; ac = anterior commissure; aca = anterior part of ac; acp = posterior part of ac; f = fornix; fi = fimbria; icp = internal capsule; ml = medial lemniscus; scp = superior cerebellar peduncle; st = stria terminalis; IC = inferior colliculus; SC = superior colliculus; SpC = spinal cord; Hc = hippocampus; AM = amygdala; TH = thalamus; Mb = midbrain; Cb = cerebellum; CN = cerebellar nuclei; cML = molecular layer of cerebellum; cGL = granule layer of cerebellum; wm = white matter; Po = pons; md = medulla; PAG = periaqueductal gray; Hy = hypothalamus; SN = substantia nigra; VTA = ventral tegmental area; 1N = olfactory nerve; 2N = optic nerve; 3N = oculomotor nerve; 7N = facial nerve; 4V = fourth ventricle; and LV = lateral ventricle. Scale bar, 2 mm
3.2.1. Cerebral cortex
In the cerebral cortex (Cor), superficial layers and the layer iv/v appeared to have strong immunoreactivity for tau, although other layers also have diffuse labeling (Figure 4). High magnification images show that the somata and apical dendrites are mostly devoid of tau immunoreactivity. There were numerous small cells, of which perinuclear cytoplasm was intensely labeled, in the cortex and the rest of the brain structures. We identified them as oligodendrocytes (see below).
Figure 4.

Immunostaining of tau in the cerebral cortex. (a) Tau immunostaining in the somatosensory cortex in a sagittal section. The box shows the region used in (b). Scale bar, 500 μm. (b) Magnified image of the region indicated in (a). The box shows the region used in (c). scale bar, 100 μm. (c) High magnification image of the region specified in (b). Scale bar, 25 μm
3.2.2. Hippocampus and amygdala
RTM38 intensely labeled mossy fiber axons (mf) as well as the inner molecular layer of the dentate gyrus (dML), which contains the axons of mossy cells and entorhinal cortex (Figure 5, panels iv–vi). The labeling in the stratum radiatum (rad) in the CA1 area also appeared to be axonal (see Figure 7). Layers that are composed of neuronal cell bodies, including the pyramidal cell layer of the cornu ammonis (hPCL) and the granular cell layer of the dentate gyrus (dGCL), were stained only at the background level. Amygdala was uniformly labeled at the intensity similar to that in the cerebral cortex (Figure 3).
Figure 5.

Detailed localization of endogenous tau in different brain regions: I. (i) Olfactory bulb, and olfactory nerve. Mi = mitral cell layer; Gl = glomeruli layer; GrO = granule cell layer of olfactory bulb; and 1N = olfactory nerve; Scale bar, 200 μm. (ii) Anterior commissure; Aca = anterior part of ac; and acp = posterior part of ac; (iii) Stria terminalis. CPu = caudate putamen; icp = internal capsule; sm = stria medullaris; and st = stria terminalis. (iv–vi) Hippocampus and corpus callosum. Cor = cerebral cortex; cc = corpus callosum; hPCL = hippocampal pyramidal layer; ori = stratum oriens; rad = stratum radiatum; DG = dentate gyrus; dML = dentate molecular layer; dGCL = dentate granule cell layer; and mf = mossy fiber
Figure 7.

Axonal localization of endogenous mouse tau. Axon‐specific labeling of tau (a; magenta) in the CA1 of the hippocampus. There were no signals of tau labeling above the background in the cell bodies and dendrites of CA1 pyramidal cells, which are labeled with anti‐MAP2 antibody (b; green), such that green and magenta interdigitate in the composite image (c). Scale bar, 25 μm
3.2.3. Olfactory bulb
All regions were diffusely labeled (Figure 3b). Among them, the glomerular (Gl) and the mitral/internal plexiform layers (Mi) were most strongly labeled (Figure 5, panel i).
3.2.4. Stria terminalis and internal capsule
There was strong fibrous labeling at the interface between the striatum and the thalamus (Figure 5, panel iii, and Figure 6, panel vii). It appeared to be stria terminalis (st), which is a major tract connecting amygdala and nuclei in hypothalamic area. Bed nuclei of the stria terminalis (BST in Figure 3) were also strongly labeled. The adjacent internal capsule (ic) exhibited weak, sparse, and fibrous labeling.
Figure 6.

Detailed localization of endogenous tau in different brain regions: II. (vii) St = stria terminalis; ic = internal capsule; and CPu = caudate putamen; also fi (including fimbria). (viii) Ventral part of the midbrain. VTA = ventral tegmental area; ml = medial lemniscus; scp = superior cerebellar peduncle; and 3N = oculomotor nerve. Scale bar, 200 μm. (ix) Cerebellum. cML = molecular layer of cerebellum; cPL = Purkinje cell layer; cGL = granule layer of cerebellum; and wm = white matter. (x) Ventral part of the medulla. Tz = trapezoidal body; py = pyramidal tract; and 7N = facial nerve
3.2.5. Ventral tegmental area
Ventral tegmental area (VTA) showed relatively strong immunoreactivity compared to neighboring structures (Figure 3b). The staining appeared fibrous (Figure 6, panel viii).
3.2.6. Cerebellum
In the cerebellum, the molecular layer (cML), but not the Purkinje cell (PCL) and granule cell layers (cGCL), was intensely labeled. Dendrites of Purkinje cells were not labeled (Figure 6, panel ix), indicating the axon‐specific labeling of tau in the molecular layer. The white matter exhibited weak labeling.
3.2.7. Anterior commissure and corpus callosum
The anterior part of the anterior commissure (aca) showed only very weak labeling (Figure 5, panel ii). However, the posterior part (acp) exhibited rather strong immunoreactivity, which also appeared fibrous. There was also some heterogeneity of tau labeling in the corpus callosum (Figure 4). Medial and ventral regions of corpus callosum (cc) were most strongly labeled, whereas the anterior and dorsal sides were marginally stained. We found that tau labeling was most intense where no myelin basic protein (MBP)‐positive axons are (see Figure 8).
Figure 8.
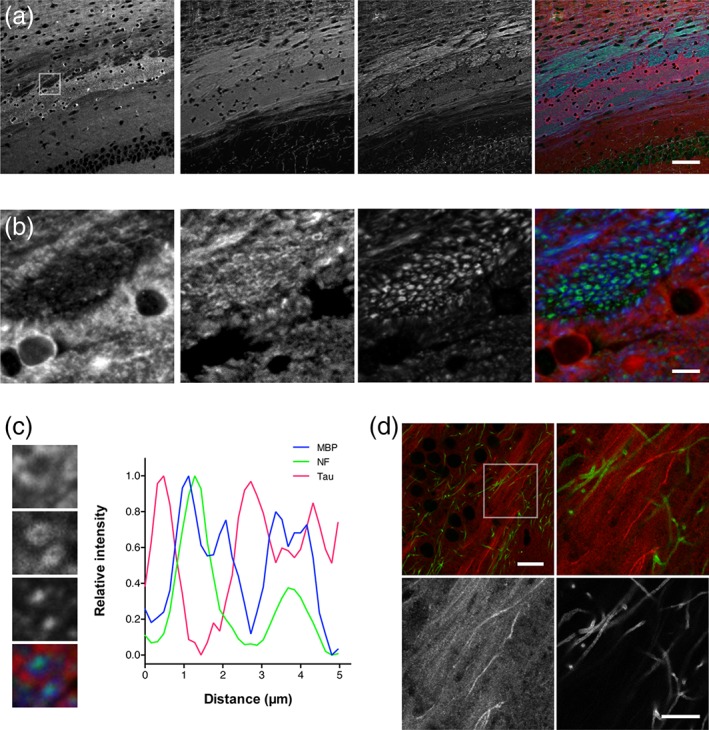
Distribution of tau immunoreactivity in the corpus callosum and the hippocampal mossy fiber. (a) Immunolabeling in the corpus callosum with SMI31 for neurofilament (green), anti‐RtauN (red) and anti‐myelin basic protein (MBP) antibody (blue). Tau labeling was found mostly on MBP‐negative axons. The box indicates the area used for the high magnification images in (b). Scale bar, 50 μm. (b) Higher magnification images of the area indicated in (a). Scale bar, 10 μm. (c) Line scan analysis of the immunofluorescence signals in the corpus callosum. High magnification images of the area rich in tau (red) with myelinated axons positive for MBP (blue) and neurofilament (green) are shown in the left panels. Fluorescence intensity over a line crossing the two MBP‐positive axons were plotted against the distance. (d) Labeling of tau (red) and MBP (green) in the hippocampal dentate gyrus. The box in the top left image indicates the area shown in the rest of the panels in a higher magnification. Scale bars, 20 μm (top left) and 10 μm (bottom right)
3.2.8. Other fiber tracts
Most of the cranial nerves we examined including the olfactory (1N), optic (2N), and oculomotor nerves (3N) were only weakly labeled. Spinal tract of the trigeminal nerve (sp5), cerebellar peduncle (cp), inferior cerebellar peduncle (icp), pyramidal tract (py), and medial lemniscus (ml) were also faint in tau labeling (Figure 3 and Figure 6, panel x).
3.3. Tau labeling in myelinated and nonmyelinated axons
We confirmed that tau did not co‐localize with MAP2, which is a dendritic MT‐associated protein, evident in the hippocampal CA1, and that they were separately distributed in the axonal and somatodendritic compartments of adult neurons, respectively (Figure 7) (Dehmelt & Halpain, 2005; Deshpande, Win, & Busciglio, 2008; Xie & Miyasaka, 2016). As described earlier, tau immunoreactivity was evident in regions rich in nonmyelinated axons such as the hippocampal mossy fiber and the cerebellar molecular layer. In contrast, the staining was relatively poor and sparse in white matters, including the corpus callosum (cc), fornix (f), anterior commissure (ac), and the white matter of the cerebellum (Cb) (Figure 3a). Furthermore, triple labeling of the corpus callosum with anti‐tauN and antibodies for MBP and neurofilament revealed that tau is most abundant in areas where MBP and neurofilament immunoreactivity are relatively weak (Figure 8a,b). High magnification views and line scan analysis of fluorescence intensity further revealed that tau immunoreactivity was poor on MBP‐positive axons containing neurofilaments (Figure 8c). This was also evident in the hippocampal CA3. MBP‐positive axons in the area were virtually void of tau immunoreactivity, while the neighboring mossy fiber axons, which are nonmyelinated, are strongly labeled (Figure 8d).
3.4. Expression of mouse tau in glial cells
We also addressed tau expression in glial cells, which has been implicated previously (LoPresti, Szuchet, Papasozomenos, Zinkowski, & Binder, 1995; Seiberlich et al., 2015). In consistent with these reports, our anti‐mouse tau antibodies labeled small cells in the hippocampus (Figure 5), in which most of the signal was observed in the cytoplasm. These cells are not neurons, as they were negative for NeuN (data not shown). We therefore labeled each class of glial cells using antibodies for well‐known glial markers, S100β for astrocytes, Iba‐1 for microglia, and Olig‐2 for oligodendrocytes. Anti‐S100β and Iba‐1 antibodies labeled respective glial cells in the hippocampal CA3 area but not those positive for tau (Figure 9a,b). Only the anti‐Olig‐2 antibody labeled the nuclei of cells, of which cytoplasm was positive for tau (Figure 9c,d). Virtually all tau positive nonneuronal cells were positive for Olig‐2 throughout the brain regions we investigated including cerebral cortex, corpus callosum, internal capsule, anterior commissure, cerebellum, and medulla oblongata (data not shown). These results indicate that the endogenous tau is abundantly expressed in the cell bodies of oligodendrocytes, but not in astrocyte and microglia in the mouse brain.
Figure 9.

Glial expression of endogenous tau in the mouse brain. (a–c) Tau expression in glial cells. The CA3 region of the hippocampus was labeled by RTM38 (green) with cell lineage markers (magenta), anti‐S100β (a), Iba‐1 (b), or anti‐olig2 (c). Scale bar, 20 μm. (d) Wider view of the CA3 region containing the fimbria, where oligodendrocytes are abundant. Scale bar, 50 μm
3.5. Nondendritic and nonsynaptic localization of tau in the hippocampus
We also found that the tau immunoreactivity appeared punctate, particularly in the stratum radiatum of the hippocampal CA1 area (Figure 7a), suggesting that tau may colocalize with synapses, as previously postulated (Ittner et al., 2010; Zempel et al., 2010). To test potential peri‐synaptic localization of endogenous tau, we therefore examined the localization of tau in the brains of Thy1‐EGFP mice (Feng et al., 2000). In these mice, dendritic spines in individual neurons can be easily identified because of the sparse EGFP expression. Triple labeling of EGFP, tau, and MAP2 combined with line scan analyses confirmed that punctate tau immunoreactivity was scattered around dendritic spines but was never found within them (Figure 10a). Tau did not colocalize with drebrin or VGlut1, which are markers for spines and presynaptic terminals, respectively. This punctate axonal and peri‐synaptic localization of tau was also confirmed in the human hippocampus using our anti‐human tau antibodies (Figure 10b). Thus, in physiological condition, tau is localized within the axonal compartment in small clusters.
Figure 10.

Nonsynaptic labeling of endogenous tau in the mouse and human brains. (a) Dendritic spines were visualized using the hippocampus of the M‐line mouse, in which a small population of pyramidal neurons expresses EGFP. This cell‐fill dye highlighted the gross morphology of these neurons including their dendrites and spines (pseudo‐colored in red). Dendrites, spines, and presynaptic terminals were also labeled using anti‐MAP2, an antibody against a spine marker drebrin, and VGluT1 immunolabeling (blue in each panel), along with immunostaining of endogenous mouse tau using anti‐tauN (green). Normalized intensity profiles along the lines in the left panels are shown in the right panels and indicate that tau labeling does not overlap with any synaptic or dendritic markers. Scale bar: 2.5 μm. (b) Endogenous tau in the human hippocampus. (a) Strong anti‐tauN labeling was found in mf in CA3, whereas only faint signals were detected in dGCL of the dentate gyrus of human hipocampus. (b–e) Tau (RTM49; green), drebrin (blue), and MAP2 (anti‐MAP2N; red) labeling are shown. Note that tau labeling did not colocalize with the other markers. Scale bar, 5 μm (for b–e)
3.6. Discontinuous distribution of endogenous tau on the microtubules of axons
The punctate labeling of axonal tau was surprising for a MAP, which is expected to decorate the entire MT and appear fibrous under light microscopy. We therefore investigated the localization of tau at a super‐resolution (~50 nm) using the stimulated emission depletion (STED) microscopy (Tonnesen & Nagerl, 2013) to test whether tau is distributed sparsely on axonal MTs. Immunofluorescence staining of the hippocampal CA3 with anti‐tauN and anti‐tubulin (DM1A) antibodies showed overlapping but not colocalizing distribution of these proteins in mossy fiber axons, but not in apical dendrites of CA3 pyramidal neurons, under confocal microscopy (Figure 11a). With STED, tau labeling appeared more punctate and sparsely distributed on tubulin labeling (Figure 11a). The mossy fiber axons in CA3 have a diameter of 200–500 nm and are typically packed with several MTs observable with electron microscopy (Amaral, Scharfman, & Lavenex, 2007). Despite this density of MTs, tau labeling did not appear fibrous but punctate even in these axons (Figure 11b). This unique labeling was reproduced using the RTM38 antibody, of which epitope differs from that of anti‐tauN and is in the C‐terminal region of tau (data not shown). Therefore, the sparse labeling of endogenous tau may not be due to epitope masking. Considering that tubulins constituting MTs are far more abundant than tau in neurons and even in axons (Miyasaka et al., 2018), these data indicate that endogenous tau localized in the axon does not occupy all the binding sites of axonal MTs in the mouse brain.
Figure 11.

High‐resolution imaging of tau in the hippocampal region of non‐Tg mouse brains. (a) Hippocampal CA3 (D–F) was labeled with DM1A (magenta) for tubulin and anti‐tauN (green) and imaged using confocal and STED microscopy. The asterisk indicates an apical dendrite of a CA3 pyramidal neuron. Scale bar, 5 μm. (b) High magnification STED image of the mossy fiber axons. Scale bar, 2 μm
4. DISCUSSION
Previous studies of tau focused mostly on abnormal aggregated tau, and those investigating normal tau in vivo have been scarce (Iqbal, Liu, & Gong, 2016). The major issue was the lack of immunological reagents sensitive enough to detect nonaggregated tau, as well as those specific for human and mouse tau individually, in animal models. We therefore developed several antibodies which can detect human or mouse tau separately, or both at high sensitivity in brain tissues, regardless of their phosphorylation states. Using these immunological reagents, we studied the overall distribution of mouse tau and its subcellular distribution in detail even at super‐resolution levels. Surprisingly, we found that endogenous tau was readily detectable in nonmyelinated axons but poorly stained in myelinated axons in the white matter and cranial nerves. Although we cannot fully exclude the possibility of antigen hindrance, these results may suggest that tau plays some critical roles in nonmyelinated axons. In support of this notion, the decreased number and density of microtubules in unmyelinated cerebellar parallel fibers of tau‐KO mice have been reported (Harada et al., 1994). It is of great interest that such tau‐rich neurons, for example, granule cells in dentate gyrus or cerebellum, or inversely, a group of neurons in which tau is almost not detected, such as primary motor neurons, are relatively resistant to AD. Inverse association between the degree of myelination and propensity of NFT formation in AD brains had been proposed (Braak, Del Tredici, Schultz, & Braak, 2000).
While tau is predominantly expressed in neurons, it has been shown that glial cells also express tau at low levels. Particularly, oligodendrocytes in culture exhibit modest expression of tau (LoPresti et al., 1995; Seiberlich et al., 2015). Pathological findings that tau depositions in glial cells are found in several forms of non‐AD tauopathies (Ferrer et al., 2014) also indicate its expression and function in glia. However, the evidence whether tau is expressed in vivo in which type of glial cells has been very scarce (LoPresti et al., 1995). Without this knowledge, we are not able to understand the physiological significance of glial tau and the pathological mechanism leading to the tau deposition in glia. In this article, we showed that our new antibodies can reliably detect both neuronal and glial tau in the same tissue sections without any special fixation or treatment. We found that tau is abundantly expressed in oligodendrocytes but not detectable in astrocytes and microglia in normal brain tissues. These techniques and results would be useful in studying the role of glial tau in normal and how tau accumulates in other glial cells, which do not express tau at detectable levels in normal, during the pathogenesis of Tauopathy.
With our sensitive antibodies, we were also able to image normal tau at a super‐resolution level using STED in brain tissues for the first time. We showed here that tau is not distributed uniformly within a thin mossy fiber axon, which has dense MTs that can be demonstrated with electron microscopy (data not shown). Instead, in STED imaging, tau appeared to be situated sparsely, separated by more than 200 nm. This indicates that endogenous tau does not saturate binding sites on MTs in the axon in vivo. Or, tau may accumulate on specific spots on axonal MTs, rather than decorating MTs uniformly, which has been observed in vitro. Kar et al. reported that the functional interaction of tau with MTs is different when tau binds to pre‐assembled MTs or co‐assembles into MTs with tubulins (Kar, Fan, Smith, Goedert, & Amos, 2003). Axonal tau might be incorporated into axonal MTs in an ordered fashion rather than simply bound on them. Further studies are necessary to fully understand the nature of MT binding of tau in the axon in vivo and how it changes in tauopathies.
Synaptic expression of tau has been suggested in previous studies. In animal models overexpressing human tau, the exogenous tau is probably expressed in dendritic spines and impairs the postsynaptic function (Hoover et al., 2010; Ittner et al., 2010), indicating the pathological significance of synaptic tau. However, it has not been fully addressed whether endogenous tau localizes to dendritic spines in normal conditions. With our sensitive antibodies, we were able to detect endogenous tau in mouse and human brains, in which dendritic spines are clearly visible. Although tau is readily detectable around dendritic spines as puncta, it never overlaps with dendritic, presynaptic, and postsynaptic markers. These results suggest that tau is not expressed in synapses in normal brains. As tau is mis‐localized to the soma and dendrites in neurons affected in Tauopathy, tau may distribute to dendritic spines under these pathological situations and affect the synaptic function.
In summary, this study provides useful immunological reagents and methods to detect endogenous tau in normal brains, and the first comprehensive analysis of tau localization in vivo. Our new methods would allow researchers to investigate how normal tau becomes pathological and to test new hypotheses of the pathogenesis of Tauopathy.
ACKNOWLEDGMENT
This work was supported in part by the Grant‐in‐Aid for Scientific Research on Innovative Areas “Brain Protein Aging and Dementia Control” (T.M. 26117004)., the “Integrated research on neuropsychiatric disorder”, which was carried out under the Strategic Research Program for Brain Sciences (T.M. and Y.I.), a grant from the Mitsubishi Foundation (T.M.), and the JSPS KAKENHI Grant Numbers 22650074 (T.M.) and 26640030 (A.K.). The authors declare no competing financial interests.
Kubo A, Misonou H, Matsuyama M, et al. Distribution of endogenous normal tau in the mouse brain. J Comp Neurol. 2019;527:985–998. 10.1002/cne.24577
Funding information Japan Society for the Promotion of Science (JSPS) KAKENHI, Grant/Award Numbers: JP22650074, JP26117004, JP26640030; Strategic Research Program for Brain Sciences from Japan Agency for Medical Research and development (AMED); Mitsubishi Foundation, Grant/Award Number: 29146
REFERENCES
- Amaral, D. G. , Scharfman, H. E. , & Lavenex, P. (2007). The dentate gyrus: Fundamental neuroanatomical organization (dentate gyrus for dummies). Progress in Brain Research, 163, 3–22. [DOI] [PMC free article] [PubMed] [Google Scholar]
- Binder, L. I. , Frankfurter, A. , & Rebhun, L. I. (1985). The distribution of tau in the mammalian central nervous system. The Journal of Cell Biology, 101(4), 1371–1378. [DOI] [PMC free article] [PubMed] [Google Scholar]
- Braak, H. , & Braak, E. (1994). Morphological criteria for the recognition of Alzheimer's disease and the distribution pattern of cortical changes related to this disorder. Neurobiology of Aging, 15(3), 355–356 discussion 379‐380. [DOI] [PubMed] [Google Scholar]
- Braak, H. , Del Tredici, K. , Schultz, C. , & Braak, E. (2000). Vulnerability of select neuronal types to Alzheimer's disease. Annals of the New York Academy of Sciences, 924, 53–61. [DOI] [PubMed] [Google Scholar]
- Dawson, H. N. , Ferreira, A. , Eyster, M. V. , Ghoshal, N. , Binder, L. I. , & Vitek, M. P. (2001). Inhibition of neuronal maturation in primary hippocampal neurons from tau deficient mice. Journal of Cell Science, 114(Pt 6), 1179–1187. [DOI] [PubMed] [Google Scholar]
- Dehmelt, L. , & Halpain, S. (2005). The MAP2/tau family of microtubule‐associated proteins. Genome Biology, 6(1), 204. [DOI] [PMC free article] [PubMed] [Google Scholar]
- Delacourte, A. , David, J. P. , Sergeant, N. , Buee, L. , Wattez, A. , Vermersch, P. , … Di Menza, C. (1999). The biochemical pathway of neurofibrillary degeneration in aging and Alzheimer's disease. Neurology, 52(6), 1158–1165. [DOI] [PubMed] [Google Scholar]
- Deshpande, A. , Win, K. M. , & Busciglio, J. (2008). Tau isoform expression and regulation in human cortical neurons. FASEB Journal: Official Publication of the Federation of American Societies for Experimental Biology, 22(7), 2357–2367. [DOI] [PubMed] [Google Scholar]
- Feng, G. , Mellor, R. H. , Bernstein, M. , Keller‐Peck, C. , Nguyen, Q. T. , Wallace, M. , … Sanes, J. R. (2000). Imaging neuronal subsets in transgenic mice expressing multiple spectral variants of GFP. Neuron, 28(1), 41–51. [DOI] [PubMed] [Google Scholar]
- Ferrer, I. , Lopez‐Gonzalez, I. , Carmona, M. , Arregui, L. , Dalfo, E. , Torrejon‐Escribano, B. , … Kovacs, G. G. (2014). Glial and neuronal tau pathology in tauopathies: Characterization of disease‐specific phenotypes and tau pathology progression. Journal of Neuropathology and Experimental Neurology, 73(1), 81–97. [DOI] [PubMed] [Google Scholar]
- Frandemiche, M. L. , De Seranno, S. , Rush, T. , Borel, E. , Elie, A. , Arnal, I. , … Buisson, A. (2014). Activity‐dependent tau protein translocation to excitatory synapse is disrupted by exposure to amyloid‐beta oligomers. The Journal of Neuroscience : The Official Journal of the Society for Neuroscience, 34(17), 6084–6097. [DOI] [PMC free article] [PubMed] [Google Scholar]
- Ghetti, B. , Oblak, A. L. , Boeve, B. F. , Johnson, K. A. , Dickerson, B. C. , & Goedert, M. (2015). Invited review: Frontotemporal dementia caused by microtubule‐associated protein tau gene (MAPT) mutations: A chameleon for neuropathology and neuroimaging. Neuropathology and Applied Neurobiology, 41(1), 24–46. [DOI] [PMC free article] [PubMed] [Google Scholar]
- Goedert, M. , & Jakes, R. (1990). Expression of separate isoforms of human tau protein: Correlation with the tau pattern in brain and effects on tubulin polymerization. The EMBO Journal, 9(13), 4225–4230. [DOI] [PMC free article] [PubMed] [Google Scholar]
- Gomez‐Isla, T. , Hollister, R. , West, H. , Mui, S. , Growdon, J. H. , Petersen, R. C. , … Hyman, B. T. (1997). Neuronal loss correlates with but exceeds neurofibrillary tangles in Alzheimer's disease. Annals of Neurology, 41(1), 17–24. [DOI] [PubMed] [Google Scholar]
- Harada, A. , Oguchi, K. , Okabe, S. , Kuno, J. , Terada, S. , Ohshima, T. , … Hirokawa, N. (1994). Altered microtubule organization in small‐calibre axons of mice lacking tau protein. Nature, 369(6480), 488–491. [DOI] [PubMed] [Google Scholar]
- Hoover, B. R. , Reed, M. N. , Su, J. , Penrod, R. D. , Kotilinek, L. A. , Grant, M. K. , … Liao, D. (2010). Tau mislocalization to dendritic spines mediates synaptic dysfunction independently of neurodegeneration. Neuron, 68(6), 1067–1081. [DOI] [PMC free article] [PubMed] [Google Scholar]
- Iqbal, K. , Liu, F. , & Gong, C. X. (2016). Tau and neurodegenerative disease: The story so far. Nature Reviews Neurology, 12(1), 15–27. [DOI] [PubMed] [Google Scholar]
- Ittner, L. M. , Ke, Y. D. , Delerue, F. , Bi, M. , Gladbach, A. , van Eersel, J. , … Gotz, J. (2010). Dendritic function of tau mediates amyloid‐beta toxicity in Alzheimer's disease mouse models. Cell, 142(3), 387–397. [DOI] [PubMed] [Google Scholar]
- Johnson, G. V. , & Jenkins, S. M. (1999). Tau protein in normal and Alzheimer's disease brain. Journal of Alzheimer's disease, 1(4–5), 307–328. [DOI] [PubMed] [Google Scholar]
- Kar, S. , Fan, J. , Smith, M. J. , Goedert, M. , & Amos, L. A. (2003). Repeat motifs of tau bind to the insides of microtubules in the absence of taxol. The EMBO Journal, 22(1), 70–77. [DOI] [PMC free article] [PubMed] [Google Scholar]
- Kimura, T. , Fukuda, T. , Sahara, N. , Yamashita, S. , Murayama, M. , Mizoroki, T. , … Takashima, A. (2010). Aggregation of detergent‐insoluble tau is involved in neuronal loss but not in synaptic loss. The Journal of Biological Chemistry, 285(49), 38692–38699. [DOI] [PMC free article] [PubMed] [Google Scholar]
- Kowall, N. W. , & Kosik, K. S. (1987). Axonal disruption and aberrant localization of tau protein characterize the neuropil pathology of Alzheimer's disease. Annals of Neurology, 22(5), 639–643. [DOI] [PubMed] [Google Scholar]
- Kuchibhotla, K. V. , Wegmann, S. , Kopeikina, K. J. , Hawkes, J. , Rudinskiy, N. , Andermann, M. L. , … Hyman, B. T. (2014). Neurofibrillary tangle‐bearing neurons are functionally integrated in cortical circuits in vivo. Proceedings of the National Academy of Sciences of the United States of America, 111(1), 510–514. [DOI] [PMC free article] [PubMed] [Google Scholar]
- LoPresti, P. , Szuchet, S. , Papasozomenos, S. C. , Zinkowski, R. P. , & Binder, L. I. (1995). Functional implications for the microtubule‐associated protein tau: Localization in oligodendrocytes. Proceedings of the National Academy of Sciences of the United States of America, 92(22), 10369–10373. [DOI] [PMC free article] [PubMed] [Google Scholar]
- Miyasaka, T. , Ding, Z. , Gengyo‐Ando, K. , Oue, M. , Yamaguchi, H. , Mitani, S. , & Ihara, Y. (2005). Progressive neurodegeneration in C. elegans model of tauopathy. Neurobiology of Disease, 20(2), 372–383. [DOI] [PubMed] [Google Scholar]
- Miyasaka, T. , Shinzaki, Y. , Yoshimura, S. , Yoshina, S. , Kage‐Nakadai, E. , Mitani, S. , & Ihara, Y. (2018). Imbalanced expression of tau and tubulin induces neuronal dysfunction in C. elegans models of Tauopathy. Frontiers in Neuroscience, 12, 415. [DOI] [PMC free article] [PubMed] [Google Scholar]
- Planel, E. , Krishnamurthy, P. , Miyasaka, T. , Liu, L. , Herman, M. , Kumar, A. , … Duff, K. E. (2008). Anesthesia‐induced hyperphosphorylation detaches 3‐repeat tau from microtubules without affecting their stability in vivo. The Journal of Neuroscience: The Official Journal of the Society for Neuroscience, 28(48), 12798–12807. [DOI] [PMC free article] [PubMed] [Google Scholar]
- Santacruz, K. , Lewis, J. , Spires, T. , Paulson, J. , Kotilinek, L. , Ingelsson, M. , … Ashe, K. H. (2005). Tau suppression in a neurodegenerative mouse model improves memory function. Science, 309(5733), 476–481. [DOI] [PMC free article] [PubMed] [Google Scholar]
- Schnell, S. A. , Staines, W. A. , & Wessendorf, M. W. (1999). Reduction of lipofuscin‐like autofluorescence in fluorescently labeled tissue. The Journal of Histochemistry and Cytochemistry, 47(6), 719–730. [DOI] [PubMed] [Google Scholar]
- Seiberlich, V. , Bauer, N. G. , Schwarz, L. , Ffrench‐Constant, C. , Goldbaum, O. , & Richter‐Landsberg, C. (2015). Downregulation of the microtubule associated protein tau impairs process outgrowth and myelin basic protein mRNA transport in oligodendrocytes. Glia, 63(9), 1621–1635. [DOI] [PubMed] [Google Scholar]
- Tonnesen, J. , & Nagerl, U. V. (2013). Superresolution imaging for neuroscience. Experimental Neurology, 242, 33–40. [DOI] [PubMed] [Google Scholar]
- Trojanowski, J. Q. , Schuck, T. , Schmidt, M. L. , & Lee, V. M. (1989). Distribution of tau proteins in the normal human central and peripheral nervous system. The Journal of Histochemistry and Cytochemistry, 37(2), 209–215. [DOI] [PubMed] [Google Scholar]
- Viereck, C. , Tucker, R. P. , Binder, L. I. , & Matus, A. (1988). Phylogenetic conservation of brain microtubule‐associated proteins MAP2 and tau. Neuroscience, 26(3), 893–904. [DOI] [PubMed] [Google Scholar]
- Xie, C. , & Miyasaka, T. (2016). The role of the carboxyl‐terminal sequence of tau and MAP2 in the pathogenesis of dementia. Frontiers in Molecular Neuroscience, 9, 158. [DOI] [PMC free article] [PubMed] [Google Scholar]
- Xie, C. , Miyasaka, T. , Yoshimura, S. , Hatsuta, H. , Yoshina, S. , Kage‐Nakadai, E. , … Ihara, Y. (2014). The homologous carboxyl‐terminal domains of microtubule‐associated protein 2 and TAU induce neuronal dysfunction and have differential fates in the evolution of neurofibrillary tangles. PLoS One, 9(2), e89796. [DOI] [PMC free article] [PubMed] [Google Scholar]
- Zempel, H. , & Mandelkow, E. (2014). Lost after translation: Missorting of tau protein and consequences for Alzheimer disease. Trends in Neurosciences, 37(12), 721–732. [DOI] [PubMed] [Google Scholar]
- Zempel, H. , Thies, E. , Mandelkow, E. , & Mandelkow, E. M. (2010). Abeta oligomers cause localized Ca(2+) elevation, missorting of endogenous tau into dendrites, tau phosphorylation, and destruction of microtubules and spines. The Journal of Neuroscience: The Official Journal of the Society for Neuroscience, 30(36), 11938–11950. [DOI] [PMC free article] [PubMed] [Google Scholar]