

Abstract
How the brain converts parallel representations of movement goals into sequential movements is not known. We tested the role of basal ganglia (BG) in the temporal control of movement sequences by a convergent approach involving inactivation of the BG by muscimol injections into the caudate nucleus of monkeys and assessing behavior of Parkinson's disease patients, performing a modified double-step saccade task. We tested a critical prediction of a class of competitive queuing models that explains serial behavior as the outcome of a selection of concurrently activated goals. In congruence with these models, we found that inactivation or impairment of the BG unmasked the parallel nature of goal representations such that a significantly greater extent of averaged saccades, curved saccades, and saccade sequence errors were observed. These results suggest that the BG perform a form of competitive queuing, holding the second movement plan in abeyance while the first movement is being executed, allowing the proper temporal control of movement sequences.
Introduction
The execution of most actions entails sequential movements organized in an appropriate order. Because actions can be performed even in the absence of sensory feedback (Keele, 1968), movement sequences are thought to be preplanned before the initial movement begins (Lashley, 1951). In support of this view, neurons in different cortical areas can generate simultaneous representations of forthcoming sequential movements (Barone and Joseph, 1989; Funahashi et al., 1997; Averbeck et al., 2002; Mushiake et al., 2006). Natural vision also entails parallel planning of sequential saccadic movements that foveate the eyes to salient aspects of the image. Behavioral evidence of parallel planning of saccade sequences have been observed in the double-step task in which intersaccade intervals (ISIs) become extremely short as the second target appears progressively earlier than the onset of saccade to the first target (Becker and Jürgens, 1979; McPeek et al., 2000; Ray et al., 2004; Sharika et al., 2008). The neural correlates of such parallel planning are also observed in oculomotor areas, such as the superior colliculus (SC; McPeek and Keller, 2001; Port and Wurtz, 2003), the frontal eye fields (Tian et al., 2000; Murthy et al., 2007; Phillips and Segraves, 2010), and the prefrontal cortex (Fujii and Graybiel, 2003).
Although parallel planning ensures quick responses, the transformation of parallel representations of goals into serial movement plans needs to be controlled. Behavioral manifestation of failure to control concurrent movement processing include averaged saccades that land midway between the location of the two targets (Findlay, 1982; Viviani and Swensson, 1982; Coëffé and O'Regan, 1987; Zambarbieri et al., 1987; Bhutani et al., 2012), incorrect ordering of sequences (Ray et al., 2012), and curved saccade trajectories (McPeek et al., 2003). Because the extent of such misdirected saccades is small, some form of competitive queuing of responses has often been hypothesized to prevent the collision of two concurrently activated movement plans (Grossberg, 1978; Norman and Shallice, 1986; Bullock and Rhodes, 2003; Bullock, 2004; Glasspool and Houghton, 2005; Davelaar, 2008; Ray et al., 2012). Such queuing models typically assume at least two representations: (1) an initial parallel representation of goals and (2) a second representation that selects each goal, one at a time, to produce its corresponding action. In this context, computational models have proposed that basal ganglia (BG) may be a critical node mediating temporal control by means of inhibition of inappropriate responses and disinhibition of appropriate response signals pertaining to the desired action (Mink, 1996; Redgrave et al., 1999; Brown et al., 2004; Cisek, 2007; Houk et al., 2007). Here we tested whether the BG might be necessary for sequential control such that the loss of this control might produce sequencing errors. We tested this hypothesis by recording eye movements during the double-step task in patients with Parkinson's disease (PD), in PD patients with stimulating electrodes, and by inactivating the BG by injection of muscimol into the caudate nucleus of awake behaving monkeys.
Materials and Methods
Subjects
Thirty-two PD patients and 32 age-matched control subjects participated in the study. Two macaque monkeys were also trained on the FOLLOW task. Control and patient subjects gave their informed consent in accordance with the institutional ethics committee of National Brain Research Centre and the Declaration of Helsinki. Monkeys were cared for in accordance with the animal ethics guidelines of the Committee for the Purpose of Control and Supervision of Experiments on Animals, Government of India. All procedures conformed to the National Institutes of Health guidelines.
Human subjects
Patients were diagnosed at the All India Institute of Medical Sciences (AIIMS) as having idiopathic PD in the absence of dementia by a consultant neurologist. All patients were medicated with daily doses of l-DOPA preparations and were supplemented with D2 receptor agonists such as ropinirole and/or cholinergic inhibitors (e.g., Pacitane) and catechol-O-methyl transferase inhibitors (e.g., Entacom). Patients were typically off medication for ∼7 h before behavioral testing. Disease severity varied between Hoehn–Yahr stages 1 and 4 (Hoehn and Yahr, 1967). Patients with Mini Mental State Examination rating <24 were excluded from the study to screen for dementia. Patients and control subjects did not have significant medical history of depression, drug abuse, and/or alcoholism. Eleven PD patients (mean ± SEM, 48 ± 3.9 years) and 10 age-matched controls (49.3 ± 4.0 years) were tested on a version of the double-step task called the FOLLOW task (Table 1). Ten PD patients (57.6 ± 2.7 years) and 11 age-matched controls (58 ± 1.4 years) were tested on another version of the double-step task called the REDIRECT task (Table 2). Inhibitory control of these patients has been reported previously (Joti et al., 2007). We refer to this task as the visually guided REDIRECT (VGR) task to distinguish it from the memory-guided REDIRECT (MGR; Farooqui et al., 2011) task, for which another group (see Table 3) of 11 PD patients (54.4 ± 2.2 years) and 11 age-matched controls (55.3 ± 2.3 years) were assessed. Three subjects (AS, VB, and VS) that performed MGR task had deep brain stimulation (DBS) implants and were thus recorded in both DBS-ON and DBS-OFF conditions. The DBS electrodes for these subjects were placed bilaterally, in the subthalamic nucleus (STN).
Table 1.
Background data for subjects who performed the FOLLOW task
| Subject | Age (years) | Hoehn–Yahr stage | Duration (years) |
|---|---|---|---|
| Patients | |||
| AA | 23 | 2 | 2 |
| AK | 50 | 2.5 | 5 |
| BN | 68 | 2.5 | 4 |
| DK | 61 | 3 | 5 |
| HK | 53 | 3 | 5 |
| IS | 43 | 2.5 | 10 |
| PK | 52 | 1.5 | 3 |
| RS | 51 | 4 | 11 |
| SP | 28 | 2.5 | 4 |
| SS | 53 | 3 | 13 |
| SV | 46 | 1.5 | 2 |
| Controls | |||
| CS | 32 | ||
| DS | 50 | ||
| HP | 61 | ||
| HS | 27 | ||
| KL | 48 | ||
| MS | 63 | ||
| OP | 43 | ||
| RB | 54 | ||
| RL | 66 | ||
| VM | 49 |
Table 2.
Background data for subjects who performed the VGR task
| Subjects | Age (years) | Hoehn–Yahr stage | Duration (years) |
|---|---|---|---|
| Patients | |||
| BS | 37 | 2.5 | 7 |
| DN | 65 | 3 | 21 |
| KB | 55 | 1 | 2.5 |
| MK | 56 | 2 | 5 |
| MN | 57 | 1 | 9 |
| PT | 67 | 1 | 3 |
| RB | 65 | 2.5 | 4 |
| RG | 54 | 1 | 4 |
| SB | 63 | 2.5 | 13 |
| SI | 58 | 2 | 13 |
| Controls | |||
| BK | 59 | ||
| BS | 62 | ||
| HG | 67 | ||
| IR | 56 | ||
| JC | 52 | ||
| KS | 62 | ||
| NJ | 51 | ||
| NK | 55 | ||
| NP | 61 | ||
| RS | 57 | ||
| WM | 56 |
Table 3.
Background data for subjects who performed the MGR task
| Subjects | Age (years) | Hoehn–Yahr stage | Duration (years) |
|---|---|---|---|
| Patients | |||
| AKP | 55 | 2 | 6 |
| BS | 54 | 1.5 | 5 |
| PNS | 67 | 1.5 | 5 |
| RP | 55 | 3 | 7 |
| OA | 58 | 1 | 1 |
| AK | 40 | 1.5 | 3 |
| VM | 52 | 2.5 | 6 |
| AS (DBS) | 55 | 4 | 15 |
| VB (DBS) | 47 | 4 | 4 |
| VS (DBS) | 65 | 4 | 20 |
| RK | 50 | 1.5 | 6 |
| Controls | |||
| AP | 65 | ||
| AK | 59 | ||
| BhS | 60 | ||
| BK | 50 | ||
| BN | 52 | ||
| BS | 45 | ||
| DP | 46 | ||
| OP | 65 | ||
| RS | 58 | ||
| SK | 47 | ||
| SR | 62 |
For the DBS surgical procedure, three patients (AS, VB, and VS) diagnosed with PD and not responding to the standard dopamine replacement therapy underwent bilateral simultaneous DBS surgery at the AIIMS. The STN was localized by MRI scans and also verified by microelectrode recording under local anesthesia, in which the STN was identified as a relatively silent zone just superior to the high-frequency firing zone of the substantia nigra pars reticulata (SNpr). Chronic stimulating electrodes (Medtronic 3389) were then placed bilaterally in the STN. The suitability of the placement was confirmed by intraoperative macrostimulation to ensure that there was an improvement of motor symptoms.
Monkeys
One female Rhesus monkey “C ” (Macaca mulatta; 5 years old and weighing 5.5 kg) and one male Bonnet monkey “E ” (Macaca radiata; 15 years old and weighing 6.3 kg) were also trained on the FOLLOW task.
Animal preparation.
All surgical procedures were performed under aseptic conditions. These included a head holder for restraining the head during experiments and a chamber for microelectrode recordings and injections. The chamber placement was such that it allowed access to the head and body of the caudate nucleus. Chamber placement was aided using MR images (Philips Achieva 3T for monkey C and Philips Achieva 1.5 T for monkey E) and the use of stereotaxic coordinates (Fig. 1a). We mapped the caudate nucleus in both monkeys. Recording and injection sites were verified by MRI in the monkeys while a tungsten electrode was inserted at one site into the caudate (Fig. 1a). Muscimol and saline injection sites for the two monkeys are plotted in Figure 1b. The caudate was identified by the presence of reward-related neurons (Fig. 1c) and the low-frequency spontaneous firing activity (2–10 Hz) of tonically active neurons (TANs), which were usually encountered ∼500 μm along the electrode penetration in the caudate nucleus.
Figure 1.

Location of injection sites. a, Oblique section of monkey C showing an electrode penetration inside the caudate nucleus. The magenta arrow points at the tip of the electrode. The image was three-dimensionally constructed using a Philips Achieva 3T MRI. b, Each dot represents injection sites in the anteroposterior (A-P)–mediolateral (M-L) plane relative to the center of the recording chamber, having coordinates of [6,6] for monkeys C (top) and E (bottom). The color indicates whether more than one site was inactivated at a particular location at different depth levels. Five saline injection sites in each monkey are shown as a green cross. The position [9,7] marks the site at which the electrode was inserted for the MRI image. c, A reward-related neuron in the caudate nucleus to illustrate the effect of muscimol. The firing activity of the neuron is aligned to the time of reward. Each row shows a trial, and each spike event is shown as a dot. Green dots mark the time of target appearance, whereas magenta dots mark the time of saccade. The red line marks the time of reward. Firing activity reduced in the post-muscimol injection session (bottom) compared with the pre-muscimol injection session (top).
Local infusion of muscimol into the caudate nucleus.
In each session, 0.5–1.5 μl of 5 μg/μl muscimol was injected in 0.1 μl steps over a 10 min period. Sessions were spaced a few days apart to ensure complete recovery at the injection site. On the day before each inactivation experiment, we identified an injection site and depth within the caudate nucleus using multiunit recording to identify reward related neurons and TANs. A total of 40 injections were done in both monkeys. Muscimol injections were made at 18 sites in the caudate nucleus of monkey C and 12 sites in monkey E (Fig. 1b). Ten injections of 1 μl of sterile saline (five in each monkey) were also made to ensure that the effects were specific to muscimol and not because of the injection procedure per se. Preinjection data were collected with our injection setup resting ∼1 mm above our estimate of caudate nucleus from the previous day. Parameters for obtaining behavior were identical for both the pre-injections and post-injections, although the monkey was rewarded somewhat more generously after injection to maintain motivation.
Task and stimuli
We used a modified version of the double-step task (Ray et al., 2004), in which on some trials, two targets appeared in succession. The double-step saccade task was performed in three different conditions: (1) FOLLOW (Fig. 2a), (2) VGR (Fig. 2b), and (3) MGR (Fig. 2c). In each task condition, two types of trials were randomly interleaved: (1) no-step trials (60%) and (2) step trials (40%). A trial started with the appearance of a central fixation point (FP), which was a 1° white square, presented on a dark background. Subjects were required to fix their gaze within a ±3° electronically drawn window centered at the FP. In the FOLLOW (Fig. 2a) and VGR (Fig. 2b) tasks, targets remained on throughout the trial duration. No-step trials were same in both tasks, in which after fixation for a random duration ranging from 300 to 800 ms, the FP turned off and a red target (1° × 1°, ∼6.5 cd/m2) appeared in one of six possible locations centred on an imaginary circle (except vertical up and down positions) of radius 12° or 18°, centered on the FP. Thus, the appearance of the red target instructed subjects to saccade to the red target as quickly as possible and maintain fixation within a ±3° electronic window drawn around the center of the target.
Figure 2.
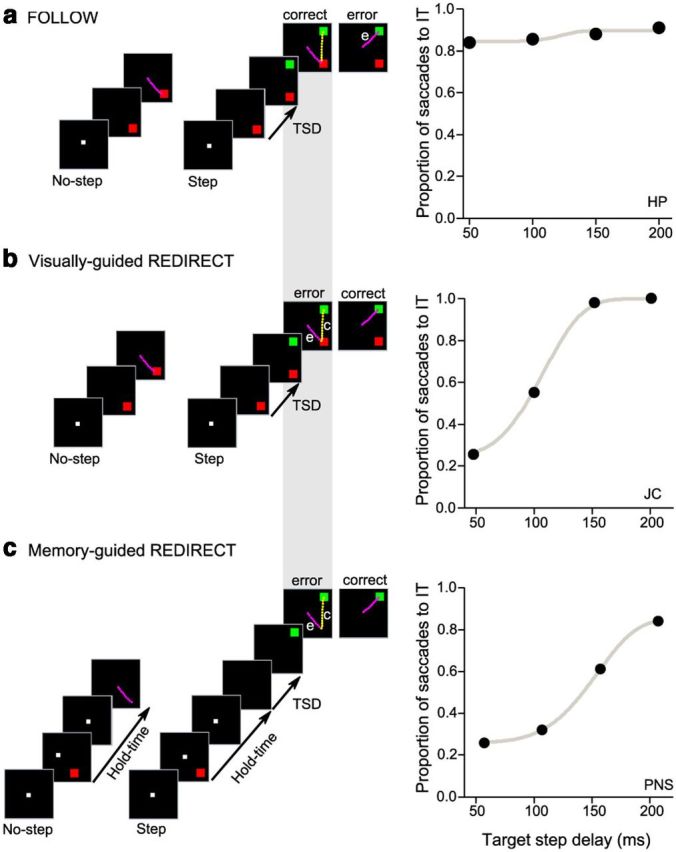
Schematic showing the temporal events in the FOLLOW (a), VGR (b), and MGR (c) tasks. Each trial started with the appearance of the FP. The tasks consist of two types of trials: no-step and step trials. In no-step trials, subjects were instructed to make a saccade (magenta) to the presented target. a, On step trials in the FOLLOW task, subjects were instructed to follow the order of appearance of targets with two sequential saccades (magenta and yellow). The proportion of saccades to the IT was thus not affected by the TSD (right panel). b, In step trials of the VGR task, subjects were instructed to cancel the planned saccade to the IT and redirect their gaze to the later appearing second target. In some step trials, an erroneous saccade (e; magenta) to the IT was followed by a corrective saccade (c; yellow) to the FT location, thus generating sequential saccades similar to the FOLLOW task. Correct performance in the REDIRECT task, unlike the FOLLOW task, is characterized by a monotonic dependence of erroneous saccades to the IT as TSD increases. c, In the MGR task, the disappearance of the FP after a hold time period cued subjects to make a saccade to the remembered target location. In step trials, the appearance of a green target after a variable TSD from the GO cue provided the redirect signal. Thus, performance on the MGR task is similar to the VGR task.
On step trials, a final target (FT; green; 1° × 1°, ∼6.0cd/m2) appeared after the initial target (IT). In our tasks, the visual angle between the IT and FT, which refers to the angle between line segments drawn from FP to IT and FT, was 90°, 135°, or 180°. In addition, we also varied the time of occurrence of the FT relative to the IT, called the target step delay (TSD). TSDs ranged from 50 to 200 ms and were accurate to the screen refresh rate. In the FOLLOW task, subjects were instructed to follow the appearance of two targets with sequential saccades, fixating the respective targets within an electronically drawn window of ±3° centered at the target. In the VGR task, after appearance of the second target, subjects had to cancel the planned saccade to the IT and redirect their gaze to the FT. In the MGR task (Fig. 2c), after fixation for a random duration of 300–800 ms, the IT appeared for ∼100 ms. Subjects continued fixation for another 700–1300 ms (hold time), until the FP turned off, which cued subjects to make a saccade to the remembered location of IT. On step trials, an FT appeared after the TSD (relative to FP off). The redirect signal here was same as in the VGR task.
Before each recording session, subjects were given verbal instructions and 50–100 practice trials. Subjects performed ∼500 trials and were given regular breaks throughout the recording session to avoid contamination of data attributable to excessive fatigue. Feedback was given to the subjects using an auditory beep at the end of each correct trial. All control subjects were monetarily rewarded at the end of the recording session.
For monkeys, the color of the two targets were reversed: the no-step target and the IT in the step trial were green in color (∼6.0 cd/m2), whereas the FT was red (∼6.0 cd/m2) in color. Targets appeared at any of eight possible locations centered at the FP. We used five TSDs for the monkeys, ranging from 16 to 150 ms, in steps of ∼30 ms that were accurate to the screen refresh rate. Monkeys were recorded on ∼1000 trials, both before and after injection. Monkeys were rewarded with a drop of juice at the end of each correct trial.
Recording setup
TEMPO/VDEOSYNC software (Reflective Computing) displayed visual stimuli, and sampled and stored eye positions and other behavioral parameters. Eye position was monitored using an infrared pupil tracker (ISCAN) with a 240 Hz (monkeys)/200 Hz (humans) sampling rate. The eye tracker interfaced with TEMPO software in real time. Visual stimuli were presented on a CRT monitor (Sony Trinitron GDM 500; 21 inches, 70 Hz refresh rate; 640 × 480 resolution) for monkey C. For monkey E, targets were presented on a Sony Bravia LCD monitor (42 inches, 60 Hz refresh rate; 640 × 480 resolution). For humans, visual stimuli were presented on a Samsung CRT monitor (19 inches, 70 Hz refresh rate; 640 × 480 resolution).
Before each session, subjects were asked to fixate five positions on the monitor: one at fixation in the center of the monitor and at least four target positions (horizontal left, right; vertical up, down) that circumscribed an imaginary circle with an eccentricity of 12° (18° for control and PD subjects). While subjects fixated the targets, we set the horizontal and vertical gain parameters in TEMPO software that displayed ISCAN eye data in real time, such that end point of the saccade would typically be in the center of the electronic windows centered on their respective target positions (but visible only to the experimenter). Furthermore, we asked the subjects to saccade to single targets presented at the eight target locations with increasing fixation and postsaccadic times (200 ms). For these trials (four to five at each target location), we computed the distance between the mean eye position during the postsaccadic duration and the target center, which was found to be 1.4° (1.6° for the 200 Hz eye tracker), averaged over all the target locations. The mean of the SD across these trials was ∼0.8°. These measures provided an estimate of the spatial accuracy of the eye tracker (Hornof and Halverson, 2002; Kornylo et al., 2003; Holmqvist et al., 2011). Moreover, the electronic window of size ±3° centered at the target ensured that, even if the saccade endpoint drifted from the center of the target, it was still within the defined limits set by the experimenter. The monitor was placed 57 cm from the subject so that 1° of visual angle would correspond to 1 cm on the video monitor. In our experiment, targets were at a minimum of 12° of eccentricity, and the minimum angular separation between the two targets in a step trial was 90°. Thus, the minimum spatial separation between the two targets was ∼17°, and the error introduced as a consequence of the accuracy of the tracker (∼1.4°) was well within limits to be confident that trials were correctly classified. Because the electronic window (for fixation and target position) was displayed throughout the experiment, we could also adjust the gains and recalibrate the fixation spot from time to time to compensate for drifts and slight changes in head positions.
Data analyses
Saccades were detected based on velocity and eye position criteria (Hanes et al., 1998; Murthy et al., 2007; Ramakrishnan et al., 2012). Analog eye position data were smoothened using a boxcar filter of 12 ms bin width, and blinks were removed. High-frequency gaze shifts were marked by setting a velocity threshold criterion of >30°/s. Saccade beginning and end were defined as the monotonic change in eye position, which lasted for at least 12 ms before and after the high-frequency gaze shift. Because the tracking frequency of the eye tracker was either 240 or 200 Hz, the saccade detection method was accurate to within 4–5 ms. The saccade detection algorithm was subsequently verified manually; the direction and amplitude of each saccade were also determined. The direction of each saccade was obtained by taking the inverse tangent of the slope of the line segment joining the start and end of saccade. All blink-perturbed saccades were eliminated from the analyses.
All offline analyses were performed using custom-made programs in MATLAB (MathWorks). Trials in which the saccade latency were <80 ms (anticipatory saccades) were rejected. All statistical tests between subjects were done using the statistical toolbox in MATLAB. Normality in each condition was tested using the Lilliefors test. Group comparisons were made using the n-way ANOVA, where n represents the number of multiple factors whose effects were being tested on the data. For non-normal datasets, nonparametric versions of these tests were used. The percentages of midway/hypometric saccades were first arcsine transformed (Hogg and Craig, 1995) to ensure normal distributions before performing parametric statistics. Bonferroni–Holm correction (Holm, 1979) was used for post hoc multiple comparison. The test is different from the standard Bonferroni's correction and strongly controls for the familywise error rate at α = 0.05. In the Bonferroni–Holm correction, all the p values are organized in ascending order. If m is the total number of p values, the corrected p value (pCori) for the ith p value (pi) is given by pi × (m − i). Any corrected p value <0.05 was considered significant. Note that, in the Bonferroni–Holm correction, corrected p values can be >1. Unless mentioned otherwise, all results are presented as mean ± SEM. These values correspond to the original values before transformation.
Weibull fits for the compensation function
Compensation function, defined as the proportion of step trials in which subjects made a saccade to the IT, at different TSDs, were fitted by a cumulative Weibull function as shown below (Hanes et al., 1998; Ray et al., 2009):
where t is the range of the TSD, α is the time at which the function reaches the sum of 63.2% of its maximum value γ and 36.8% of its minimum value δ, and β is the slope (Ray et al., 2009).
Midway saccades
From the correct no-step trials, we calculated the 95% confidence interval of the distribution of the direction of endpoints of target-directed saccades (Fig. 3a). Those step trials, in which the initial saccade landed between the locations of ITs and FTs but beyond the 95% confidence interval of the distribution of no-step saccade endpoints to the two targets were called midway saccades (Fig. 3a).
Figure 3.

Classification of midways and hypometric saccades. a, Midway saccades were defined as those saccades whose endpoints were beyond the 95% confidence interval of correct no-step saccades but between the IT and FT (left). The middle shows saccades directed toward IT (red) and FT (green) and midway saccades (black) in step trials. The right shows the first (red) and second (green) saccades directed at the IT (pale red) and FT (pale green) in a correct step trial in the FOLLOW task. b, Saccades directed toward the IT in step trials but fell short of entering the region defined by the 95% confidence ellipse were called hypometric saccades (left). The middle shows correct (green), incorrect (red), and hypometric (black) saccades. The right shows a correct (green) saccade to the FT (pale green) in a step trial (adapted from Bhutani et al., 2012).
Hypometric saccades
An ellipse was drawn at the center of each target, using the means of the 95% confidence interval for the direction and amplitude of correct no-step saccades as the two radii (Fig. 3b), to demarcate the distribution of the endpoints of correct no-step saccades. Those saccades that were directed toward the IT, but whose amplitudes were less than the lower confidence bound of the amplitude spread, were classified as hypometric saccades (Fig. 3b).
In the context of midway and hypometric saccades, erroneous trials were defined as those in which subjects failed to correct the initial midway/hypometric saccade response according to task requirements.
ISI and reprocessing time
Intersaccadic interval (ISI) is the time between the end of first saccade and the beginning of second saccade, whereas the time between the appearance of the FT and the end of the first saccade is the reprocessing time (RPT; see Fig. 7a). Therefore, RPT is the time available for concurrent processing of the second saccade before the first saccade is completed. Variable TSDs were used to control the extent of RPT such that shorter RPTs were associated with longer TSDs and vice versa. ISIs and RPTs were computed for each step trial with sequential saccades. Only those step trials for which ISI was less than the 95th percentile of the no-step saccade latencies were used to quantify whether ISIs varied significantly with RPT, because ISIs greater than the normal saccade latency were likely to have been produced as a consequence of serial processing (Murthy et al., 2007). Furthermore, for each RPT bin, we removed those trials from the analysis for which ISI was beyond 5 SDs from the mean.
Figure 7.
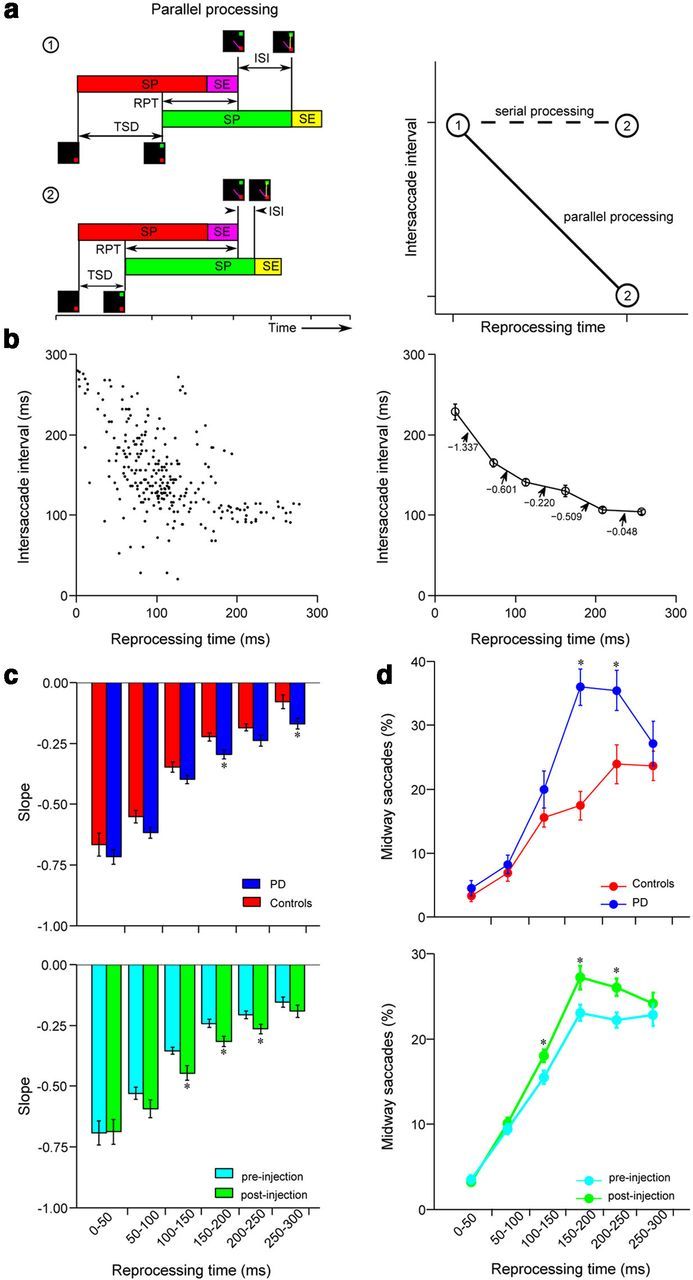
Increased parallel planning in PD subjects and after muscimol injections in monkeys. a, Left, Schematic showing parallel processing of two saccades for low (1) and high (2) RPT conditions. SP and SE stand for saccade planning and saccade execution stages, respectively. In the low RPT condition, there is less overlap between two saccades compared with the high RPT condition. Right, Schematic showing the plot of ISI versus RPT. For serial planning, ISI is invariant of RPT, and the slope of ISI versus RPT is expected to be 0. If the two saccades are being planned in parallel, then ISI should decrease with increasing RPT. b, Plot of ISI versus RPT for a subject. The left shows data for each step trial. In the right, the RPT was binned into 50 ms intervals, and the corresponding values of ISI and slopes were calculated. c, Histogram distribution of slopes for human subjects (top) and monkeys (bottom) describing the processing rate as a function of RPT in the FOLLOW task. d, Percentage of midway saccades for human subjects (top) and monkeys (bottom) as a function of RPT. Data for both monkeys were pooled together. Error bars represent the SEMs. Significant differences are marked by asterisks.
Curved saccades
Saccade curvature was quantified as the maximum perpendicular deviation from the straight line drawn from the start to the end of saccade, normalized by the amplitude of the saccade (Smit and Van Gisbergen, 1990). We analyzed those step trials in which the first saccade was directed to the IT. Trials were further separated based on the direction of the curvature with respect to the location of the second target. Those trials in which saccades were curved toward the FT were given a positive sign, whereas saccades that curved away from the FT had a negative sign. Analyses were done separately for different target locations. To estimate the normalized curvature (McPeek et al., 2003), we subtracted the inherent mean curvature of no-step saccades for different target directions from the individual curvature values. Saccades with normalized curvature values beyond 0.75 of the SD from the mean normalized curvature were classified as curved saccades.
Order reversals
These trials were defined by those in which subjects made a saccade to the IT after a saccade to the FT. Thus, in these trials, subjects made sequential saccades but their temporal order was reversed.
Results
Saccade averaging and concurrent movement planning
To test whether saccade averaging, in which gaze lands between the location of two simultaneously or sequentially presented stimuli, occurs as a consequence of concurrent processing of two movement plans, subjects performed double-step saccade tasks (Fig. 2) under different task instructions such that the retinal information was the same but different movement plans were required for successful performance. In the REDIRECT tasks, subjects were instructed to inhibit the response to the IT and generate a saccade to the FT instead. In contrast, in the FOLLOW task, subjects were instructed to foveate with successive saccades the IT and the FT in their order of presentation. To determine whether saccade averaging was sensitive to the type of movement planning, we estimated the percentages of hypometric versus midway saccades for control subjects in FOLLOW, VGR, and MGR (Fig. 4) tasks. Subjects made averaged saccades 27.26 ± 2.11%, 27.18 ± 3.76%, and 34.07 ± 2.59% relative to step trials in the FOLLOW, VGR, and MGR tasks, respectively. There was no significant difference in the extent of averaging in the three tasks (one-way ANOVA; p = 0.095; F(2,29) = 2.55), but we observed a task-specific difference in the type of averaged saccades (midway/hypometric saccades) in the FOLLOW versus VGR/MGR tasks (unbalanced two-way ANOVA; p < 0.001; F(2,58) = 41.19), in accordance with the movement averaging hypothesis (Bhutani et al., 2012). Planned comparisons using Bonferroni–Holm correction revealed that, in the FOLLOW task, subjects generated a significantly greater (pCor = 0.001) percentage of midway saccades (19.96 ± 1.24%) over hypometric saccades (7.30 ± 1.36%). On the contrary, subjects in the VGR task generated a greater extent (pCor = 0.001) of hypometric saccades (19.91 ± 2.72%) than midway saccades (8.57 ± 2.07%). A similar trend was observed in the MGR task as well (pCor < 0.001), in which subjects produced 26.58 ± 2.56% and 10.99 ± 2.56% of hypometric and midway saccades, respectively. These data replicate and extend previous findings (Bhutani et al., 2012) and suggest that saccade averaging is a consequence of the collision of two concurrently evolving movement plans.
Figure 4.

Testing predictions of the movement averaging hypothesis. In control subjects, the frequency of midway saccades are greater in FOLLOW (blue) relative to VGR (red) and MGR (green) tasks. The pattern is opposite for hypometric saccades. Open circles represent data for individual subjects, whereas means for each task condition are represented by filled circles. Error bars represent SEM.
The role of BG in saccade averaging: evidence from PD patients
In congruence with the hypothesis that BG might control the sequential production of saccades, PD subjects, compared with control subjects, showed a significant increase in the extent of averaging (unbalanced two-way ANOVA; p < 0.001; F(1,58) = 82.90). Most importantly, this increase in the extent of averaging was task dependent (unbalanced three-way ANOVA; p < 0.001; F(2,116) = 17.51; Fig. 5a). In the FOLLOW task, PD subjects (40.60 ± 3.74%) generated greater percentage of midway saccades as compared to control subjects (pCor = 0.002). However, there was no significant difference in the extent of hypometric saccades in the PD (7.76 ± 1.17%) relative to control subjects (pCor = 6.918). In contrast, in the VGR task, we observed a significant selective increase in the percentage of hypometric saccades in PD subjects (42.40 ± 2.62%; pCor < 0.001) as compared to controls. However, there was no significant difference in the percentage of midway saccades for PD subjects (8.57 ± 2.06%; pCor = 7.588) as compared to controls. Likewise, in the MGR task, hypometric saccades produced by PD subjects (50.54 ± 2.69%; pCor < 0.001) were significantly greater than those for controls, whereas there was no significant difference in the extent of midway saccades (10.99 ± 2.56%; pCor = 2.905).
Figure 5.

PD subjects show a task-specific increase in saccade averaging. a, Scatter plot of the extent of hypometric versus midway saccades in the FOLLOW (blue), VGR (red), and MGR (green) tasks for PD subjects. Open squares represent data for individual subjects, whereas means for each task condition are represented by filled squares. Error bars represent SEM. The mean ± SEM for control subjects are also plotted (filled circles). An increase in the mean ± SEM of midway saccades for PD subjects compared with controls is marked by the blue arrow. Similarly, an increase in hypometric saccades in the VGR and MGR tasks for PD subjects is marked by red (VGR) and green (MGR) arrows. b, Bar plots for the CV for the endpoint scatter of no-step saccades in the FOLLOW (blue), VGR (red), and MGR (green) tasks. There was no significant difference in the CV between PD and control (gray-shaded region) subjects. c, Scatter plot of the percentage of hypometric (filled circles) and midway (open circle) saccades in the DBS-OFF versus DBS-ON conditions for three subjects who performed the MGR task.
To rule out the possibility that the increased extent of averaging was a consequence of an increase in the endpoint scatter of saccades in PD subjects, we analyzed the endpoint scatter of no-step saccades for control and PD subjects across the three task conditions. Because the mean amplitude of no-step saccades was different across subjects, we analyzed the coefficient of variation (CV) in the no-step endpoint scatter. As shown in Figure 5b, we did not observe any significant difference in the scatter of no-step saccades between PD and controls (unbalanced two-way ANOVA; p = 0.078; F(1,58) = 3.22), although there was a significant task-specific difference in the scatter (unbalanced two-way ANOVA; p < 0.001; F(2,58) = 12.3). The CV (mean ± SD) was 0.178 ± 0.048/0.188 ± 0.064 and 0.199 ± 0.011/0.216 ± 0.018 for FOLLOW/VGR tasks, respectively, for the controls and PD subjects. However, post hoc analysis using the Bonferroni–Holm correction revealed that the scatter for PD subjects in the MGR task (0.244 ± 0.034) was significantly more than that for FOLLOW control (pCor = 0.009) and FOLLOW PD (pCor = 0.006) subjects. The scatter for control subjects in MGR task (0.242 ± 0.023) was significantly greater than that for FOLLOW PD subjects (pCor < 0.001).
To further test the causal contribution of BG in the control of saccade averaging, we tested three subjects with DBS electrode implants in the STN in the MGR task. These subjects were recorded in both DBS-ON and DBS-OFF conditions. Consistent with the hypothesis that control of saccade averaging is mediated by the BG, we found that the tendency for saccade averaging was significantly reduced in the DBS-ON condition compared with the DBS-OFF condition (Fig. 5c; paired t test, t = 6.929; df = 2; p = 0.020; power = 0.985). In the DBS-OFF condition, 64.86% (AS), 61.28% (VB), and 51.56% (VS) were midway/hypometric saccades. The same subjects made 33.33% (AS), 37.91% (VB), and 27.27% (VS) hypometric saccades in the DBS-ON condition. Interestingly, the decrease of averaging was also task specific, with hypometric saccades being greatly decreased in the DBS-ON condition (paired t test, t = 10.747; df = 2; p = 0.008; power = 0.958). However, the presence of DBS did not appear to significantly affect the extent of midway saccades (paired t test, t = 2.810; df = 2; p = 0.107; power = 0.053); subjects made 3.57/5.49% (AS), 5.64/3.46% (VB), and 8.17/6.67% (VS) of midway saccades in the DBS-OFF/DBS-ON conditions, respectively.
The role of BG in saccade averaging: evidence from reversible inactivation of BG in monkeys
Because changes in brain organization as a result of PD preclude a straightforward interpretation of relating deficits in the control of sequential saccades to normal BG function, we reversibly inactivated the caudate nucleus, which represents the major input node of the BG in two monkeys (Alexander et al., 1986). This was achieved by injecting the GABA agonist, muscimol, while monkeys performed the FOLLOW task (Fig. 2a). We recorded the behavior of monkeys in both pre-muscimol/post-muscimol injection epochs (Fig. 6). Similar to human subjects who performed the FOLLOW task, midway saccades were significantly greater than hypometric saccades (Fig. 6a; balanced two-way ANOVA, p < 0.001; F(1,120) = 143.86). More importantly, there was a significant selective increase in the extent of midway saccades after muscimol injection (25.62 ± 1.32%; balanced two-way ANOVA, p < 0.001; F(1,120) = 153.23) compared with the pre-muscimol injection sessions (21.18 ± 0.94%). Multiple comparisons using the Bonferroni–Holm correction further confirmed that the percentage of midway saccades in the post-muscimol session was significantly greater than midway saccades in the pre-muscimol session (pCor = 0.002), and also significantly greater than hypometric saccades in the post-muscimol session (15.84 ± 0.94%; pCor < 0.001). There was no significant difference in the extent of hypometric saccades in the post-muscimol injection sessions from pre-muscimol injection sessions (15.04 ± 1.04%; pCor = 0.252). Individually, we observed an increase in the extent of midway saccades in 13 of 18 caudate injections in monkey C and 7 of 13 injections in monkey E. This effect was specific to muscimol injections only because we observed no significant difference in the extent of midway (paired t test, t = 0.434; df = 9; p = 0.674) and hypometric (paired t test, t = −0.690; df = 9; p = 0.508) saccades in pre-saline and post-saline injections (Fig. 6a, right).
Figure 6.

Increased midway saccades by muscimol injections. a, Scatter plot of the extent of hypometric saccades (squares) and midway saccades (circles) for monkeys C (blue) and E (red) in post-muscimol versus pre-muscimol injection sessions during the FOLLOW task. The right panel plots the extent of midway (circles) and hypometric (squares) saccades for post-saline versus pre-saline injection sessions. Black circles and squares represent the mean values. b, Scatter plot of the CV of the endpoint scatter in no-step trials in post-injection versus pre-injection conditions for monkeys C (blue) and E (red). Filled circles represent data for muscimol sessions; open circles represent data for saline injection sessions. c, Box plots of the extent of midway saccades in the Contra–Contra, Contra–Ipsi, Ipsi–Contra, and Ipsi–Ipsi conditions for pre-muscimol (cyan) and post-muscimol (green) injection sessions. The effect was significantly greater when the IT was presented contralateral to the injection site. Box plot conventions: whiskers, range; box, interquartile range; notch, 95% confidence limit; line through the center of the box, median; red plus, outlier. Significant differences are marked by the asterisks.
As in PD subjects, the increase in midway saccades in the post-muscimol injection sessions in monkeys was not a consequence of a general tradeoff in the accuracy of saccades. Muscimol injections did not affect the scatter of saccade endpoints in no-step trials. This was ascertained by computing the CV for endpoint scatter of no-step saccades in post-muscimol versus pre-muscimol sessions for monkey C (Fig. 6b, filled blue circles) and monkey E (Fig. 6b, filled red circles). Because most of the points lie on the diagonal, this suggests that muscimol injections did not alter the endpoint scatter for no-step saccades (paired t test, t = −0.901; df = 30; p = 0.375). The open circles in Figure 6b represent the corresponding data during saline injections for the two monkeys (paired t test, t = −0.319; df = 9; p = 0.756).
To further test the spatial selectivity of the effect of muscimol injections on midway saccades, we divided midway saccade trials in the post-muscimol injection sessions into four categories depending on the location of the two targets relative to the site of inactivation: (1) Contra–Contra (IT and FT in the contralateral field); (2) Contra–Ipsi (IT and FT in contralateral and ipsilateral fields, respectively); (3) Ipsi–Contra (IT and FT in ipsilateral and contralateral fields, respectively); and (4) Ipsi–Ipsi (both IT and FT in ipsilateral fields). A one-way ANOVA (p < 0.001; F(1,120) = 24.73) revealed that the maximum percentage of midway saccades were produced in trials in which the first target was in the contralateral field (Contra–Contra, 27.56 ± 0.56%; Contra–Ipsi, 26.88 ± 0.47%), and the least percentage of midway saccades were produced when both targets were in the ipsilateral field (Ipsi–Ipsi, 22.33 ± 0.55%). In the Ipsi–Contra condition, monkeys generated 23.66 ± 0.49% of midway saccades. Additional multiple comparisons using the Bonferroni–Holm correction revealed that the extent of midway saccades in the Contra–Contra condition was significantly greater than that in the Ipsi–Contra (pCor < 0.001) and Ipsi–Ipsi (pCor < 0.001) conditions. Similarly, the extent of midway saccades in the Contra–Ipsi condition was also significantly greater than that in the Ipsi–Contra (pCor < 0.001) and Ipsi–Ipsi (pCor < 0.001) conditions. In the pre-muscimol injection sessions, there was no specific difference in the extent of midway saccades based on the target locations (Contra–Contra, 24.25 ± 0.88%; Contra–Ipsi, 25.24 ± 0.69%; Ipsi–Contra, 24.91 ± 0.84%; Ipsi–Ipsi, 24.56 ± 0.99%; balanced one-way ANOVA, p = 0.835; F(1,120) = 0.29).
Control of parallel planning of sequential saccades by BG
If BG controls the sequential execution of concurrently planned saccades, then an impaired BG or inactivation of the caudate is expected to increase the degree of parallel planning of saccades. To test this, we analyzed the relationship between the ISI (time between two saccades) and RPT (Fig. 7a,b). Although RPT is typically defined as the time between the appearance of the FT and the onset of the first saccade (Becker and Jürgens, 1979; Ray et al., 2004; Ludwig et al., 2007; Murthy et al., 2007), the RPT can be extended to include the period until the end of the first saccade because concurrent planning may also occur during saccade execution (Resulaj et al., 2009; Ray et al., 2011). The rationale behind this analysis is that, if two saccades are planned serially, then ISI should be invariant of RPT, resulting in an ISI versus RPT plot with a slope of 0 (Fig. 7a, right). In contrast, if the two saccades are planned in parallel (Fig. 7a, left), then ISI should decrease with RPT. Thus, ISI should be inversely related to RPT, with a slope of −1 in the ideal condition, when no interference between saccade plans occurs (Fig. 7a, right). However, slopes with values less than −1 should reflect instances when interference between saccade plans slows the rate of parallel planning. Thus, the slope of the ISI versus RPT is a metric that describes the rate of parallel planning (Ray et al., 2004; Sharika et al., 2008).
An increase in the parallel planning of two saccade plans for PD subjects and post-muscimol injection sessions in monkeys should thus be reflected in a steeper decrease in the ISI with increasing RPT. To analyze parallel programming, we binned the RPT into 50 ms bins and calculated the mean ISIs in the corresponding RPT bins and hence the slope of the line segments joining adjacent data points (Fig. 7b, right). Because the slopes represent the rate of processing of the second saccade during the RPT interval and decrease with increasing RPT, this suggests that the extent of parallel planning decreases with increasing RPT. This is because at higher RPTs there is less parallel programming of the second saccade, the ISIs do not decrease with additional increase in the RPT. Consistent with the hypothesis that BG might transform the mode of information processing from parallel to serial, we observed greater slopes for PD subjects compared with control subjects (Fig. 7c, top). Similarly, we observed increased parallel planning during the post-muscimol epoch compared with the pre-muscimol epoch for the monkeys (Fig. 7c, bottom). The corresponding data are tabulated in Table 4.
Table 4.
Slopes describing processing rates as a function of RPT for PD and control subjects and for pre-muscimol and post-muscimol sessions for the two monkeys
| RPT bins (ms) | Subjects (slope; mean ± SEM) |
p value | Monkeys (slope; mean ± SEM) |
p value | ||
|---|---|---|---|---|---|---|
| Controls | PD | Pre-muscimol | Post-muscimol | |||
| 0–50 | −0.67 ± 0.04 | −0.72 ± 0.03 | 0.381 | −0.63 ± 0.05 | −0.69 ± 0.05 | 0.406 |
| 50–100 | −0.55 ± 0.02 | −0.62 ± 0.02 | 0.066 | −0.53 ± 0.02 | −0.59 ± 0.04 | 0.119 |
| 100–150 | −0.35 ± 0.02 | −0.39 ± 0.02 | 0.072 | −0.35 ± 0.01 | −0.44 ± 0.03 | 0.004 |
| 150–200 | −0.22 ± 0.02 | −0.29 ± 0.02 | 0.008 | −0.24 ± 0.02 | −0.32 ± 0.02 | 0.006* |
| 200–250 | −0.18 ± 0.01 | −0.24 ± 0.02 | 0.066 | −0.20 ± 0.01 | −0.26 ± 0.02 | 0.023* |
| 250–300 | −0.08 ± 0.03 | −0.17 ± 0.02 | 0.022* | −0.15 ± 0.02 | −0.19 ± 0.02 | 0.118* |
*Mann–Whitney U test was used for the test of significance.
An increased parallel programming, especially at higher RPTs, implies that the frequency of midway saccades should be a function of RPT. In addition, greater deficits in the frequency of midway saccades are predicted for PD subjects relative to controls as well as for monkeys with respect to RPT. Both aspects of these predictions were tested and confirmed for human subjects (Fig. 7d, top) and monkeys (Fig. 7d, bottom). The corresponding data are tabulated in Table 5.
Table 5.
The extent of midway saccades as a function of RPT for PD and control subjects and for pre-muscimol and post-muscimol sessions for the two monkeys
| RPT bins (ms) | Subjects (midway saccades %; mean ± SEM) |
p value | Monkeys (midway saccades %; mean ± SEM) |
p value | ||
|---|---|---|---|---|---|---|
| Controls | PD | Pre-muscimol | Post-muscimol | |||
| 0–50 | 3.28 ± 0.96 | 4.47 ± 1.18 | 0.586 | 3.46 ± 0.52 | 3.17 ± 0.42 | 0.187* |
| 50–100 | 6.85 ± 1.29 | 8.16 ± 1.14 | 0.499 | 9.43 ± 0.61 | 10.09 ± 0.67 | 0.307* |
| 100–150 | 15.57 ± 1.51 | 19.97 ± 2.87 | 0.159 | 15.51 ± 0.80 | 18.01 ± 0.76 | 0.009* |
| 150–200 | 17.43 ± 2.25 | 36.03 ± 2.85 | <0.001 | 23.09 ± 0.91 | 27.24 ± 1.41 | 0.016* |
| 200–250 | 23.91 ± 3.06 | 35.49 ± 3.12 | 0.011 | 22.24 ± 0.89 | 26.07 ± 1.01 | 0.018 |
| 250–300 | 23.66 ± 2.28 | 27.16 ± 3.48 | 0.569 | 22.81 ± 1.28 | 24.21 ± 1.26 | 0.406 |
*Mann–Whitney U test was used for the test of significance.
An additional behavioral manifestation of failure to control concurrent processing of two competing movement plans also occurs when subjects generate curved saccade trajectories (McPeek and Keller, 2001). Therefore, we analyzed the curvature of saccades directed toward the IT in step trials in the FOLLOW task for monkeys. Trials were separated based on whether saccades curved toward the FT or away from the FT. If BG serves as a queue that prevents access of the second saccade plan to peripheral motor output structures, while the first saccade is in the pipeline, we predicted that the inactivation of BG should unmask the suppression of the motor plan to the FT, resulting in more curved saccades toward the FT. Consistent with this notion, in the curved-toward trials, the mean ± SEM for the curvature index significantly increased from 0.199 ± 0.011 to 0.244 ± 0.017 from pre-injection to post-injection sessions (Mann–Whitney U test; z = −2.098; df = 30; p = 0.036; Fig. 8a,b). We also observed a slight decrease in the mean ± SEM curvature index for post-injection sessions (−0.119 ± 0.004) compared with the pre-injection sessions (−0.126 ± 0.004) on the curved-away trials, although this difference was not significant (Mann–Whitney U test; z = −1.161; df = 30; p = 0.245; Fig. 8a,b).
Figure 8.

Increased curvature toward the FT location in PD subjects, and after muscimol injections in monkeys. a, Histogram distributions for the normalized curvature indices for pre-muscimol (cyan) and post-muscimol (green) injection sessions. There was a significant and selective increase in the curvature for saccades that curved toward the FT as opposed to saccades that curved away from the FT during post-muscimol injection sessions. b, Scatter plot of mean normalized curvature indices in the curved-toward (circles) and curved-away (squares) trials in post-muscimol versus pre-muscimol injection sessions for monkeys C (blue) and E (red). c, Bar plots showing that PD subjects (blue) displayed a greater extent of order reversals in step trials than controls (red). d, Scatter plot of the percentages of order reversals in step trials in post-injection versus pre-injection for monkeys C (blue) and E (red) during muscimol (filled circles) and saline (open circles) sessions. e, Bar plots showing a significant increase in order reversals during the post-muscimol injection sessions for monkeys during pre-muscimol (cyan) and post-muscimol (green) sessions. Error bars represent SEMs. Significant differences are marked by the asterisks.
Parallel planning of two movement plans implicitly demand a sharing of central planning resources in some proportion to maintain correct serial order (Ray et al., 2012). This is particularly relevant to trials in which the second movement plan is processed quicker than the first movement plan as a result of the inherent stochasticity in movement planning (Reddi and Carpenter, 2000). One consequence of such parallel plans is the expression of serial order errors such as the reversal of saccade order. Thus, increased parallel planning, as a consequence of increased impairment of BG, should result in increased instances of reversal of saccade order. Figure 8c describes the increased extent of the impairment of ordering effects observed in PD subjects, as well as in post-muscimol sessions of monkeys (Fig. 8d,e) compared with their respective controls. We observed a significantly greater impairment (t test, t = −3.050; df = 19; p = 0.006) in the ordering effects for PD subjects (10.02 ± 1.14%) compared with controls (6.05 ± 0.57%). A similar increase in impairment (paired t test, t = −2.167; df = 30; p = 0.035) was observed for the monkeys during post-muscimol sessions (6.99 ± 0.49%) compared with pre-muscimol (5.91 ± 0.55%) sessions.
Thus, taken together, results from PD subjects as well as from inactivation studies in monkeys demonstrate that the BG acts as a gate to control simultaneously active movement plans from interacting with each other, thereby facilitating the parallel to serial transformation necessary for the sequential organization of behavior.
Discussion
Although previous studies have provided evidence of parallel representations of goals, the implications of such architecture for serial order behavior were not explored. Here, we causally tested, for the first time, a critical prediction of queuing models, providing evidence that BG in primates instantiate a form of queuing that transforms parallel movement representations into serial representations, enabling sequential saccades.
Parallel representations of saccade goals
The processing of saccades involves a visual stage that selects a target and a movement planning stage that prepares the response (Schall and Thompson, 1999). Thus, an important question is whether saccade averaging reflects computations occurring between parallel sensory representations or concurrent movement planning. As opposed to other studies (Ottes et al., 1985; Chou et al., 1999), we presented stimuli at wide angular separations (≥90°), suggesting that averaging is not a consequence of proximity grouping. We also observed a qualitative difference in the type of averaging based on the type of instructions provided (Bhutani et al., 2012). This effect is likely to reflect differences in movement planning between FOLLOW and REDIRECT tasks and is unlikely to be a consequence of visual selection per se. Furthermore, as shown by Bhutani et al. (2012), the latencies of such averaged saccades are comparable with target-directed saccades, suggesting that these saccades had sufficient time for perceptual selection. Finally, the effect of confusing first and second saccades, particularly at shorter TSDs, was reduced by having two targets of different colors.
The greater extent of averaged saccades in PD subjects further corroborated that saccade averaging reflects incomplete response selection. Most importantly, this increase was more at higher RPTs, when the two movement plans overlapped more, therefore requiring a greater degree of control (Fig. 7b). Averaging of movement plans has also been reported by Horak et al. (1992), albeit in the skeletomotor domain. They observed that whereas non-PD subjects successfully deploy a “hip synergy” or an “ankle synergy” but not both, to stabilize posture after perturbation, PD patients often exhibit a dysfunctional “blend” of both synergies.
Inhibitory control of sequential movements
Performance in the FOLLOW task can be explained by the sequential yet concurrent activation of two accumulators, GO1 and GO2, representing the two concurrent movement plans associated with a saccade from FP to IT and a saccade from IT to FT, respectively (Camalier et al., 2007; Ludwig et al., 2007; Ray et al., 2012). Because of stochastic accumulation, reversals in the order of sequential saccades could occur when the GO2 process reaches threshold before the GO1 process. In such cases, saccades would be executed first to the FT. Given the observed stochasticity, which can be estimated from the spread of no-step reaction times, independent accumulators generate ∼10–20% of such order reversals in the absence of any control (Ray et al., 2012). Because the observed number of such errors is much lower, we propose that such occurrences are kept minimal by inhibitory mechanisms within BG that delay the accumulation of the second movement plan.
Although we did not directly assess inhibitory control, the contribution of BG to inhibitory control was assessed for a subset of PD subjects on the REDIRECT task (Joti et al., 2007). A race model analogous to the countermanding or stop-signal task that measures the stop signal reaction time (Logan, 1994) showed that subjects with increased saccade averaging also took longer than controls to inhibit planned responses. Impaired inhibitory control is also a consistent feature across studies that have assessed inhibitory control in PD subjects (Carl and Wurtz, 1985; Chan et al., 2005; Swann et al., 2011).
The effect of muscimol on curved saccades also suggests impaired inhibitory control. Occurrences of curved saccades suggest that competition between saccade goals can continue even during saccade execution. Neurophysiologically, an increase in distractor-related firing activity in cells of SC at the time of saccade initiation has been implicated with increased curvature toward the distractor location (McPeek et al., 2003; Port and Wurtz, 2003). Because the SC receives inhibitory input from SNpr, our observation of saccade curvature to the FT is consistent with a loss of inhibitory control. In contrast, inhibition of distractor-related activity might mediate saccade curvature away from the distractor (Doyle and Walker, 2001). Although we observed curvature away from FT in the control condition, the extent was not affected by muscimol. The likely explanation could be that the FT represented a potential saccade goal, whereas in the study by Doyle and Walker (2001), distractor locations never represented saccade goals.
Mechanism of inhibitory control in BG
A well-characterized GABA-mediated input from SNpr to SC (Hikosaka and Wurtz, 1983) could instantiate the inhibitory control required during sequential behavior. Because connections from caudate to SNpr are mediated by the direct and indirect pathways (Smith et al., 1998), our inactivation experiments suggest that inhibitory control of sequential eye movements maybe mediated by the indirect pathway, whose normal functioning presumably prevents movement initiation. Silencing the caudate is thus expected to increase inhibition onto cells of the SNpr through decreased excitation from the STN and increased inhibition by the external segment of the globus pallidus. Consequently, this should decrease the activity of inhibitory neurons projecting from the SNpr to the SC, which should further disinhibit the SC. Thus, a general deficit in BG-mediated control may compromise queuing of concurrent movement plans.
Although the effect of muscimol on the indirect pathway provides a simple interpretation of the results, it appears to be in opposition to the “standard model” of PD that assumes the indirect pathway to be potentiated, which should produce less, not more, midways. However, studies using a variety of tasks (Carl and Wurtz, 1985; Chan et al., 2005; Swann et al., 2011) have provided converging evidence that PD behavior is better characterized by a loss of inhibitory control. In the context of the standard model, this implies that either forms of inhibitory control cannot be readily mapped to the indirect pathway or the standard model may require revaluation.
Alternately, the mapping of inhibitory control onto BG circuitry may be complex. One such possibility assumes that the BG are organized along two main pathways that are mutually antagonistic: (1) an excitatory pathway from the STN to the SNpr, the main output nucleus of BG, and (2) an inhibitory pathway from striatum to SNpr (Parent and Hazrati, 1993). Interactions between these pathways may focus selection of the desired movement and inhibit competing movements, thereby preventing potentially conflicting motor plans to be coactive (Mink, 1996). Any disturbance in the balance of these two pathways as a result of PD or by adding muscimol may produce the deficits observed in this study. The importance of the STN in context of queuing is also substantiated by our findings that the extent of hypometric saccades in REDIRECT task is modulated by DBS of the STN. Thus, the STN is in a privileged position to modulate response selection through inhibitory control (Aron et al., 2007; Frank et al., 2007; Isoda and Hikosaka, 2008; Munakata et al., 2011). The role of the STN in movement queuing is supported by studies showing that the STN delays inappropriate motor action when faced with a conflicting situation (Brittain et al., 2012; Zaghloul et al., 2012).
Alternatively or additionally, the control of response queuing maybe intrinsic to the caudate nucleus through lateral inhibition via collaterals of GABAergic projection neurons (Czubayko and Plenz, 2002; Koós et al., 2004). This mechanism has been the focus of many BG models of response selection and queuing (Groves, 1983; Beiser and Houk, 1998). In addition, feedforward inhibition from GABA-expressing fast-spiking interneurons is also intrinsic to the caudate nucleus (Koós and Tepper, 1999; Gerfen and Surmeier, 2011). Although the strength of such inhibition appears small given the scarcity of local inhibitory neurons (Rymar et al., 2004; Tepper and Plenz, 2005), the number of receptors in the projection neurons maybe large enough (Koós and Tepper, 1999) to be sensitive to the effect of muscimol injections, decreasing the overall activity from the caudate nucleus.
The mechanism of inhibitory control in BG also has bearing on whether response queuing acts to delay concurrent motor plans or prevents simultaneous execution of saccades. If such inhibitory control is intrinsic to BG itself, then it is likely that impaired queuing during movement planning produces saccade averaging (under the assumption that BG are not involved in online saccade control). In contrast, if disinhibition of SC from the BG allows both movement plans access to the oculomotor circuitry in the brainstem, then simultaneous execution of two saccades could produce saccade averaging. If the locus of interaction is intrinsic to the SC itself, impaired queuing either during movement planning or execution could produce saccade averaging. This is because the SC, in addition to its well-defined role in movement planning, has also been implicated in the online control of saccades (Waitzman et al., 1988; Guitton et al., 1990; Munoz and Guitton, 1991; Soetedjo et al., 2002). Moreover, representations of curved saccade trajectories (McPeek et al., 2003; Port and Wurtz, 2003) are also evident in the activity of SC neurons.
Footnotes
This work was supported by grants from the Department of Biotechnology, Government of India and the National Brain Research Centre. N.B. was supported by a fellowship from the University Grants Commission, Government of India. We thank Sheldon Hoffmann (Reflective Computing) for software support and Dr. Balakrishna Shetty for his advice and help in MR imaging.
References
- Alexander GE, DeLong MR, Strick PL. Parallel organization of functionally segregated circuits linking basal ganglia and cortex. Annu Rev Neurosci. 1986;9:357–381. doi: 10.1146/annurev.ne.09.030186.002041. [DOI] [PubMed] [Google Scholar]
- Aron AR, Behrens TE, Smith S, Frank MJ, Poldrack RA. Triangulating a cognitive control network using diffusion-weighted magnetic resonance imaging (MRI) and functional MRI. J Neurosci. 2007;27:3743–3752. doi: 10.1523/JNEUROSCI.0519-07.2007. [DOI] [PMC free article] [PubMed] [Google Scholar]
- Averbeck BB, Chafee MV, Crowe DA, Georgopoulos AP. Parallel processing of serial movements in prefrontal cortex. Proc Natl Acad Sci U S A. 2002;99:13172–13177. doi: 10.1073/pnas.162485599. [DOI] [PMC free article] [PubMed] [Google Scholar]
- Barone P, Joseph JP. Prefrontal cortex and spatial sequencing in macaque monkey. Exp Brain Res. 1989;78:447–464. doi: 10.1007/BF00230234. [DOI] [PubMed] [Google Scholar]
- Becker W, Jürgens R. An analysis of the saccadic system by means of double-step stimuli. Vision Res. 1979;19:967–983. doi: 10.1016/0042-6989(79)90222-0. [DOI] [PubMed] [Google Scholar]
- Beiser DG, Houk JC. Model of cortico-basal ganglionic processing: encoding the serial order of sensory events. J Neurophysiol. 1998;79:3168–3188. doi: 10.1152/jn.1998.79.6.3168. [DOI] [PubMed] [Google Scholar]
- Bhutani N, Ray S, Murthy A. Is saccade averaging determined by visual processing or movement planning? J Neurophysiol. 2012;108:3161–3171. doi: 10.1152/jn.00344.2012. [DOI] [PubMed] [Google Scholar]
- Brittain JS, Watkins KE, Joundi RA, Ray NJ, Holland P, Green AL, Aziz TZ, Jenkinson N. A role for the subthalamic nucleus in response inhibition during conflict. J Neurosci. 2012;32:13396–13401. doi: 10.1523/JNEUROSCI.2259-12.2012. [DOI] [PMC free article] [PubMed] [Google Scholar]
- Brown JW, Bullock D, Grossberg S. How laminar frontal cortex and basal ganglia circuits interact to control planned and reactive saccades. Neural Netw. 2004;17:471–510. doi: 10.1016/j.neunet.2003.08.006. [DOI] [PubMed] [Google Scholar]
- Bullock D. Adaptive neural models of competitive queuing and timing in fluent action. Trends Cogn Sci. 2004;8:426–433. doi: 10.1016/j.tics.2004.07.003. [DOI] [PubMed] [Google Scholar]
- Bullock D, Rhodes B. Competitive queuing for serial planning and performance. In: Arbib MA, editor. Handbook of brain theory and neural networks. Vol 2. Cambridge, MA: Massachusetts Institute of Technology; 2003. pp. 241–244. [Google Scholar]
- Camalier CR, Gotler A, Murthy A, Thompson KG, Logan GD, Palmeri TJ, Schall JD. Dynamics of saccade target selection: race model analysis of double step and search step saccade production in human and macaque. Vision Res. 2007;47:2187–2211. doi: 10.1016/j.visres.2007.04.021. [DOI] [PMC free article] [PubMed] [Google Scholar]
- Carl J, Wurtz R. Asymmetry of saccadic control in patients with hemi-Parkinson's disease. Invest Opthalmol Vis Sci. 1985;26:258. [Google Scholar]
- Chan F, Armstrong IT, Pari G, Riopelle RJ, Munoz DP. Deficits in saccadic eye movement control in Parkinson's disease. Neuropsychologia. 2005;43:784–796. doi: 10.1016/j.neuropsychologia.2004.06.026. [DOI] [PubMed] [Google Scholar]
- Chou IH, Sommer MA, Schiller PH. Express averaging saccades in monkeys. Vision Res. 1999;39:4200–4216. doi: 10.1016/S0042-6989(99)00133-9. [DOI] [PubMed] [Google Scholar]
- Cisek P. Cortical mechanisms of action selection: the affordance competition hypothesis. Philos Trans R Soc Lond B Biol Sci. 2007;362:1585–1599. doi: 10.1098/rstb.2007.2054. [DOI] [PMC free article] [PubMed] [Google Scholar]
- Coëffé C, O'Regan JK. Reducing the influence of non-target stimuli on saccade accuracy: predictability and latency effects. Vision Res. 1987;27:227–240. doi: 10.1016/0042-6989(87)90185-4. [DOI] [PubMed] [Google Scholar]
- Czubayko U, Plenz D. Fast synaptic transmission between striatal spiny projection neurons. Proc Natl Acad Sci U S A. 2002;99:15764–15769. doi: 10.1073/pnas.242428599. [DOI] [PMC free article] [PubMed] [Google Scholar]
- Davelaar EJ. A computational study of conflict-monitoring at two-levels of processing: reaction time distributional analyses and hemodynamic responses. Brain Res. 2008;1202:109–119. doi: 10.1016/j.brainres.2007.06.068. [DOI] [PubMed] [Google Scholar]
- Doyle M, Walker R. Curved saccade trajectories: voluntary and reflexive saccades curve away from irrelevant distractors. Exp Brain Res. 2001;139:333–344. doi: 10.1007/s002210100742. [DOI] [PubMed] [Google Scholar]
- Farooqui AA, Bhutani N, Kulashekhar S, Behari M, Goel V, Murthy A. Impaired conflict monitoring in Parkinson's disease patients during an oculomotor redirect task. Exp Brain Res. 2011;208:1–10. doi: 10.1007/s00221-010-2432-y. [DOI] [PubMed] [Google Scholar]
- Findlay JM. Global processing of saccadic eye movements. Vision Res. 1982;22:1033–1045. doi: 10.1016/0042-6989(82)90040-2. [DOI] [PubMed] [Google Scholar]
- Frank MJ, Samanta J, Moustafa AA, Sherman SJ. Hold your horses: impulsivity, deep brain stimulation, and medication in parkinsonism. Science. 2007;318:1309–1312. doi: 10.1126/science.1146157. [DOI] [PubMed] [Google Scholar]
- Fujii N, Graybiel AM. Representation of action sequence boundaries by macaque prefrontal cortical neurons. Science. 2003;301:1246–1249. doi: 10.1126/science.1086872. [DOI] [PubMed] [Google Scholar]
- Funahashi S, Inoue M, Kubota K. Delay period activity in the primate prefrontal cortex encoding multiple spatial positions and their order of presentation. Behav Brain Res. 1997;84:203–223. doi: 10.1016/S0166-4328(96)00151-9. [DOI] [PubMed] [Google Scholar]
- Gerfen CR, Surmeier DJ. Modulation of striatal projection systems by dopamine. Annu Rev Neurosci. 2011;34:441–466. doi: 10.1146/annurev-neuro-061010-113641. [DOI] [PMC free article] [PubMed] [Google Scholar]
- Glasspool DW, Houghton G. Serial order and consonant-vowel structure in a graphemic output buffer model. Brain Lang. 2005;94:304–330. doi: 10.1016/j.bandl.2005.01.006. [DOI] [PubMed] [Google Scholar]
- Grossberg S. A theory of human memory: Self-organization and performance of sensory-motor codes, maps and plans. In: Rosen R, Snell F, editors. Progress in theoretical biology. Vol 5. New York: Academic; 1978. pp. 233–574. [Google Scholar]
- Groves PM. A theory of the functional organization of the neostriatum and the neostriatal control of voluntary movement. Brain Res. 1983;286:109–132. doi: 10.1016/0165-0173(83)90011-5. [DOI] [PubMed] [Google Scholar]
- Guitton D, Munoz DP, Galiana HL. Gaze control in the cat: studies and modelling of the coupling between orienting eye and head movements in different behavioral tasks. J Neurophysiol. 1990;64:509–531. doi: 10.1152/jn.1990.64.2.509. [DOI] [PubMed] [Google Scholar]
- Hanes DP, Patterson WF, 2nd, Schall JD. Role of frontal eye fields in countermanding saccades: visual, movement and fixation activity. J Neurophysiol. 1998;79:817–834. doi: 10.1152/jn.1998.79.2.817. [DOI] [PubMed] [Google Scholar]
- Hikosaka O, Wurtz RH. Visual and oculomotor functions of monkey substantia nigra pars reticulata. IV. Relation of substantia nigra to superior colliculus. J Neurophysiol. 1983;49:1285–1301. doi: 10.1152/jn.1983.49.5.1285. [DOI] [PubMed] [Google Scholar]
- Hoehn MM, Yahr MD. Parkinsonism: onset, progression and mortality. Neurology. 1967;17:427–442. doi: 10.1212/WNL.17.5.427. [DOI] [PubMed] [Google Scholar]
- Hogg RV, Craig AT. Introduction to mathematical statistics. Ed 5. New York: MacMillan; 1995. [Google Scholar]
- Holm S. A simple sequentially rejective multiple test procedure. Scand J Stat. 1979;6:65–70. [Google Scholar]
- Holmqvist K, Nystrom M, Anderson R, Dewhurst R, Jarodzka K, Van de Weijer J. Eye tracking: a comprehensive guide to methods and measures. Oxford: Oxford UP; 2011. [Google Scholar]
- Horak FB, Nutt J, Nashner LM. Postural inflexibility in parkinsonian subjects. J Neurol Sci. 1992;11:46–58. doi: 10.1016/0022-510X(92)90111-W. [DOI] [PubMed] [Google Scholar]
- Hornof AJ, Halverson T. Cleaning up systematic error in eye-tracking data by using required fixation location. Behav Res Methods Instrum Comput. 2002;34:592–604. doi: 10.3758/BF03195487. [DOI] [PubMed] [Google Scholar]
- Houk JC, Bastianen C, Fansler D, Fishbach A, Fraser D, Reber PJ, Roy SA, Simo LS. Action selection and refinement in subcortical loops through basal ganglia and cerebellum. Philos Trans R Soc Lond B Biol Sci. 2007;362:1573–1583. doi: 10.1098/rstb.2007.2063. [DOI] [PMC free article] [PubMed] [Google Scholar]
- Isoda M, Hikosaka O. Role for subthalamic nucleus neurons in switching from automatic to controlled eye movement. J Neurosci. 2008;28:7209–7218. doi: 10.1523/JNEUROSCI.0487-08.2008. [DOI] [PMC free article] [PubMed] [Google Scholar]
- Joti P, Kulashekhar S, Behari M, Murthy A. Impaired inhibitory control in patients with Parkinson's disease. Exp Brain Res. 2007;177:447–457. doi: 10.1007/s00221-006-0687-0. [DOI] [PubMed] [Google Scholar]
- Keele SW. Movement control in skilled motor performance. Psychol Bull. 1968;70:378–403. [Google Scholar]
- Koós T, Tepper JM. Inhibitory control of neostriatal projection neurons by GABAergic interneurons. Nat Neurosci. 1999;2:467–472. doi: 10.1038/8138. [DOI] [PubMed] [Google Scholar]
- Koós T, Tepper JM, Wilson CJ. Comparison of IPSCs evoked by spiny and fast-spiking neurons in the neostriatum. J Neurosci. 2004;24:7916–7922. doi: 10.1523/JNEUROSCI.2163-04.2004. [DOI] [PMC free article] [PubMed] [Google Scholar]
- Kornylo K, Dill N, Saenz M, Krauzlis RJ. Cancelling of pursuit and saccadic eye movements in humans and monkeys. J Neurophysiol. 2003;89:2984–2999. doi: 10.1152/jn.00859.2002. [DOI] [PubMed] [Google Scholar]
- Lashley KS. Cerebral mechanisms in behavior. New York: Wiley; 1951. The problem of cerebral behavior; pp. 112–136. [Google Scholar]
- Logan GD. On the ability to inhibit thought and action: a user's guide to the stop signal paradigm. In: Dagenbach D, Carr TH, editors. Inhibitory processes in attention, memory and language. San Diego: Academic; 1994. pp. 189–239. [Google Scholar]
- Ludwig CJ, Mildinhall JW, Gilchrist ID. A population coding account for systematic variation in saccadic dead time. J Neurophysiol. 2007;97:795–805. doi: 10.1152/jn.00652.2006. [DOI] [PubMed] [Google Scholar]
- McPeek RM, Keller EL. Short term priming, concurrent processing, and saccade curvature during a target selection task in the monkey. Vision Res. 2001;41:785–800. doi: 10.1016/S0042-6989(00)00287-X. [DOI] [PubMed] [Google Scholar]
- McPeek RM, Skavenski AA, Nakayama K. Concurrent processing of saccades in visual search. Vision Res. 2000;40:2499–2516. doi: 10.1016/S0042-6989(00)00102-4. [DOI] [PubMed] [Google Scholar]
- McPeek RM, Han JH, Keller EL. Competition between saccade goals in the superior colliculus produces saccade curvature. J Neurophysiol. 2003;89:2577–2590. doi: 10.1152/jn.00657.2002. [DOI] [PubMed] [Google Scholar]
- Mink JW. The basal ganglia: focused selection and inhibition of competing motor programs. Prog Neurobiol. 1996;50:381–425. doi: 10.1016/S0301-0082(96)00042-1. [DOI] [PubMed] [Google Scholar]
- Munakata Y, Herd SA, Chatham CH, Depue BE, Banich MT, O'Reilly RC. A unified framework for inhibitory control. Trends Cogn Sci. 2011;15:453–459. doi: 10.1016/j.tics.2011.07.011. [DOI] [PMC free article] [PubMed] [Google Scholar]
- Munoz DP, Guitton D. Control of orienting gaze shifts by the tectoreticulospinal system in the head-free cat. II. Sustained discharges during motor preparation and fixation. J Neurophysiol. 1991;66:1624–1641. doi: 10.1152/jn.1991.66.5.1624. [DOI] [PubMed] [Google Scholar]
- Murthy A, Ray S, Shorter SM, Priddy EG, Schall JD, Thompson KG. Frontal eye contributions to rapid corrective saccades. J Neurophysiol. 2007;97:1457–1469. doi: 10.1152/jn.00433.2006. [DOI] [PubMed] [Google Scholar]
- Mushiake H, Saito N, Sakamoto K, Itoyama Y, Tanji J. Activity in the lateral prefrontal cortex reflects multiple steps of future events in action plans. Neuron. 2006;50:631–641. doi: 10.1016/j.neuron.2006.03.045. [DOI] [PubMed] [Google Scholar]
- Norman W, Shallice T. Attention to action: willed and automatic control of behavior. In: Davidson RJ, Schwartz GE, Shapiro D, editors. Consciousness and self regulation: advances in research and theory. Vol 4. New York: Plenum; 1986. pp. 1–18. [Google Scholar]
- Ottes FP, Van Gisbergen JA, Eggermont JJ. Latency dependence of colour-based target vs nontarget discrimination by the saccadic system. Vision Res. 1985;25:849–862. doi: 10.1016/0042-6989(85)90193-2. [DOI] [PubMed] [Google Scholar]
- Parent A, Hazrati LN. Anatomical aspects of information processing in primate basal ganglia. Trends Neurosci. 1993;16:111–116. doi: 10.1016/0166-2236(93)90135-9. [DOI] [PubMed] [Google Scholar]
- Phillips AN, Segraves MA. Predictive activity in macaque frontal eye field neurons during natural scene searching. J Neurophysiol. 2010;103:1238–1252. doi: 10.1152/jn.00776.2009. [DOI] [PMC free article] [PubMed] [Google Scholar]
- Port NL, Wurtz RH. Sequential activity of simultaneously recorded neurons in the superior colliculus during curved saccades. J Neurophysiol. 2003;90:1887–1903. doi: 10.1152/jn.01151.2002. [DOI] [PubMed] [Google Scholar]
- Ramakrishnan A, Sureshbabu R, Murthy A. Understanding how the brain changes its mind: microstimulation in the macaque frontal eye field reveals how saccade plans are changed. J Neurosci. 2012;32:4457–4472. doi: 10.1523/JNEUROSCI.3668-11.2012. [DOI] [PMC free article] [PubMed] [Google Scholar]
- Ray S, Schall JD, Murthy A. Programming of double-step saccade sequences: modulation by cognitive control. Vision Res. 2004;44:2707–2718. doi: 10.1016/j.visres.2004.05.029. [DOI] [PubMed] [Google Scholar]
- Ray S, Pouget P, Schall JD. Functional distinction between visuomovement and movement neurons in macaque frontal eye field during saccade countermanding. J Neurophysiol. 2009;102:3091–3100. doi: 10.1152/jn.00270.2009. [DOI] [PMC free article] [PubMed] [Google Scholar]
- Ray S, Bhutani N, Kapoor V, Murthy A. Trans-saccadic integration of visual and motor planning during sequential eye movements. Exp Brain Res. 2011;215:13–25. doi: 10.1007/s00221-011-2866-x. [DOI] [PubMed] [Google Scholar]
- Ray S, Bhutani N, Murthy A. Mutual inhibition and capacity sharing during parallel preparation of serial eye movements. J Vision. 2012;12(3):1–22. doi: 10.1167/12.3.17. 17. [DOI] [PubMed] [Google Scholar]
- Reddi BA, Carpenter RH. The influence of urgency on decision time. Nat Neurosci. 2000;3:827–830. doi: 10.1038/77739. [DOI] [PubMed] [Google Scholar]
- Redgrave P, Prescott TJ, Gurney K. The basal ganglia: a vertebrate solution to the selection problem? Neuroscience. 1999;89:1009–1023. doi: 10.1016/S0306-4522(98)00319-4. [DOI] [PubMed] [Google Scholar]
- Resulaj A, Kiani R, Wolpert DM, Shadlen MN. Changes of mind in decision-making. Nature. 2009;461:263–266. doi: 10.1038/nature08275. [DOI] [PMC free article] [PubMed] [Google Scholar]
- Rymar VV, Sasseville R, Luk KC, Sadikot AF. Neurogenesis and stereological morphometry of calretinin-immunoreactive interneurons of the neostriatum. J Comp Neurol. 2004;469:325–339. doi: 10.1002/cne.11008. [DOI] [PubMed] [Google Scholar]
- Schall JD, Thompson KG. Neural selection and control of visually guided eye movements. Annu Rev Neurosci. 1999;22:241–259. doi: 10.1146/annurev.neuro.22.1.241. [DOI] [PubMed] [Google Scholar]
- Sharika KM, Ramakrishnan A, Murthy A. Control of predictive error correction during a saccadic double-step task. J Neurophysiol. 2008;100:2757–2770. doi: 10.1152/jn.90238.2008. [DOI] [PubMed] [Google Scholar]
- Smit AC, Van Gisbergen JA. An analysis of curvature of fast and slow human saccades. Exp Brain Res. 1990;81:335–345. doi: 10.1007/BF00228124. [DOI] [PubMed] [Google Scholar]
- Smith Y, Bevan MD, Shink E, Bolam JP. Microcircuitry of the direct and indirect pathways of the basal ganglia. Neuroscience. 1998;86:353–387. doi: 10.1016/S0306-4522(98)00004-9. [DOI] [PubMed] [Google Scholar]
- Soetedjo R, Kaneko CR, Fuchs AF. Evidence that the superior colliculus participates in the feedback control of saccadic eye movements. J Neurophysiol. 2002;87:679–695. doi: 10.1152/jn.00886.2000. [DOI] [PubMed] [Google Scholar]
- Swann N, Poizner H, Houser M, Gould S, Greenhouse I, Cai W, Strunk J, George J, Aron AR. Deep brain stimulation of the subthalamic nucleus alters the cortical profile of response inhibition in the beta frequency band: a scalp EEG study in Parkinson's disease. J Neurosci. 2011;31:5721–5729. doi: 10.1523/JNEUROSCI.6135-10.2011. [DOI] [PMC free article] [PubMed] [Google Scholar]
- Tepper JM, Plenz D. Microcircuits in the neostriatum: striatal cell types and their interaction. In: Grillner S, Graybiel A, editors. Microcircuits: the interface between neurons and global brain function, Dahlem Workshop Report 93. Cambridge MA: Massachusetts Institute of Technology; 2005. [Google Scholar]
- Tian J, Schlag J, Schlag-Rey M. Testing quasi-visual neurons in the monkey's frontal eye field with the triple-step paradigm. Exp Brain Res. 2000;130:433–440. doi: 10.1007/s002210050047. [DOI] [PubMed] [Google Scholar]
- Viviani P, Swensson R. Saccadic eye movements to peripherally discriminated visual targets. J Exp Psychol Hum Percept Perform. 1982;8:113–126. doi: 10.1037/0096-1523.8.1.113. [DOI] [PubMed] [Google Scholar]
- Waitzman DM, Ma TP, Optican LM, Wurtz RH. Superior colliculus neurons provide the saccadic motor error signal. Exp Brain Res. 1988;72:649–652. doi: 10.1007/BF00250610. [DOI] [PubMed] [Google Scholar]
- Zaghloul KA, Weidemann CT, Lega BC, Jaggi JL, Baltuch GH, Kahana MJ. Neuronal activity in the human subthalamic nucleus encodes decision conflict during action selection. J Neurosci. 2012;32:2453–2460. doi: 10.1523/JNEUROSCI.5815-11.2012. [DOI] [PMC free article] [PubMed] [Google Scholar]
- Zambarbieri D, Schmid R, Ventre J. Saccadic eye movements to predictable visual and auditory targets. In: O'Regan JK, Levy-Schoen A, editors. Eye movements: from physiology to cognition. Amsterdam: Elsevier; 1987. pp. 131–140. [Google Scholar]