Figure 6.
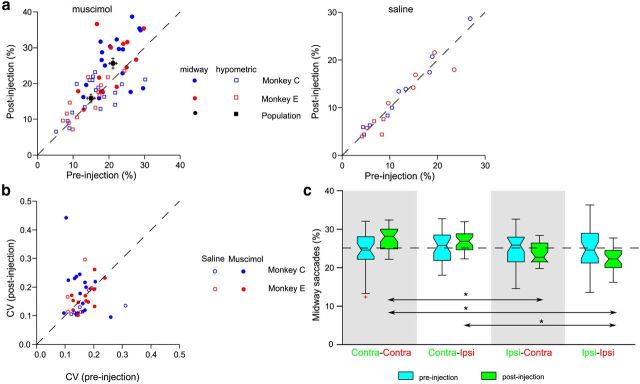
Increased midway saccades by muscimol injections. a, Scatter plot of the extent of hypometric saccades (squares) and midway saccades (circles) for monkeys C (blue) and E (red) in post-muscimol versus pre-muscimol injection sessions during the FOLLOW task. The right panel plots the extent of midway (circles) and hypometric (squares) saccades for post-saline versus pre-saline injection sessions. Black circles and squares represent the mean values. b, Scatter plot of the CV of the endpoint scatter in no-step trials in post-injection versus pre-injection conditions for monkeys C (blue) and E (red). Filled circles represent data for muscimol sessions; open circles represent data for saline injection sessions. c, Box plots of the extent of midway saccades in the Contra–Contra, Contra–Ipsi, Ipsi–Contra, and Ipsi–Ipsi conditions for pre-muscimol (cyan) and post-muscimol (green) injection sessions. The effect was significantly greater when the IT was presented contralateral to the injection site. Box plot conventions: whiskers, range; box, interquartile range; notch, 95% confidence limit; line through the center of the box, median; red plus, outlier. Significant differences are marked by the asterisks.

