Figure 7.

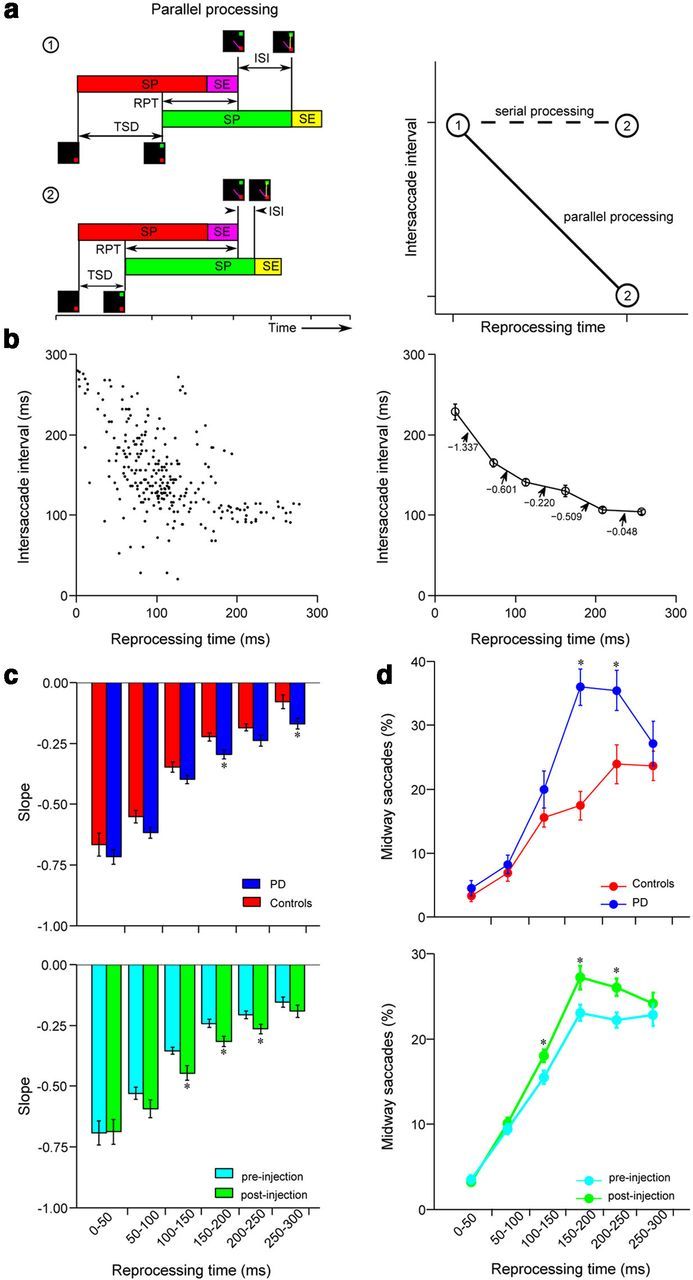
Increased parallel planning in PD subjects and after muscimol injections in monkeys. a, Left, Schematic showing parallel processing of two saccades for low (1) and high (2) RPT conditions. SP and SE stand for saccade planning and saccade execution stages, respectively. In the low RPT condition, there is less overlap between two saccades compared with the high RPT condition. Right, Schematic showing the plot of ISI versus RPT. For serial planning, ISI is invariant of RPT, and the slope of ISI versus RPT is expected to be 0. If the two saccades are being planned in parallel, then ISI should decrease with increasing RPT. b, Plot of ISI versus RPT for a subject. The left shows data for each step trial. In the right, the RPT was binned into 50 ms intervals, and the corresponding values of ISI and slopes were calculated. c, Histogram distribution of slopes for human subjects (top) and monkeys (bottom) describing the processing rate as a function of RPT in the FOLLOW task. d, Percentage of midway saccades for human subjects (top) and monkeys (bottom) as a function of RPT. Data for both monkeys were pooled together. Error bars represent the SEMs. Significant differences are marked by asterisks.
