

Abstract
The cortico-basal ganglia network has been proposed to consist of parallel loops serving distinct functions. However, it is still uncertain how the content of processed information varies across different loops and how it is related to the functions of each loop. We investigated this issue by comparing neuronal activity in the dorsolateral (sensorimotor) and dorsomedial (associative) striatum, which have been linked to habitual and goal-directed action selection, respectively, in rats performing a dynamic foraging task. Both regions conveyed significant neural signals for the animal's goal choice and its outcome. Moreover, both regions conveyed similar levels of neural signals for action value before the animal's goal choice and chosen value after the outcome of the animal's choice was revealed. However, a striking difference was found in the persistence of neural signals for the animal's chosen action. Signals for the animal's goal choice persisted in the dorsomedial striatum until the outcome of the animal's next goal choice was revealed, whereas they dissipated rapidly in the dorsolateral striatum. These persistent choice signals might be used for causally linking temporally discontiguous responses and their outcomes in the dorsomedial striatum, thereby contributing to its role in goal-directed action selection.
Introduction
The cortico-basal ganglia (BG) network is thought to consist of parallel segregated loops serving distinct functions (Alexander et al., 1986; Alexander and Crutcher, 1990), although there exist substantial degrees of overlap and crosstalk between different loops (Haber and Knutson, 2010). The number of proposed loops varies, but they include at least three consisting of sensorimotor, associative, and limbic loops (Alexander and Crutcher, 1990; Balleine et al., 2007; Redgrave et al., 2010; Ito and Doya, 2011). In rats, dorsolateral (DLS) and dorsomedial striatum (DMS) are mainly connected with sensorimotor and medial prefrontal cortex, respectively (Voorn et al., 2004), and therefore regarded as sensorimotor and associative divisions of the striatum, respectively. Numerous studies have consistently shown that disruptive manipulations selective to the DLS alter rat's choice behavior so that it is less habitual and more goal-directed, whereas those selective to the DMS induce the opposite effects (for review, see Yin and Knowlton, 2006; Balleine et al., 2009; White, 2009; Redgrave et al., 2010; Devan et al., 2011). These results provide strong evidence for the involvement of the rat DLS and DMS in different aspects of action selection. Therefore, it is expected that neurons in the DLS and DMS convey signals related to habitual and goal-directed action selection, respectively [i.e., action selection based on stimulus-response (S-R) and response-outcome (R-O) association, respectively]. Such physiological evidence is needed not only to ascertain functional segregation between the DLS and DMS, but also to gain insights about how the content of information processed in each structure can support its specific functions. Surprisingly, however, previous physiological studies have found similar types of neuronal activity related to sensory stimuli, animal's responses, and/or response outcomes across the DLS and DMS in rats performing various instrumental learning tasks (Kimchi et al., 2009; Stalnaker et al., 2010; Thorn et al., 2010).
To resolve this discrepancy, we reexamined this issue in the present study using a dynamic foraging task (Huh et al., 2009; Sul et al., 2011). In this task, a reward was delivered stochastically in each trial, rending the animal's responses across successive trials only weakly correlated. Hence, this task allowed us to probe neuronal activity related to the animal's response and its outcome in the current and previous trials separately. This task is also advantageous for examining value-related neuronal activity because expected reward values vary dynamically across trials depending on the history of the animal's choices and their outcomes. By exploiting these features, we compared neuronal activity related to the animal's responses, their outcomes, and reward values in the DLS and DMS. We found a striking difference in the persistent neural activity related to the animal's response, which might reflect functional differences between the DLS and DMS in habitual versus goal-direction action selection.
Materials and Methods
Subjects.
Three young male Sprague Dawley rats (∼8–10 weeks old, 300–350 g) were used. The animals were individually housed in a colony room and initially allowed ad libitum access to food and water. They were then handled extensively while adapting to water deprivation (maintained at >80% ad libitum body weight) for 1 week, and, once behavioral training began, restricted to 30 min of access to water after finishing one behavioral session per day. Experiments were performed in the dark phase of a 12 h light/dark cycle. The experimental protocol was approved by the Ethics Review Committee for Animal Experimentation of the Ajou University School of Medicine.
Behavioral task.
The animals were trained in a dynamic foraging task on a modified T-maze (Fig. 1A) as in our previous studies (Huh et al., 2009; Sul et al., 2011). The animals performed four blocks of 35–45 trials (35 plus a random number drawn from a geometric mean of 5 with the maximum set at 45), with each block associated with one of the following four combinations of reward probabilities at the left and right goals: 0.71:0.12, 0.63:0.21, 0.21:0.63, and 0.12:0.72. The sequence of reward probabilities was determined randomly with the constraint that the higher-reward probability goal always changed its location at the beginning of a new block. The animals were required to detect changes in block reward probabilities by trial and error, because reward probabilities changed across blocks without any explicit sensory cues. In each trial, the same amount of water reward (30 μl) was delivered stochastically and independently with a given set of probabilities at the two goals. Hence, water could be available at neither, either, or both goals in a given trial. If the delivery of water was scheduled in a given trial at the unvisited goal, it remained available until the animal's next visit, but without any additional water delivery (i.e., without accumulation). Thus, the probability for obtaining water with a particular goal choice increased with the number of consecutive choices at the opposite goal. This task is referred to as a dual assignment with hold (DAWH) task, and the optimal strategy in this task requires the animal to visit the goal with the lower reward probability occasionally after several consecutive visits to the goal with the higher reward probability (Lau and Glimcher, 2005; Huh et al., 2009).
Figure 1.

Behavioral task, recording sites, and choice behavior. A, Dynamic foraging task. Rats were allowed to choose freely between two goals (blue circles) that delivered water probabilistically. The task was divided into delay (D), go (G), approach to reward (A), reward (Rw), and return (Rt) stages. The dotted lines indicate approximate boundaries between behavioral stages. The onset of the delay stage (blue dotted line) marks the beginning of a trial. Arrows indicate alternative movement directions. Scale bar, 10 cm. B, Recording sites. Each diagram is a coronal section view of the brain at 0.48 mm anterior to bregma for one rat (left hemisphere, n = 1 animal; right hemisphere, n = 2 animals). Circles represent estimated recording sites from which 1–5 single units were recorded simultaneously. Scale bar, 1 mm. Modified with permission from Elsevier (Paxinos and Watson, 1998). C, The probability to choose the left goal (PL) is plotted in moving average of 10 trials (gray, actual choice of the animal; black, PL given by a model-based RL algorithm) for one example recording session. Vertical lines indicate block transitions. Numbers at the top indicate reward probabilities. Tick marks indicate the animal's trial-by-trial choices (top, left choice; bottom, right choice; long, rewarded trial; short, unrewarded trial). D, The graphs show influences of recent within-trial choice-outcome pairs (left), pairs of previous choice outcome (t−1) and other choices (t−2 to t−5; center), and pairs of the previous choice (t−1) and other outcome pairs (t−2 to t−5; right) on the current choice of the animals. A positive coefficient indicates that a reward influenced the animal to repeat the same goal choice of a given choice-outcome pair. Asterisks indicate that the coefficients are statistically significant (t test, p < 0.05). Error bars are SEM.
Behavioral stages.
Each trial consisted of the delay, go, approach to reward, reward consumption, and return stages (Fig. 1A) (Kim et al., 2009). A trial began with the delay stage when the animal returned from either goal to the central stem via the lateral alley and broke the central photobeam (Fig. 1A, blue dotted line). The central connecting bridge was kept elevated for 2 s preventing the animal from moving forward. The bridge was lowered at the end of the delay stage allowing the animal to navigate forward (go stage). The approach stage was the time period during which the animal ran toward either goal on the upper alley. The onset of the approach stage was determined separately for each behavioral session as the time when the left-right positions became significantly different for the left- and right-choice trials (t test, p < 0.05) for the first time near the upper branching point (Kim et al., 2009; Sul et al., 2010, 2011). Thus, the onset of the approach stage was aligned to the first behavioral manifestation of the animal's goal choice. The onset of the reward stage was the time when the animal broke the photobeam that was placed 6 cm ahead of the water-delivery nozzle, which triggered an immediate delivery of water in rewarded trials. The return stage began when the animal broke the photobeam that was placed 11 cm away from the water delivery nozzle on the lateral alley, and ended when the animal returned to the central stem and broke the central photobeam (i.e., beginning of the delay stage in the next trial). The animal's movement trajectories were monitored by tracking an array of light-emitting diodes mounted on the headstage at 60 Hz. The mean durations of the five behavioral stages were (mean ± SD) 2.00 ± 0.00 (delay), 0.9 ± 0.23 (go), 0.67 ± 0.12 (approach), 4.58 ± 1.31 (reward), and 2.24 ± 0.62 s (return stage). The mean durations of the reward stage for the rewarded and unrewarded trials were 5.71 ± 2.84 and 1.72 ± 1.07 s, respectively. Thus, the animals stayed longer in the reward area in rewarded than unrewarded trials, although the animals licked the water-delivery nozzle in most unrewarded trials as in rewarded trials.
Logistic regression analysis.
The following logistic regression model was used to estimate effects of all possible combinations of recent past choices and recent past outcomes (up to 5 trials) on the animal's goal choice (Walton et al., 2010):
 |
where PL(i) (or PR(i)) is the probability of selecting the left (or right) goal in the i-th trial. The variables R(i) and C(i) are reward delivery (0 or 1) and the left or right goal choice (1 or −1) in the i-th trial, respectively. The coefficient γjk denotes the effect of the combination of the j-th past choice and the k-th past reward and γ0 is a bias term. The numbers of total trials used in the regression for the three animals were 2428, 3357, and 2074.
Reinforcement learning model.
We used a model-based reinforcement learning (RL) algorithm that takes into consideration that the reward probability of the unchosen goal increases as a function of the number of consecutive alternative choices (“stacked probability” or SP algorithm) (Huh et al., 2009). Model parameters (α, learning rate; β, inverse temperature) were estimated for the entire dataset from each animal using a maximum likelihood procedure (Sul et al., 2011). The values of α for each animal were 0.64, 0.68, and 0.57, and those for β were 2.30, 2.50, and 2.64, respectively. For comparison, we also analyzed neural data using a model-free RL algorithm (Rescorla–Wagner rule or Q-learning model) (Sutton and Barto, 1998). The estimated values of α were 0.25, 0.34, and 0.34, and those for β were 3.59, 3.16, and 2.82, respectively, for the model-free RL algorithm.
Model comparison.
To compare performances of the logistic regression model, Rescorla–Wagner rule, and SP model, we calculated Akaike's information criteria (AIC), Bayesian information criteria (BIC) (Burnham and Anderson, 2002), and accuracy of the model's prediction for the animal's actual choices (% correct) for the entire dataset from each animal. AIC and BIC were normalized by dividing them with the number of trials for each animal. Model prediction of the animal's choices was determined by applying a leave-one-out cross-validation procedure to the behavioral data obtained from different sessions for each animal.
Unit recording.
Single units were recorded from the DLS (center of tetrodes, 0.5 mm anterior and 4.0 mm lateral to bregma; 3.5–5.9 mm ventral to brain surface) and DMS (0.5 mm anterior and 2.0 mm lateral to bregma; 3.5–5.5 mm ventral to brain surface; Fig. 1B). The DMS recording sites in the present study are somewhat posterior and lateral to our previous recording sites in the DMS (1.2 mm anterior and 1.7 mm lateral to bregma and 3.5–5.5 mm ventral to brain surface) (Kim et al., 2009) and ventral striatum (Kim et al., 2007, 2009) (1.2 m anterior and 1.7 mm lateral to bregma and 6.5–8.0 mm ventral to brain surface; 1.9 mm anterior and 1.0 mm lateral to bregma and 6.5–8.0 mm ventral to brain surface). Recording procedures are similar to those described in our previous study (Kim et al., 2009). Briefly, two sets of six tetrodes were implanted in the DMS and DLS of well-trained animals under deep sodium pentobarbital anesthesia (50 mg/kg). After at least 1 week of recovery from surgery, tetrodes were gradually lowered to obtain isolated unit signals. Once the recording began, tetrodes were advanced for a maximum of 150 μm per day. Unit signals were amplified ×10,000, filtered between 0.6–6 kHz, digitized at 32 kHz, and stored on a personal computer using a Cheetah data acquisition system. Unit signals were also recorded with the animals placed on a pedestal before and after each experimental session to examine stability of recorded unit signals. When recordings were completed, small marking lesions were made by passing an electrolytic current (50 μA, 30 s, cathodal) through one channel of each tetrode, and recording locations were verified histologically as previously described (Baeg et al., 2001).
Isolation and classification of units.
Isolation and classification of unit signals were done as in our previous study (Kim et al., 2009). Single units were isolated by manually clustering various spike waveform parameters. Only those clusters with no interspike interval <2 ms, “L-ratio” <0.2 (0.07 ± 0.04, mean ± SD), and “isolation distance” >15 (33.71 ± 17.37, mean ± SD) (Schmitzer-Torbert et al., 2005) were included in the analysis. The identity of unit signals was determined based on the clustering pattern of spike waveform parameters, averaged spike waveforms, mean discharge rates, autocorrelograms, and interspike interval histograms (Baeg et al., 2007). For those units that were recorded for two or more days, the session in which the units were most clearly isolated from background noise and other unit signals was analyzed. The recorded units were classified into putative medium spiny neurons (MSNs) and putative interneurons based on average firing rate and spike width (Fig. 2), and only putative MSNs were included in the analysis.
Figure 2.

Unit classification. Units were classified into putative MSNs and putative interneurons based on mean discharge rate during the entire recording session and the width of a filtered spike waveform. Left, Scatter plot for spike widths and mean discharge rates of all recorded units. Units were first grouped into high- (≥6.0 Hz) and low-rate (<6.0 Hz) units based on the distribution of mean firing rates of all units (right). The low-rate units were further divided into wide- (≥0.24 ms) and narrow-spiking (<0.24 ms) units based on the distribution of their spike widths (bottom). Those units with a low firing rate (<6.0 Hz) and a wide spike waveform (≥0.24 ms) were classified as putative MSNs and the rest were classified as putative interneurons. The latter are likely to consist of multiple cell types. Right, Example averaged spike waveforms of a putative MSN (left) and a putative interneuron (IntN, right).
Multiple regression analysis.
Modulation of neuronal activity according to the animal's choices and their outcomes was examined using the following regression model:
 |
where S(t) indicates spike discharge rate, C(t), R(t), and X(t) represent the animal's choice (left or right; dummy variable, −1 or 1), its outcome (reward or no reward; dummy variable, −1 or 1), and their interaction (dummy variable, −1 or 1), respectively, in trial t, ε(t) is the error term, and a0∼a9 are the regression coefficients.
Neuronal activity related to action value and chosen value was examined using the following regression model:
 |
where QL(t) and QR(t) denote left and right action values (i.e., action values for the leftward and rightward goal choice), respectively, and Qc(t) indicates chosen value (the value of chosen action in a given trial; i.e., QL(t) in left-choice trials and QR(t) in right-choice trials) that were estimated using the SP algorithm (Huh et al., 2009). Because a slow drift in the firing rate can potentially inflate the estimate of value-related signals, the model also included a set of autoregressive terms, indicated by A(t) that consisted of spike discharge rates during the same epoch in the previous three trials as the following: A(t) = a7S(t − 1) + a8S(t − 2) + a9S(t − 3), where a7∼a9 are regression coefficients.
The following regression models were used to determine whether neuronal activity during the reward stage is more correlated with reward prediction error (RPE; the difference between the actual and expected rewards) (Schultz et al., 1997; Sutton and Barto, 1998) or updated chosen value (Qc(t+1)), as follows:
 |
and
 |
where RPE = R(t) − Qc(t) and Qc(t+1) = Qc(t) + αRPE (α is the learning constant which was determined separately for each animal).
Ensemble decoding of goal choice.
The animal's goal choice was decoded from ensemble activity of simultaneously recorded neurons using a template-matching procedure with leave-one-out cross-validation (Sul et al., 2011). The analysis was applied to neuronal ensembles simultaneously recorded from the DLS or DMS (≥3 neurons in each region) after matching neuronal ensemble sizes of the two regions by randomly dropping neurons from the larger ensemble (size of analyzed ensembles, 3–7 neurons; 3.9 ± 0.9, mean ± SD). We then calculated the percentage of trials in which neuronal ensemble activity during a 100 ms sliding time window (50 ms time steps) correctly predicted the animal's goal choice.
Statistical tests.
Statistical significance of a regression coefficient was determined with a t test (two-tailed), and significance of the fraction of neurons for a given variable with a binomial test. Significance of the difference in the fraction of neurons between the DLS and DMS was examined with a χ2-test. Fisher's exact test was used instead of a χ2-test, however, whenever the expected number is equal to or less than five. A p value <0.05 was used as the criterion for a significant statistical difference. Bonferroni correction was used when we tested whether neuronal activity was significantly modulated by either left (QL(t)) or right (QR(t)) action value (t test). All data are expressed as mean ± SEM unless noted otherwise.
Results
Choice behavior
Three animals performed 13–21 sessions of the dynamic foraging task (Fig. 1A) while unit signals were recorded from the DLS and DMS simultaneously (Fig. 1B). In all sessions, the animals quickly detected changes in relative reward probabilities after a block transition and biased their goal choices toward the higher reward probability goal, which was well described by a model-based RL algorithm (SP model; Huh et al., 2009) (Fig. 1C). A logistic regression analysis (Walton et al., 2010) also revealed that the animal's choice was influenced by past choice outcomes, with more recent choice outcomes having greater effects (Fig. 1D, left). On the other hand, the animal's choice was little influenced by unrelated choice-outcome pairs. The animal's choice was not significantly influenced by the combination of the previous choice outcome (trial t−1) and other previous choices (trials t−2 to t−5) except a weak negative influence of t−2 trial choice in one animal (Fig. 1D, middle). Similarly, the combination of the previous choice (trial t−1) and other previous choice outcomes (trials t−2 to t−5) had an insignificant or only a weak negative influence on the animal's choice (Fig. 1D, right). These results suggest that the animals made goal choices based on the likelihood to obtain a reward at each goal (action value) that was computed dynamically according to the history of past choices and their corresponding outcomes, as shown previously (Huh et al., 2009; Kim et al., 2009; Sul et al., 2010, 2011). The animal's choice behavior and results of model comparison are summarized in Tables 1 and 2.
Table 1.
Summary of choice behavior
| Choice (high) (%) | Win-stay (%) | Lose-switch (%) | Choice bias (%) | Latency (trials) | |
|---|---|---|---|---|---|
| Animal 1 | 75.0±0.4 | 74.7±1.4 | 66.2±1.9 | 53.8±0.8 | 10.9±0.6 |
| Animal 2 | 74.4±0.5 | 76.9±1.1 | 72.7±0.9 | 52.2±0.5 | 11.9±0.8 |
| Animal 3 | 72.5±0.6 | 71.6±2.3 | 79.3±1.9 | 52.2±0.4 | 10.2±0.8 |
| All | 74.0±0.3 | 74.9±0.9 | 72.4±1.1 | 52.6±0.3 | 11.1±0.5 |
Choice (high), Percentage of choosing the higher reward probability goal in each block; Win-stay, percentage of repeating the same goal choice following a rewarded trial; Lose-switch, percentage of switching the goal choice following an unrewarded trial; Choice bias, percentage of the choice for a preferential goal in a given session; Latency to steady state, the number of trials after block transition to reach 90% of the steady-state choice rate (mean choice rate for the last 20 trials in each block). The latency was determined for each block based on a 10-trial moving average curve of the animal's goal choice (Fig. 1C). Data are mean ± SEM.
Table 2.
Model comparison
| AIC | BIC | Prediction (% correct) | |
|---|---|---|---|
| Rescorla–Wagner rule | 1.114±0.03 | 1.119±0.03 | 73.6±0.5 |
| SP model | 1.096±0.04 | 1.101±0.04 | 74.2±0.1 |
| Logistic regression | 1.311±0.01 | 1.314±0.02 | 72.6±0.5 |
Normalized AIC, normalized BIC, and accuracy of the model's prediction for the animal's actual goal choices (% correct) are shown for two RL models (Rescorla–Wagner rule and SP model) and the logistic regression model. Data are mean ± SD (n = 3 animals).
Neural signals for the animal's choice and its outcome
In total, 206 and 265 well-isolated, stable single units were recorded from the DLS and DMS, respectively, in three rats (rat #1, 34 DLS and 74 DMS units; rat #2, 137 DLS and 109 DMS units; rat #3, 35 DLS and 82 DMS units; Fig. 1B). Only putative MSNs with mean firing rate >0.1 Hz during the task (DLS, n = 129; DMS, n = 213; Fig. 2) were subjected to analysis. Their mean discharge rates during the task were 1.33 ± 0.97 and 1.22 ± 0.99 Hz, respectively. To examine neural signals for the animal's goal choice and its outcome, we assessed fractions of neurons that significantly modulated their activity according to the animal's choice (C), its outcome (i.e., reward; R), or their interaction (X) in the current (t) and two previous (t−1 and t−2) trials using a multiple linear regression analysis (Eq. 2). Neural signals for the animal's goal choice were weak during the delay and go stages, but increased steeply after the animal revealed its choice behaviorally (Figs. 3, 4). Neural signals related to choice outcome and choice × outcome interaction were weak before the reward stage, but rose rapidly once the outcome was revealed in the reward stage in both structures (Fig. 3). Albeit statistically significant, only small differences were found in the strength of these signals between the DLS and DMS. Thus, both structures conveyed strong conjunctive signals for the animal's choice and its outcome, which is consistent with previous findings (Kimchi et al., 2009; Stalnaker et al., 2010; Thorn et al., 2010).
Figure 3.

Time courses of neural signals related to the animal's goal choice and its outcome. The graphs show fractions of neurons that significantly (t test, p < 0.05) modulated their activity according to the animal's choice, its outcome, and their interaction (Choice X Outcome) in the current (trial lag = 0) and two previous (trial lags = 1 and 2) trials estimated with a 1 s moving window advanced in 0.2 s steps (Eq. 2). The shading indicates the chance level for the DLS (binomial test, α = 0.05), which is slightly higher than that for the DMS. Vertical lines indicate the beginning and end of the delay stage (left panels), the beginning of the approach stage (middle panels) and the beginning of the reward stage (right panels). Large open circles denote significant differences between the DLS and DMS (χ2-text, p < 0.05).
Figure 4.

Neural signals for upcoming goal choice. The fraction of neurons that significantly modulated their activity according to the current goal choice was examined in higher temporal resolution (100 ms moving window advanced in 50 ms time steps) around the approach onset. Large open circles denote significant differences between the DLS and DMS (χ2-text, p < 0.05). The triangles on top indicate the onset of the upcoming choice signals. It was 0 and 50 ms before the onset of the approach stage for the DLS (open triangle) and DMS (filled triangle), respectively.
For comparison with our previous results (Kim et al., 2009; Sul et al., 2010, 2011), we examined temporal profiles of choice signals at a higher temporal resolution (100 ms moving window in 50 ms steps). As in our previous studies (Sul et al., 2010, 2011), we defined the onset of the current choice signal as the first time point at which the fraction of current choice-encoding neurons exceeded and remained significantly higher than chance level (binomial test, p < 0.05) for a minimum of 250 ms (5 bins) within 1 s time periods before and after the approach onset. This analysis revealed that the onsets of the choice signals were only 0 and 50 ms before the onset of the approach stage in the DLS and DMS, respectively (Fig. 4). Similarly, neuronal ensemble decoding of the animal's goal choice exceeded and remained significantly higher than chance level (50% correct; t test, p < 0.05) only at 250 and 0 ms after the onset of the approach stage in the DLS and DMS, respectively (data not shown). Thus, neural signals for future goal choice were weak in both areas, confirming our previous results from the DMS (Kim et al., 2009).
Persistence of neural signals for the animal's choice and its outcome
Neural signals related to the animal's choice and its outcome decayed at different rates in the DLS and DMS. In particular, a striking difference was found in the persistence of neural signals for the animal's goal choice. In the DMS, signals for the animal's choice persisted until the reward stage in the next trial (Fig. 3; an example shown in Fig. 5A). By contrast, choice signals decayed more rapidly in the DLS so that they were nearly at chance level once the movement trajectories no longer reflected the animal's previous goal choice [0.9 ± 0.2 (mean ± SD) s after delay onset; Fig. 3].
Figure 5.
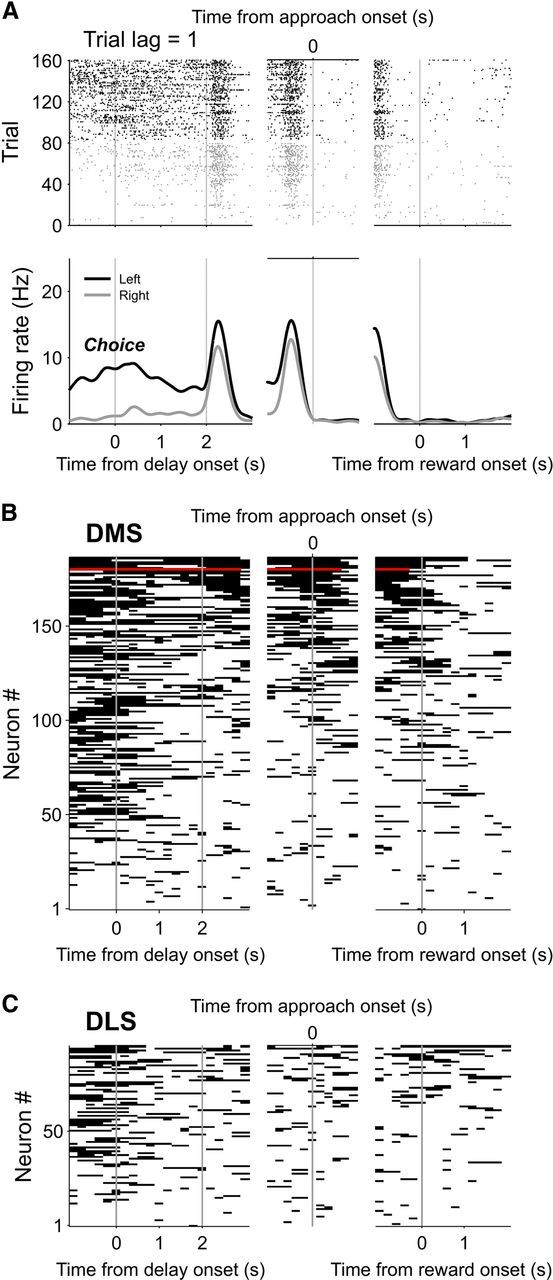
Neural activity related to the animal's previous goal choice. A, An example DMS neuron that significantly modulated its activity according to the animal's previous goal choice (C(t−1)). Trials were grouped according to the animal's previous goal choice (left choice, black; right choice, gray). Top, Spike raster plot. Each row is one trial and each tick mark denotes an action potential. Bottom, Spike density functions estimated with a Gaussian kernel (σ = 100 ms). B, Summary of activity profiles of DMS neurons encoding the previous goal choice. All DMS neurons that significantly modulated their activity according to the animal's previous goal choice during at least one analysis window (1 s, advanced in 0.2 s steps) between the delay stage onset and the reward stage onset are shown. Each horizontal line segment indicates significant modulation of neural activity according to the previous goal choice in that window. Red color indicates the example neuron in A. Neurons were arranged according to the total duration of significant modulation. C, Activity profiles of all DLS neurons encoding the previous goal choice during at least one analysis window.
We have previously shown that persistent choice signals in the rat DMS and ventral striatum (VS) were quantitatively similar during a two-armed bandit task, in which the reward probability is independent of the animal's past choices (Kim et al., 2009). Interestingly, choice signals in the DMS were less persistent during this two-armed bandit task than in the DAWH task used in the present study, in which the reward probability for an unvisited goal increases with the number of consecutive alternative choices. Choice signals in the DMS tended to decay during the 3 s delay stage in the two-armed bandit task (Kim et al., 2009), whereas they were maintained at a stable level in the present study. Comparing the time period between 2 and 3 s after the delay stage onset, 9.2% of DMS MSNs significantly modulated their activity according to the previous goal choice in the two-armed bandit task (Kim et al., 2009), whereas it was 22.1% in the DAWH task used in the present study. This difference was statistically significant (χ2-test, p = 0.001). The strength of previous choice signals in the DMS was also significantly stronger in the present DAWH task than in the two-armed bandit task when we compared previous choice signals during the first 1 s time period since the go state onset (22.1 vs 13.1%; χ2-test, p = 0.028).
Although signals for the animal's goal choice persisted until the next trial in the DMS, this information was seldom maintained continuously by the same neurons. For example, during the interval between 1 s after the delay stage onset and the reward stage onset, only a small number of DMS neurons (n = 3) significantly modulated their activity according to the previous goal choice for the entire duration (Fig. 5B). In the DLS, no such neuron was found (Fig. 5C). We further investigated the persistence of previous choice signals by examining how often each neuron encoded the previous choice at two separate time points. For this, we counted the number of neurons encoding the previous choice during different pairs of four successive 1 s time windows (1 s before delay onset, the first and second 1 s periods of the delay stage, and 1 s after delay offset). The neurons were significantly more likely to encode the previous choice during both of adjacent 1 s time windows than expected by chance in all three adjacent time window pairs in the DMS, but only in one pair in the DLS (Table 3). In contrast, this was the case for only one (DMS) or none (DLS) of three nonadjacent time window pairs (Table 3). These results suggest that the previous choice signals encoded by individual neurons tended to persist relatively briefly (<2 s), and not throughout the entire duration of a trial.
Table 3.
Persistence of neural signals related to the animal's previous goal choice
| All | Delay 1 | Delay 2 | Post-Delay | |
|---|---|---|---|---|
| DMS | ||||
| Pre-Delay | 102 (47.8%) | 43 (34.0)** | 20 (21.5) | 29 (22.5)* |
| Delay-1 | 71 (33.3%) | — | 31 (15.0)*** | 16 (15.7) |
| Delay-2 | 45 (21.1%) | — | — | 15 (9.9)* |
| Post-Delay | 47 (22.1%) | — | — | — |
| DLS | ||||
| Pre-Delay | 43 (33.3%) | 12 (7.3)* | 5 (3.3) | 4 (4.3) |
| Delay-1 | 22 (17.1%) | — | 1 (1.7) | 2 (2.2) |
| Delay-2 | 10 (7.8%) | — | — | 3 (1.0) |
| Post-Delay | 13 (10.1%) | — | — | — |
The second column (All) shows the number (and percentage) of neurons (DMS, out of 213; DLS, out of 129) that significantly modulated their activity according to the animal's previous choice during the corresponding epoch shown in the first column. Numbers in the other columns indicate those neurons that significantly modulated their activity according to the animal's previous choice during two different epochs. Shown in the parenthesis is the expected number of neurons when the effects in two epochs are independent, and asterisk indicates significant deviation from it (χ2-test or Fisher's exact test when expected numbers are <5;
*p < 0.05;
**p < 0.01;
***p < 0.001). Pre-delay, 1 s before delay onset; Delay 1 and 2, the first and second 1 s of the delay stage, respectively; Post-delay, 1 s after delay offset.
Neural signals for choice outcome decayed more rapidly so that the strength of previous choice outcome signals was much weaker compared with that of previous choice signals throughout the delay, go, and approach stages. Nevertheless, they were above chance level in the DMS until the next reward stage (an example shown in Fig. 6A), whereas they subsided and arose again above chance level only around the reward stage onset in the DLS (Fig. 3). Similar to the previous choice signals, the previous choice outcome signals encoded by individual neurons did not persist throughout the entire duration of a trial. For example, no DLS or DMS neuron significantly modulated its activity according to the previous choice outcome for the entire period between the delay stage onset and the approach stage onset (Fig. 6B,C). In addition, there was no significant tendency for DLS or DMS neurons to encode previous choice outcome signals in two successive 1 s windows before, during, or after the delay stage (Table 4).
Figure 6.

Neural activity related to the previous choice outcome. A, An example DMS neuron that significantly modulated its activity according to the previous choice outcome (R(t−1)). Trials were grouped according to the outcome of the animal's previous goal choice (rewarded, gray; unrewarded, black). Top, Spike raster plot. Bottom, Spike density functions (σ = 100 ms). B, Summary of activity profiles of all DMS neurons encoding the previous choice outcome during at least one analysis window. Same format as in Figure 5 except that the horizontal line segments indicate significant modulation of neural activity according to the previous choice outcome instead of the previous goal choice. Red color indicates the example neuron in A. C, Activity profiles of all DLS neurons encoding the previous choice outcome during at least one analysis window.
Table 4.
Persistence of neural signals related to the previous choice outcome
| All | Delay 1 | Delay 2 | Post-Delay | |
|---|---|---|---|---|
| DMS | ||||
| Pre-Delay | 33 (15.5%) | 8 (4.5) | 4 (3.6) | 9 (4.3)* |
| Delay-1 | 29 (13.6%) | — | 4 (3.1) | 4 (3.8) |
| Delay-2 | 23 (10.8%) | — | — | 6 (3.0) |
| Post-Delay | 28 (13.1%) | — | — | — |
| DLS | ||||
| Pre-Delay | 10 (7.6%) | 1 (0.6) | 1 (0.4) | 2 (0.8) |
| Delay-1 | 8 (6.2%) | — | 0 (0.3) | 1 (0.6) |
| Delay-2 | 5 (3.9%) | — | — | 0 (0.4) |
| Post-Delay | 10 (7.8%) | — | — | — |
Same format as in Table 3 except that Fisher's exact test was used for all statistical comparisons because of small expected numbers (<5) of neurons encoding the previous choice outcome during two different epochs by chance;
*p < 0.05.
Value-related neural signals
Time courses of action value signals were examined by calculating the fraction of neurons that significantly modulated their activity according to at least one action value (QL(t) or QR(t); p < 0.025; α = 0.05 was corrected for multiple comparisons; Eq. 3) in each region. Action value signals were weak, but significant before behavioral manifestation of the animal's goal choice (last 1 s of the delay stage, DLS, 8.5%, binomial test, p = 0.029; DMS, 8.0%, p = 0.022; 1 s before the approach onset, DLS, 11.6%, p < 0.001; DMS,11.7%, p < 0.001; Fig. 7), and they did not vary significantly between the two regions (χ2-test, last 1 s of the delay stage, p = 0.858; 1 s before the approach onset, p = 0.976). We also examined time courses of chosen value (the value of chosen action in a given trial; i.e., QL(t) in left-choice trials and QR(t) in right-choice trials) signals (Eq. 3). Chosen value signals were markedly elevated during the time window around the reward stage onset in both structures (Fig. 7). Analyzing neural activity during the 2 s period centered around the reward stage onset, we found that significant fractions of neurons modulated their activity according to chosen value in both structures (DLS, 17.8%, binomial test, p < 0.001; DMS, 24.4%, p < 0.001) and they were not significantly different from each other (χ2-test, p = 0.154).
Figure 7.

Neural activity related to values. A, Time courses of neural signals related to action value (QL(t) or QR(t)) and chosen value (Qc(t), Eq. 3). For the action value signals, fractions of those neurons that significantly modulated their activity according to at least one action value (left or right; corrected for multiple comparisons) were plotted. Same format as in Figure 3. B, Example neurons that significantly modulated their activity according to the left action value (QL(t), left, DLS neuron) or chosen value (right, DLS neuron). Trials were grouped according to quartiles of left action value (0∼1) or chosen value (0∼1), and indicated in different colors. Same format as in Figure 5A.
Neural signals necessary to evaluate the outcome of the animal's choice, namely signals for the animal's choice, its outcome, and chosen value, temporally overlapped immediately after the choice outcome was revealed (i.e., during the early reward stage) in the DLS as well as DMS (Eq. 3; Fig. 8A). We have shown previously that relative signs of these neural signals are consistent with the possibility that they are combined to compute RPE as well as to update the value of chosen action in the DMS (Kim et al., 2009). Because RPE and updated chosen value are computed by the difference between and weighted sum of choice outcome and chosen value, respectively, those neurons with the opposite signs in the coefficients for chosen value and choice outcome are expected to modulate their activity according to RPE. Conversely, those with the same signs in their coefficients are expected to modulate their activity according to updated chosen value. There were 13 DLS and 13 DMS neurons that significantly modulated their activity according to both choice outcome and chosen value during the first 1 s of the reward stage (Eq. 3). As predicted, their activity was better explained by the model containing updated chosen value (Eq. 5; blue) when the coefficients for choice outcome and chosen value had the same sign (8 DLS and 9 DMS neurons; Fig. 8B). In contrast, their activity was better explained by the model containing RPE (Eq. 4; red) when the signs for these two coefficients were opposite (5 DLS and 4 DMS neurons; Fig. 8B). This was also the case for the majority of DLS and DMS neurons that significantly modulated their activity according to either choice outcome or chosen value, but not both (light-colored circles in Fig. 8B). Activity was better explained by the model containing updated chosen value (light blue) in 61 among 76 neurons that showed the same signs in their coefficients for choice outcome and chosen value. In contrast, activity was better explained by the model containing RPE (light red) in 60 among 81 neurons that showed opposite signs in these two coefficients. These results suggest that choice outcome and chosen value signals might be combined to compute RPE as well as to update chosen value in both structures.
Figure 8.

Computing RPE and updating chosen value in the striatum. A, Convergence of neural signals for the animal's goal choice (C(t)), its outcome (R(t)), and chosen value (Qc(t)) in the DLS and DMS. The graphs show fractions of neurons that significantly modulated their activity according to the animal's current goal choice (blue), its outcome (green), or chosen value (orange) around the time of reward delivery in an 0.5 s analysis window that was advanced in 0.1 s time steps (Eq. 3). B, Relationship between the coefficients related to choice outcome and chosen value. Standardized regression coefficients (SRC) for the current choice outcome (R(t)) were plotted against those for chosen value (Qc(t)) for neural activity during the first 1 s of the reward stage. Saturated colors indicate the neurons that significantly modulated their activity according to both choice outcome and chosen value, and light colors indicate those that encoded either choice outcome or chosen value only. The remaining neurons are indicated in gray. Red and blue indicate those neurons whose activity was better explained by the model containing RPE or updated chosen value (Qc(t+1); i.e., chosen value in trial t+1), respectively.
We used a model-based RL algorithm (SP algorithm) (Huh et al., 2009) in the present study to analyze value-related neural activity. However, trial-by-trial values computed with a model-based RL algorithm (SP model) and a model-free RL algorithm (Rescorla–Wagner rule or Q-learning model) are overall similar except when the number of repeated choices (run length) is large (Huh et al., 2009). Therefore, trial-by-trial values computed with model-free and model-based RL algorithms were highly correlated with each other (r = 0.80, 0.86 and 0.88 for three animals), and neural signals related to values and RPE were similar regardless of whether a model-free or model-based RL algorithm was used to analyze the neural data (Fig. 9).
Figure 9.

Value-related neural signals computed with a model-free RL algorithm. Action values were computed using the Rescorla–Wagner rule instead of the SP model. A, Neural signals for action value (QL(t) and/or QR(t)) and chosen value (Qc(t), Eq. 3). Same format as in Figure 7A. Action value signals were significant during the last 1 s of the delay stage in both the DLS (12.4%, binomial test, p < 0.001) and DMS (15.0%, p < 0.001). B, Relationship between the standardized regression coefficients related to choice outcome (R(t)) and chosen value (Qc(t)) for neural activity during the first 1 s of the reward stage (Eq. 3). Same format as in Figure 8B.
Discussion
We compared neuronal activity between the DLS and DMS in rats performing a dynamic foraging task to gain insights about the types of information processed through different cortico-BG loops. Both structures conveyed conjunctive neural signals for the animal's goal choice and its outcome. Value-related neural signals were also similar across the two structures. However, signals for the animal's goal choice were persistent until the next trial in the DMS, but not in the DLS. Although individual DMS neurons tended to convey choice signals only for brief time periods, DMS neurons as a population conveyed robust choice signals until the outcome of the animal's choice was revealed in the next trial. Thus, signals useful for causally linking temporally discontiguous responses and their outcomes were selectively found in the DMS. These results provide new insights on the neural basis of distinct functions served by the DLS and DMS.
Persistent choice signals in the DMS
It is often challenging to associate an action and its corresponding outcome correctly, because a reward resulting from a particular action is often revealed after a substantial delay (temporal credit assignment problem) (Sutton and Barto, 1998), and one way to solve this problem is maintaining memory traces for previous actions. It is remarkable that persistent signals for the previous goal choice in the DMS did not decay gradually, but was maintained at a stable level until the reward delivery in the next trial, so that signals for the previous choice and current choice outcome were both strong when they overlapped temporally. It is also remarkable that the previous choice signals subsided abruptly after the current choice outcome was revealed, which is consistent with the possibility that the DMS maintained previous choice signals to combine them with current choice outcome signals. These characteristics (stable maintenance of action signals until an outcome is revealed later) are expected for memory traces linking temporally discontiguous actions and outcomes. Therefore, our results raise the possibility that persistent choice signals in the DMS represent choice-related memory traces that can be used to causally link temporally discontiguous responses and their outcomes. Persistent choice signals are found in other parts of the brain including the VS (Kim et al., 2007, 2009), prefrontal cortex (Barraclough et al., 2004; Genovesio et al., 2006; Seo and Lee, 2009; Sul et al., 2010), and parietal cortex (Seo et al., 2009). It is possible that multiple brain regions are involved in linking temporally discontiguous responses and their outcomes.
Choice signals were more persistent in the present study than in a previous study in which a dynamic two-armed bandit task was used (Kim et al., 2009). During the DAWH task used in the present study, reward probability at a particular goal increased with the number of consecutive alternative choices (“stacked probability”) (Huh et al., 2009), whereas it was independent of previous goal choices in the two-armed bandit task. It is possible that choice signals were more persistent in the DAWH task because it was advantageous for the animals to keep track of the number of consecutive goal choices (run length). It would be important for future studies to compare DLS versus DMS neural activity and effects of specific DLS versus DMS lesion/inactivation on behavioral performance during the tasks in which persistent choice signals can be used for causally linking choices and their resulting outcomes. For example, if the outcome of a goal choice is revealed only after the animal comes back to the central stem in our maze, persistent choice signals might influence more directly the formation of appropriate R-O associations and thus might become even stronger than observed in the present study.
Previous studies have shown that during the course of learning a new task, neural activity changes with different time courses in the sensorimotor (DLS in rats and putamen in monkeys) and associative (DMS in rats and caudate in monkeys) striatum (Miyachi et al., 1997, 2002; Kimchi et al., 2009; Yin et al., 2009; Thorn et al., 2010). Since we recorded from overtrained animals, our study does not provide information about the time course of neural activity change. Instead, our study shows that contents of trial-by-trial information processed by the DLS and DMS are different in a way consistent with roles proposed for the two structures (Yin and Knowlton, 2006; Balleine et al., 2007; Ito and Doya, 2011). It is likely that there are additional differences in the contents of information processed by the DLS and DMS that were not revealed in the present study. Other possible functional differences between these two structures should be further investigated in future studies.
Mechanisms for solving temporal credit assignment problem
It is unclear how the temporal credit assignment problem is solved by the brain (Pawlak et al., 2010). It might be solved by “tagging” synapses involved in a selected response and modifying them later (Cassenaer and Laurent, 2012). It might also be solved by persistently maintaining activity of those neurons involved in the selected response until the reward delivery (Curtis and Lee, 2010; Lee et al., 2012). In our study, the previous choice signals encoded by individual neurons tended to persist only briefly and decay within ∼2 s. Thus, previous choice signals were maintained mostly by a group rather than individual DMS neurons. Sequential activation of multiple neurons has been observed in various areas of rodent brains under diverse experimental conditions (Baeg et al., 2003; Carr et al., 2011; Harvey et al., 2012). The DMS might link an action and its subsequent outcome through sequential activation of a group of neurons. It remains to be determined, however, how synapses involved in the generation of an action in the first place can be selectively strengthened when its outcome is revealed later.
Persistent choice outcome signals in the DMS
The DMS conveyed not only persistent choice signals, but also persistent choice outcome signals until the next trial, albeit at a weaker level. Thus, the DMS was equipped with neural substrates necessary to link an outcome with a choice in the previous as well as next trial (“spread-of-effect”) (Thorndike, 1933; Walton et al., 2010). In our task, however, no strong evidence for the spread-of-effect was found (Fig. 1D). Nevertheless, persistent choice outcome signals found in the DMS might play significant roles for R-O associations in other circumstances, such as when choice outcomes and subsequent behavioral responses are temporally more contiguous than in the present study.
Value processing in the DLS and DMS
Different roles of the DLS and DMS in habitual versus goal-directed action selection raise the possibility that value information may be selectively encoded in the DMS. On the other hand, to adjust the strength of S-R association according to the actual and expected outcomes, value signals necessary to compute RPE may also be carried by DLS neurons. Our results support the latter possibility. Both structures conveyed significant action value and chosen value signals. Moreover, in both areas, the relationship between chosen value and choice outcome signals was consistent with the possibility that they were combined to compute RPE as well as to update chosen value. Together with the finding that upcoming action selection signals were weak in both structures, these results suggest that striatal value signals may be used to compute RPE-based teaching signals for S-R and R-O associations, rather than to guide value-based action selection, which appears to be mediated by medial frontal cortex under dynamic foraging situations in rats (Sul et al., 2011).
The RL theory is classified into two broad categories of model-free and model-based RL. Model-free RL relies on only directly experienced reward and penalty in updating values, whereas model-based RL can update values based on the animal's motivational state and its knowledge of the environment (Sutton and Barto, 1998). Based on differences in anatomical connectivity and lesion effects on choice behavior, the DLS and DMS have been proposed to be in charge of model-free and model-based RL, respectively (Bornstein and Daw, 2011; Ito and Doya, 2011). In this theoretical framework, it is of great interest to reveal similarities and differences between the two structures in representing and updating values. The DLS and DMS might update values based on similar RPE signals when model-free RL is sufficient for a given behavioral task, whereas the DMS might use different types of additional RPE signals to update values when model-based RL is needed. Our results show that value-related neural activity is similar between the DLS and DMS during a relatively simple dynamic foraging task. Although the choice behavior in our task was better explained by a model-based than model-free RL algorithm (Table 2; also see Huh et al., 2009), similar results were obtained when the neural data were analyzed with a model-free RL algorithm. It will be important to compare value-related neural activity between the DLS and DMS in a task in which model-free and model-based RL algorithms clearly predict different goal choices and neural activity (Daw et al., 2011; Simon and Daw, 2011).
Footnotes
This work was supported by the National Research Foundation grant (2011-0015618), the Original Technology Research Program for Brain Science (2011-0019209), and a grant from the Brain Research Center of the 21st Century Frontier Research Program funded by the Ministry of Education, Science and Technology, Korea (M.W.J.).
References
- Alexander GE, Crutcher MD. Functional architecture of basal ganglia circuits: neural substrates of parallel processing. Trends Neurosci. 1990;13:266–271. doi: 10.1016/0166-2236(90)90107-l. [DOI] [PubMed] [Google Scholar]
- Alexander GE, DeLong MR, Strick PL. Parallel organization of functionally segregated circuits linking basal ganglia and cortex. Annu Rev Neurosci. 1986;9:357–381. doi: 10.1146/annurev.ne.09.030186.002041. [DOI] [PubMed] [Google Scholar]
- Alexander GE, Crutcher MD, DeLong MR. Basal ganglia-thalamocortical circuits: parallel substrates for motor, oculomotor, “prefrontal” and “limbic” functions. Prog Brain Res. 1990;85:119–146. [PubMed] [Google Scholar]
- Baeg EH, Kim YB, Jang J, Kim HT, Mook-Jung I, Jung MW. Fast spiking and regular spiking neural correlates of fear conditioning in the medial prefrontal cortex of the rat. Cereb Cortex. 2001;11:441–451. doi: 10.1093/cercor/11.5.441. [DOI] [PubMed] [Google Scholar]
- Baeg EH, Kim YB, Huh K, Mook-Jung I, Kim HT, Jung MW. Dynamics of population code for working memory in the prefrontal cortex. Neuron. 2003;40:177–188. doi: 10.1016/s0896-6273(03)00597-x. [DOI] [PubMed] [Google Scholar]
- Baeg EH, Kim YB, Kim J, Ghim JW, Kim JJ, Jung MW. Learning-induced enduring changes in functional connectivity among prefrontal cortical neurons. J Neurosci. 2007;27:909–918. doi: 10.1523/JNEUROSCI.4759-06.2007. [DOI] [PMC free article] [PubMed] [Google Scholar]
- Balleine BW, Delgado MR, Hikosaka O. The role of the dorsal striatum in reward and decision-making. J Neurosci. 2007;27:8161–8165. doi: 10.1523/JNEUROSCI.1554-07.2007. [DOI] [PMC free article] [PubMed] [Google Scholar]
- Balleine BW, Liljeholm M, Ostlund SB. The integrative function of the basal ganglia in instrumental conditioning. Behav Brain Res. 2009;199:43–52. doi: 10.1016/j.bbr.2008.10.034. [DOI] [PubMed] [Google Scholar]
- Barraclough DJ, Conroy ML, Lee D. Prefrontal cortex and decision making in a mixed-strategy game. Nat Neurosci. 2004;7:404–410. doi: 10.1038/nn1209. [DOI] [PubMed] [Google Scholar]
- Bornstein AM, Daw ND. Multiplicity of control in the basal ganglia: computational roles of striatal subregions. Curr Opin Neurobiol. 2011;21:374–380. doi: 10.1016/j.conb.2011.02.009. [DOI] [PMC free article] [PubMed] [Google Scholar]
- Burnham KP, Anderson DR. Model selection and multimodel inference: a practical information-theoretic approach. Ed 2. New York: Springer; 2002. [Google Scholar]
- Carr MF, Jadhav SP, Frank LM. Hippocampal replay in the awake state: a potential substrate for memory consolidation and retrieval. Nat Neurosci. 2011;14:147–153. doi: 10.1038/nn.2732. [DOI] [PMC free article] [PubMed] [Google Scholar]
- Cassenaer S, Laurent G. Conditional modulation of spike-timing-dependent plasticity for olfactory learning. Nature. 2012;482:47–52. doi: 10.1038/nature10776. [DOI] [PubMed] [Google Scholar]
- Curtis CE, Lee D. Beyond working memory: the role of persistent activity in decision making. Trends Cogn Sci. 2010;14:216–222. doi: 10.1016/j.tics.2010.03.006. [DOI] [PMC free article] [PubMed] [Google Scholar]
- Daw ND, Gershman SJ, Seymour B, Dayan P, Dolan RJ. Model-based influences on humans' choices and striatal prediction errors. Neuron. 2011;69:1204–1215. doi: 10.1016/j.neuron.2011.02.027. [DOI] [PMC free article] [PubMed] [Google Scholar]
- Devan BD, Hong NS, McDonald RJ. Parallel associative processing in the dorsal striatum: segregation of stimulus-response and cognitive control subregions. Neurobiol Learn Mem. 2011;96:95–120. doi: 10.1016/j.nlm.2011.06.002. [DOI] [PubMed] [Google Scholar]
- Genovesio A, Brasted PJ, Wise SP. Representation of future and previous spatial goals by separate neural populations in prefrontal cortex. J Neurosci. 2006;26:7305–7316. doi: 10.1523/JNEUROSCI.0699-06.2006. [DOI] [PMC free article] [PubMed] [Google Scholar]
- Haber SN, Knutson B. The reward circuit: linking primate anatomy and human imaging. Neuropsychopharmacology. 2010;35:4–26. doi: 10.1038/npp.2009.129. [DOI] [PMC free article] [PubMed] [Google Scholar]
- Harvey CD, Coen P, Tank DW. Choice-specific sequences in parietal cortex during a virtual-navigation decision task. Nature. 2012;484:62–68. doi: 10.1038/nature10918. [DOI] [PMC free article] [PubMed] [Google Scholar]
- Huh N, Jo S, Kim H, Sul JH, Jung MW. Model-based reinforcement learning under concurrent schedules of reinforcement in rodents. Learn Mem. 2009;16:315–323. doi: 10.1101/lm.1295509. [DOI] [PubMed] [Google Scholar]
- Ito M, Doya K. Multiple representations and algorithms for reinforcement learning in the cortico-basal ganglia circuit. Curr Opin Neurobiol. 2011;21:368–373. doi: 10.1016/j.conb.2011.04.001. [DOI] [PubMed] [Google Scholar]
- Kim H, Sul JH, Huh N, Lee D, Jung MW. Role of striatum in updating values of chosen actions. J Neurosci. 2009;29:14701–14712. doi: 10.1523/JNEUROSCI.2728-09.2009. [DOI] [PMC free article] [PubMed] [Google Scholar]
- Kim YB, Huh N, Lee H, Baeg EH, Lee D, Jung MW. Encoding of action history in the rat ventral striatum. J Neurophysiol. 2007;98:3548–3556. doi: 10.1152/jn.00310.2007. [DOI] [PubMed] [Google Scholar]
- Kimchi EY, Torregrossa MM, Taylor JR, Laubach M. Neuronal correlates of instrumental learning in the dorsal striatum. J Neurophysiol. 2009;102:475–489. doi: 10.1152/jn.00262.2009. [DOI] [PMC free article] [PubMed] [Google Scholar]
- Lau B, Glimcher PW. Dynamic response-by-response models of matching behavior in rhesus monkeys. J Exp Anal Behav. 2005;84:555–579. doi: 10.1901/jeab.2005.110-04. [DOI] [PMC free article] [PubMed] [Google Scholar]
- Lee D, Seo H, Jung MW. Neural basis of reinforcement learning and decision making. Annu Rev Neurosci. 2012;35:287–308. doi: 10.1146/annurev-neuro-062111-150512. [DOI] [PMC free article] [PubMed] [Google Scholar]
- Miyachi S, Hikosaka O, Miyashita K, Kárádi Z, Rand MK. Differential roles of monkey striatum in learning of sequential hand movement. Exp Brain Res. 1997;115:1–5. doi: 10.1007/pl00005669. [DOI] [PubMed] [Google Scholar]
- Miyachi S, Hikosaka O, Lu X. Differential activation of monkey striatal neurons in the early and late stages of procedural learning. Exp Brain Res. 2002;146:122–126. doi: 10.1007/s00221-002-1213-7. [DOI] [PubMed] [Google Scholar]
- Pawlak V, Wickens JR, Kirkwood A, Kerr JN. Timing is not everything: neuromodulation opens the STDP gate. Front Synaptic Neurosci. 2010;2:146. doi: 10.3389/fnsyn.2010.00146. [DOI] [PMC free article] [PubMed] [Google Scholar]
- Paxinos G, Watson C. The rat brain in stereotaxic coordinates. Ed 4. San Diego: Academic; 1998. [DOI] [PubMed] [Google Scholar]
- Redgrave P, Rodriguez M, Smith Y, Rodriguez-Oroz MC, Lehericy S, Bergman H, Agid Y, DeLong MR, Obeso JA. Goal-directed and habitual control in the basal ganglia: implications for Parkinson's disease. Nat Rev Neurosci. 2010;11:760–772. doi: 10.1038/nrn2915. [DOI] [PMC free article] [PubMed] [Google Scholar]
- Schmitzer-Torbert N, Jackson J, Henze D, Harris K, Redish AD. Quantitative measures of cluster quality for use in extracellular recordings. Neuroscience. 2005;131:1–11. doi: 10.1016/j.neuroscience.2004.09.066. [DOI] [PubMed] [Google Scholar]
- Schultz W, Dayan P, Montague PR. A neural substrate of prediction and reward. Science. 1997;275:1593–1599. doi: 10.1126/science.275.5306.1593. [DOI] [PubMed] [Google Scholar]
- Seo H, Lee D. Behavioral and neural changes after gains and losses of conditioned reinforcers. J Neurosci. 2009;29:3627–3641. doi: 10.1523/JNEUROSCI.4726-08.2009. [DOI] [PMC free article] [PubMed] [Google Scholar]
- Seo H, Barraclough DJ, Lee D. Lateral intraparietal cortex and reinforcement learning during a mixed-strategy game. J Neurosci. 2009;29:7278–7289. doi: 10.1523/JNEUROSCI.1479-09.2009. [DOI] [PMC free article] [PubMed] [Google Scholar]
- Simon DA, Daw ND. Neural correlates of forward planning in a spatial decision task in humans. J Neurosci. 2011;31:5526–5539. doi: 10.1523/JNEUROSCI.4647-10.2011. [DOI] [PMC free article] [PubMed] [Google Scholar]
- Stalnaker TA, Calhoon GG, Ogawa M, Roesch MR, Schoenbaum G. Neural correlates of stimulus-response and response-outcome associations in dorsolateral versus dorsomedial striatum. Front Integr Neurosci. 2010;4:12. doi: 10.3389/fnint.2010.00012. [DOI] [PMC free article] [PubMed] [Google Scholar]
- Sul JH, Kim H, Huh N, Lee D, Jung MW. Distinct roles of rodent orbitofrontal and medial prefrontal cortex in decision making. Neuron. 2010;66:449–460. doi: 10.1016/j.neuron.2010.03.033. [DOI] [PMC free article] [PubMed] [Google Scholar]
- Sul JH, Jo S, Lee D, Jung MW. Role of rodent secondary motor cortex in value-based action selection. Nat Neurosci. 2011;14:1202–1208. doi: 10.1038/nn.2881. [DOI] [PMC free article] [PubMed] [Google Scholar]
- Sutton RS, Barto AG. Reinforcement learning: an introduction. Cambridge MA: MIT; 1998. [Google Scholar]
- Thorn CA, Atallah H, Howe M, Graybiel AM. Differential dynamics of activity changes in dorsolateral and dorsomedial striatal loops during learning. Neuron. 2010;66:781–795. doi: 10.1016/j.neuron.2010.04.036. [DOI] [PMC free article] [PubMed] [Google Scholar]
- Thorndike EL. A proof of the law of effect. Science. 1933;77:173–175. doi: 10.1126/science.77.1989.173-a. [DOI] [PubMed] [Google Scholar]
- Voorn P, Vanderschuren LJ, Groenewegen HJ, Robbins TW, Pennartz CM. Putting a spin on the dorsal-ventral divide of the striatum. Trends Neurosci. 2004;27:468–474. doi: 10.1016/j.tins.2004.06.006. [DOI] [PubMed] [Google Scholar]
- Walton ME, Behrens TE, Buckley MJ, Rudebeck PH, Rushworth MF. Separable learning systems in the macaque brain and the role of orbitofrontal cortex in contingent learning. Neuron. 2010;65:927–939. doi: 10.1016/j.neuron.2010.02.027. [DOI] [PMC free article] [PubMed] [Google Scholar]
- White NM. Some highlights of research on the effects of caudate nucleus lesions over the past 200 years. Behav Brain Res. 2009;199:3–23. doi: 10.1016/j.bbr.2008.12.003. [DOI] [PubMed] [Google Scholar]
- Yin HH, Knowlton BJ. The role of the basal ganglia in habit formation. Nat Rev Neurosci. 2006;7:464–476. doi: 10.1038/nrn1919. [DOI] [PubMed] [Google Scholar]
- Yin HH, Mulcare SP, Hilário MR, Clouse E, Holloway T, Davis MI, Hansson AC, Lovinger DM, Costa RM. Dynamic reorganization of striatal circuits during the acquisition and consolidation of a skill. Nat Neurosci. 2009;12:333–341. doi: 10.1038/nn.2261. [DOI] [PMC free article] [PubMed] [Google Scholar]