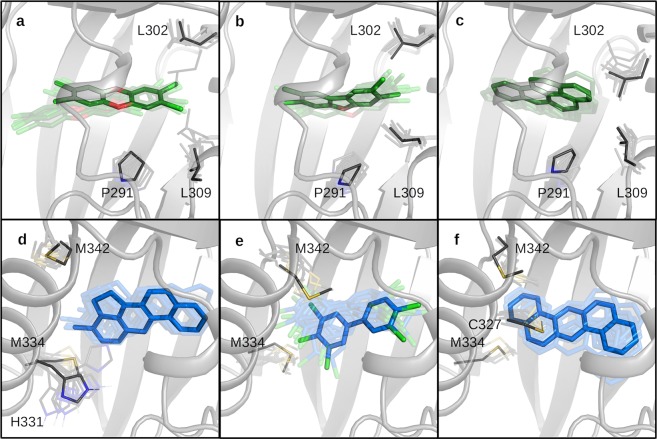
Figure 6.
Dynamic view of the binding poses of ligands in group 1, (a) TCDD, (b) TCDF, (c) BaP and group 2, (d) 3MC, (e) PCB126, (f) DBA. Ligands are represented as sticks and 10 snapshots extracted during the last 8 ns of MD simulation are shown in transparency; solid sticks indicate the most sampled poses in the MD simulations. The most relevant residues identified by per-residue decomposition of ΔGbind are shown as lines and labeled.

