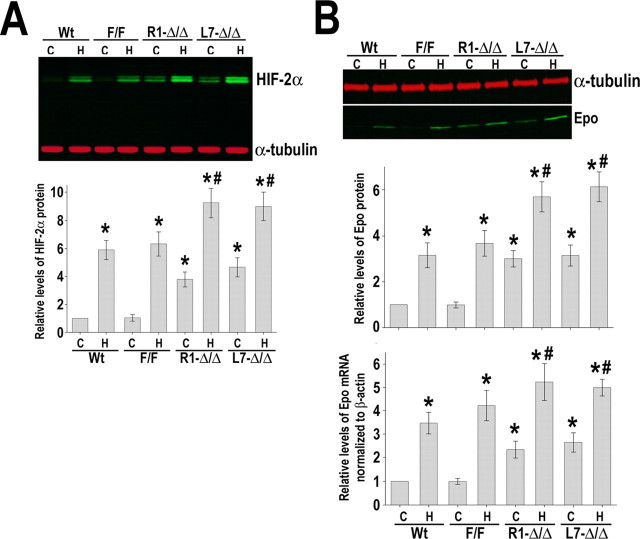
Figure 10.
Increased HIF-2α and Epo expression in HIF-1αΔ/Δ mice. A, Western blot analysis of HIF-2α in brain samples of animals subjected to normoxia (C) (4 h) or hypoxia (H) (8% O2, 4 h). Protein bands were quantified and normalized to α-tubulin, and the value obtained from normoxic wild-type samples (C, Wt) was arbitrarily defined as 1. B, RT-PCR and Western blot analysis of Epo in animals subjected to the same experimental conditions as described in A. Data are expressed as mean ± SD from five animals for each genotype including wild-type (Wt), HIF-1αF/F, and HIF-1αΔ/Δ. *p ≤ 0.05 compared with normoxic wild-type (C, Wt). # p < 0.05 versus hypoxic wild type (H, Wt).

