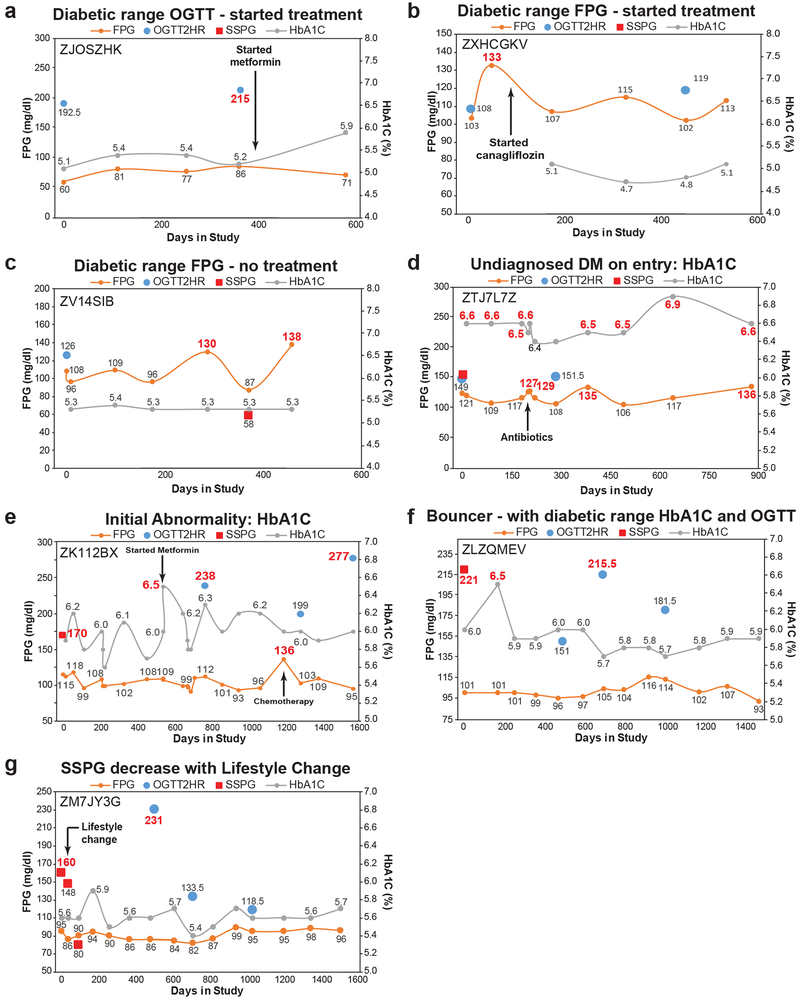
Extended Data Fig 3. Additional individual longitudinal trajectories for diabetic measures.
Diabetic-range metrics are indicated in red. (a) Diabetic range OGTT, (b,c) Diabetic range FPG, (d) undiagnosed DM at study entry (HbA1C), (e) Initial abnormality HbA1C. Note this person had two HbA1C measurements on the same day at two different laboratories and was started on medication based on the higher measurement, (f) Bouncer with diabetic range HbA1C and OGTT, and (g) SSPG decrease with lifestyle change.

