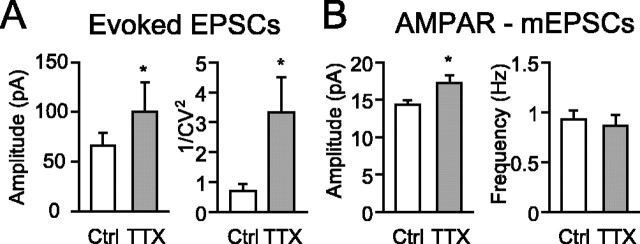
Figure 4.
Increase in EPSC amplitude and 1/CV2 in TTX-treated neurons. A, Averaged amplitude (left) and 1/CV2 (right) of evoked AMPAR-mediated EPSCs in control (Ctrl) and TTX-treated (TTX) neurons (22 control pairs, 25 TTX-treated pairs; *p < 0.05). B, Averaged amplitude and frequency of mEPSCs in control and TTX-treated neurons. Spontaneous mEPSCs were aligned with the onset of rising phase of events and averaged (72 control and 61 TTX-treated neurons; *p < 0.05). Note that a significant difference is observed in the amplitude but not in the frequency.

