
Figure 3.
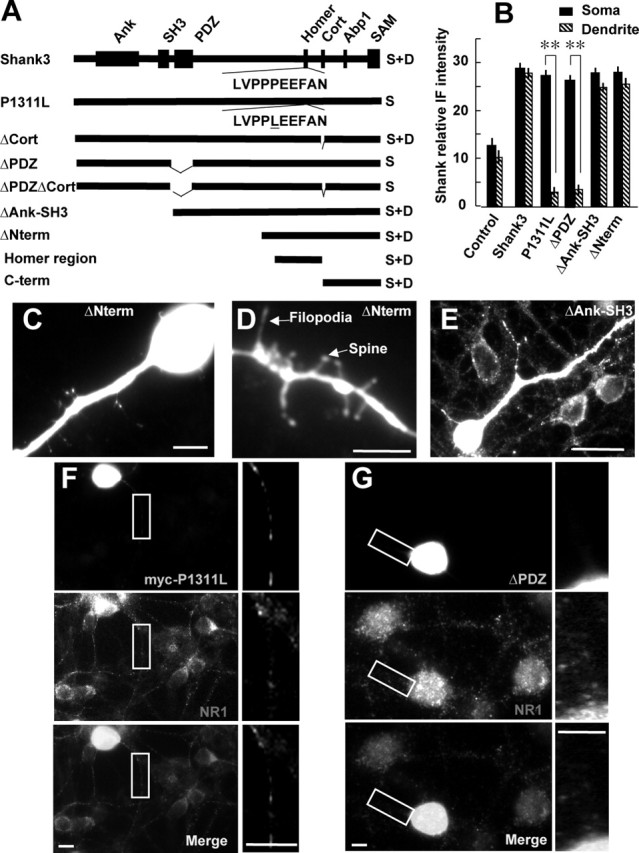
Subcellular localization of transfected wild-type and mutant Shank3 in CGCs. A, Diagram of Shank3 protein-protein interaction domains and Shank3 mutants. Localization of the transfected mutants (found in >90% of randomly chosen transfected neurons; n = 40-50) is indicated on the right. S, Somatic; D, dendritic; Ank, Ankyrin repeats (residues 114-347); SH3 domain (471-531); PDZ domain (566-663); Homer, Homer-binding site (1307-1316); Cort, cortactin-binding site (1410-1417); Abp1, Abp1-binding site (1485-1493); SAM domain (1674-1738); ΔAnk-SH3, residues 544-1373; ΔNterm, 1063-1740; Homer region, 1143-1408; C-term, 1379-1740. B, Immunostaining intensity of endogenous Shank (control) and of transfected wild-type myc-Shank3 and mutants, measured in the soma and dendrites of CGCs. Each bar of histogram is the mean ± SEM of 30-40 cells. **p ≤ 0.01. C-G, Representative somato-dendritic (C, D, ΔNterm; E, ΔAnk-SH3) and somatic (F, P1311L; G, ΔPDZ; top) and immunostaining of the indicated transfected myc-Shank3 mutants. In F and G, the middle panels represent immunostaining of the endogenous NR1 subunit, and the bottom panels are merged images of middle and top panels. The right insets are enlarged images of the framed area of the left images. Scales bars: A-D, F, G, 5 μm; E, 10 μm.