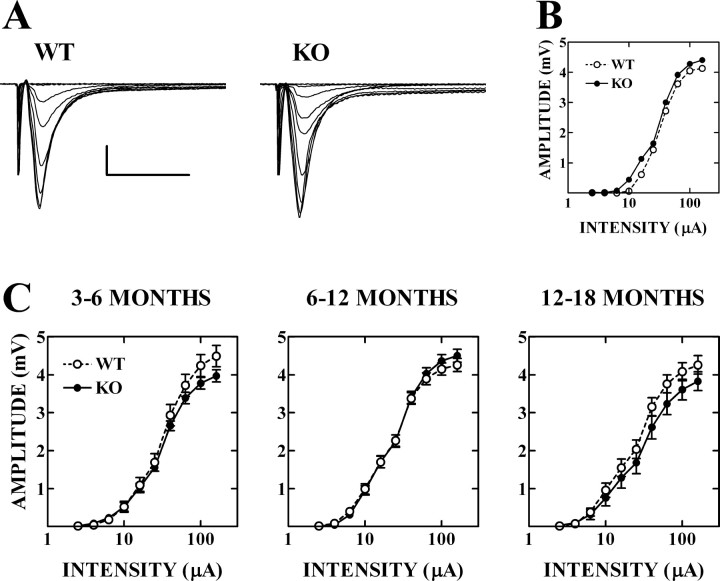
Figure 1.
Synaptic input-output curves in Fmr1 KO and WT mice at three age ranges. A, Field EPSPs evoked by 10-160 μA ASSN fiber stimulation in typical slices from a WT (5.5-month-old) and an Fmr1 KO (3-month-old) mouse. Each record is an average of four consecutive responses. Stimulus intensities were 2.5, 4.0, 6.3, 10.0, 16.0, 25.0, 40.0, 63.0, 100.0, and 160.0 μA. Calibration: 1 mV, 10 ms. B, Input-output curves relating stimulus intensity and field EPSP amplitude in the WT (open circles) and KO (filled circles) slices shown in A. Note the logarithmic scale on abscissa. C, Input-output curves for WT and KO mice for indicated age groups. Data are means ± SEM for 11-25 mice per group.

