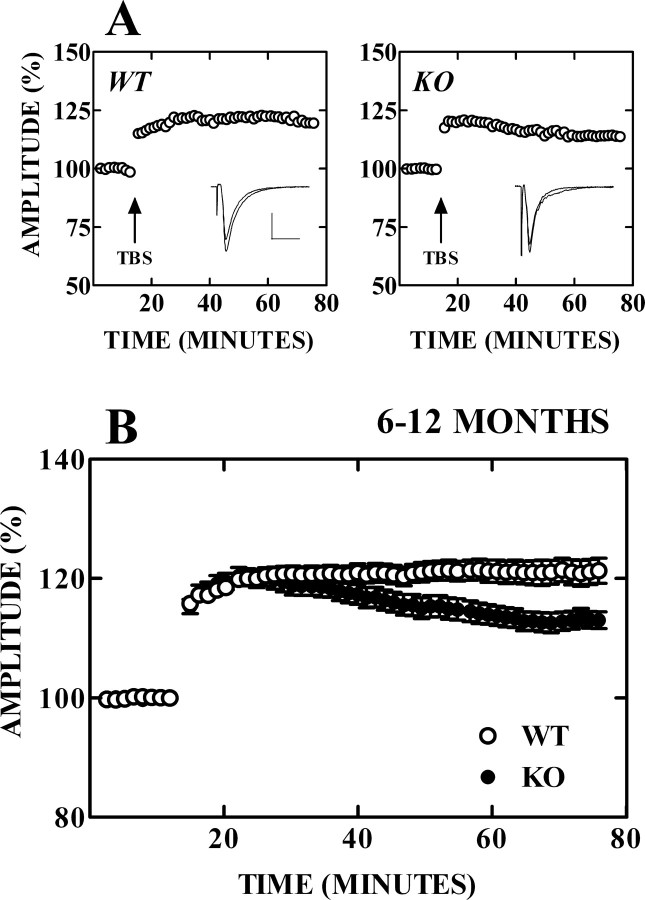
Figure 4.
LTP in the APC of picrotoxin-treated slices from 6- to 12-month-old WT and Fmr1 KO mice. A, Plots of fEPSP amplitude over time before and after TBS (arrow) in slices from representative WT (12-month-old) and KO (11-month-old) mice. Each circle is the average of four consecutive responses and is normalized to the average of the 10 min baseline period (100%). The insets show records taken 1 min before and 60 min after TBS superimposed. Calibration: 1 mV, 10 ms. B, Average data (mean ± SEM) obtained from 14 WT (open circles) and 15 KO (filled circles) mice.

