
Figure 8.
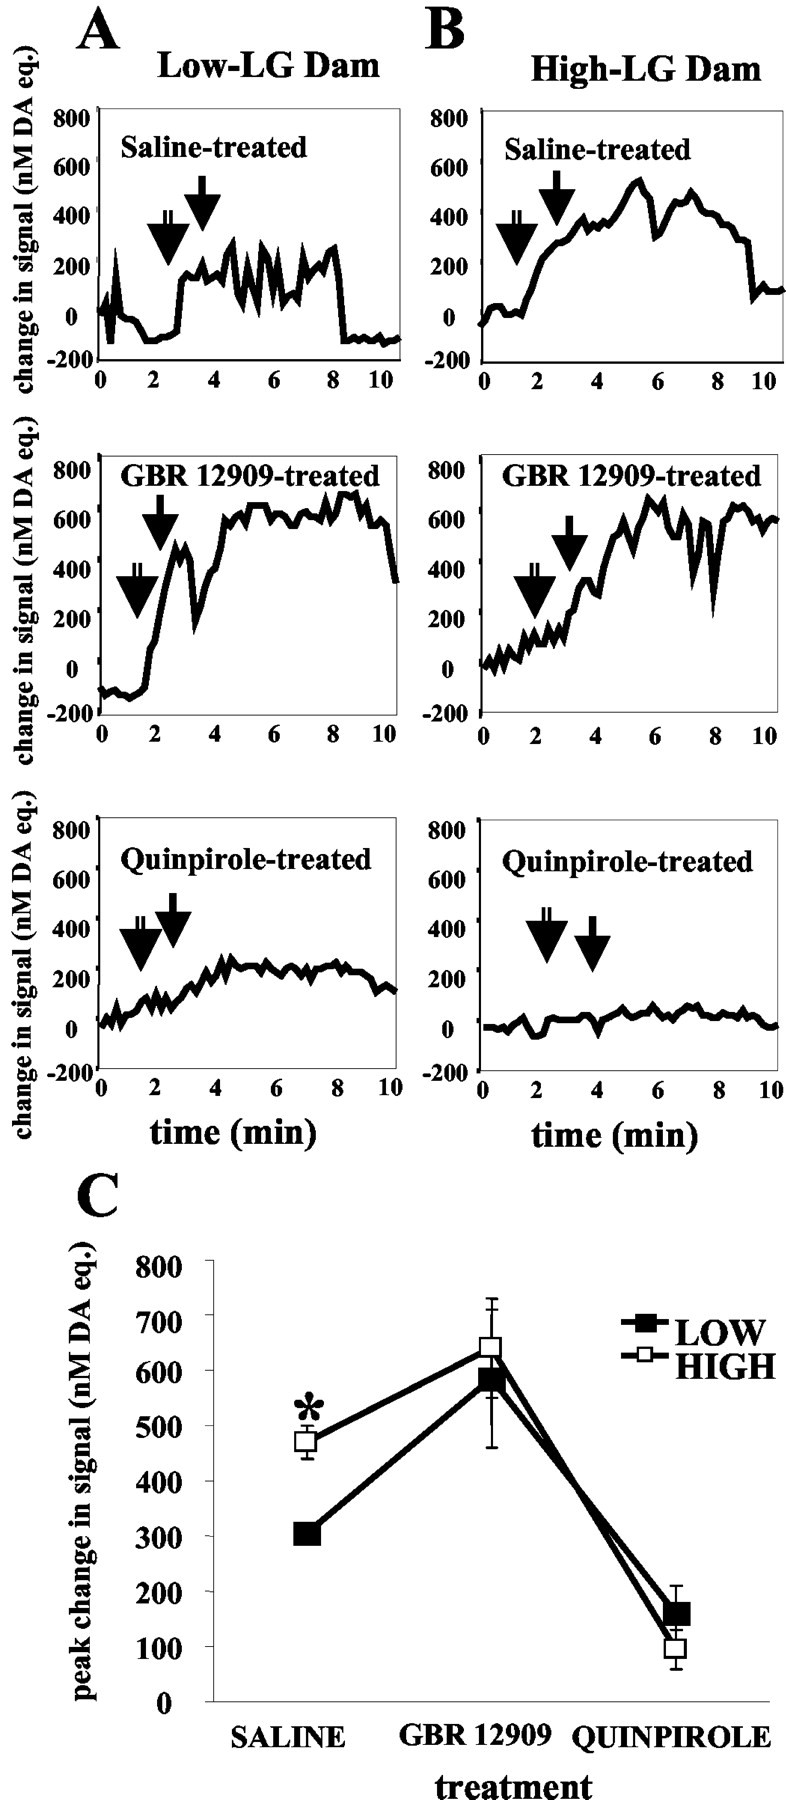
Changes in nanomolar DA equivalent signal in a high-LG dam (A) and a low-LG dam (B) after the brief (1 min) removal of pups from the testing apparatus. The first arrow (open bar) indicates the time of removal of pups, and the second arrow (filled bar) indicates time of return of pups to the testing apparatus. C, Mean ± SEM change in nanomolar DA equivalent signal in the n. Acc of high- and low-LG dams after the brief (1 min) removal of pups from the testing apparatus. Injection of GBR 12909 2 hr before testing resulted in an increase in DA signal (p < 0.05), whereas injection of quinpirole resulted in a decrease in DA signal (p < 0.05) compared with saline treatment.