
Figure 4.
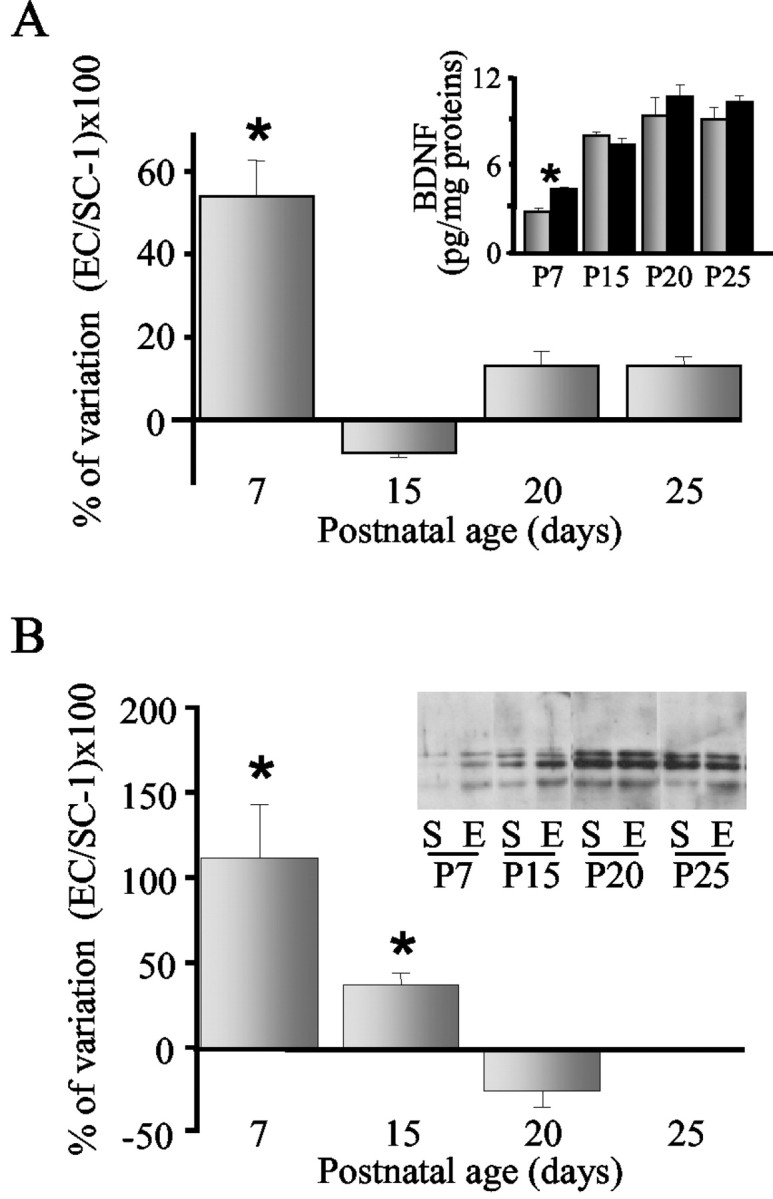
Higher levels of BDNF protein and GAD 65/67 expression in environmentally enriched pups. A, Percentage of variation of BDNF content in EC and SC occipital cortices computed as [(EC/SC) – 1] × 100 at different ages. The asterisk indicates that the BDNF levels in EC and SC groups are different (t test; p < 0.001). Bars indicate SEM. A, Inset, Developmental increase of total protein levels of endogenous BDNF in occipital cortices of EC (black) and SC (gray) mice. B, Percentage of variation of GAD 65/67 expression in EC and SC occipital cortices computed as [(EC/SC) – 1] × 100 at different ages. The asterisk indicates that the GAD 65/67 expression in EC and SC groups is different (t test; p < 0.001). Bars indicate SEM. B, Inset, Representative gel of Western blot for GAD 65/67 expression at different ages in occipital cortices of SC and EC mice.