Fig. 1.
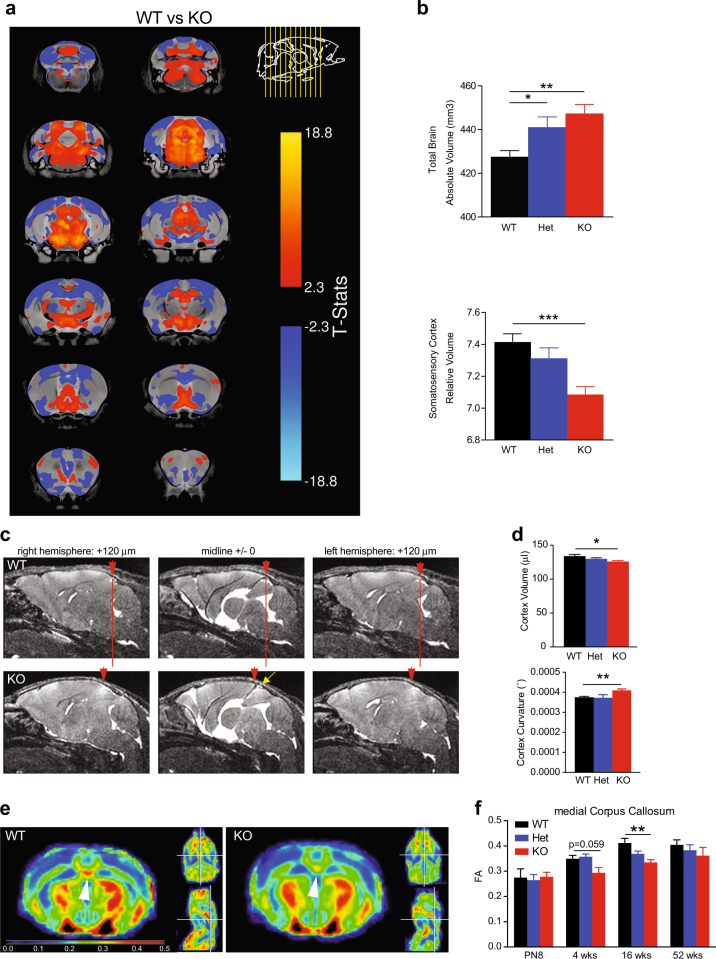
Taok2 KO mice have altered brain morphology and brain activity. a Voxel-wise analysis highlighting significant differences in relative volume (images show the lowest threshold of 5% false discovery rate (FDR) for Taok2 KO mice) throughout the brain between the WT and Taok2 KO mice. T-statistic of 2.3–18.8 indicates decreasing false discovery rate, where 2.3 = 5% FDR and positive or negative T-stat indicates positive or negative change compared with WT brain. b Top: Taok2 KO mice have increased absolute brain volume compared with WT mice (WT = 16, Het = 13, KO = 23 mice from three different cohorts, statistics by linear model; WT vs. KO p = 0.0015, WT vs. Het p = 0.0223). Bottom: the relative volume of the somatosensory cortex is reduced in Taok2 KO mice (WT = 16, Het = 13, KO = 23 mice from three different cohorts, statistics by linear model corrected for multiple comparisons using FDR; WT vs. KO p = 0.0002, WT vs. Het p = 0.5569). c Taok2 KO mice show shortening and increased curvature of the cortex at 4 weeks of age in vivo. Red arrowheads indicate dorsal end of the cortex, red line indicates shortening of the Taok2 KO cortex, and yellow arrow indicates gap between cortex and colliculi. d Top: decreased cortex volume (µl) in Taok2 KO mice (WT = 7, Het = 12, KO = 11 mice from three different cohorts; one-way ANOVA, post hoc Dunnett’s test; F2, 27 = 4.369, p = 0.0027; WT vs. KO p = 0.0129). Bottom: increased curvature of the cortex (° degree × e−006) in Taok2 KO mice brains (WT = 7, Het = 12, KO = 11 from three different cohorts; one-way ANOVA, post hoc Dunnett’s test; F2, 27 = 3.142, p = 0.0593; unpaired t-test; WT vs. KO p = 0.0025). e Representative diffusion tensor images of WT and Taok2 KO mouse brains. White arrowhead indicates reduced fiber density in medial corpus callosum region in Taok2 KO mice. Blue to red indicates increased fractional anisotropy f Reduced fiber track density measured by fractional anisotropy (FA) in the medial corpus callosum of Taok2 KO mice brains. (PN8: WT = 6, Het = 10, KO = 7; 4 weeks: WT = 7, Het = 12, KO = 10; 16 weeks: WT = 7, Het = 15, KO = 11; 52 weeks: WT = 5, Het = 6, KO = 6 mice from three cohorts; one-way ANOVA, post hoc Dunnett’s test; PN8: F2, 20 = 0.08947, p = 0.9148; 4 weeks: F2, 26 = 4.832, p = 0.0164, WT vs. KO p = 0.0598; 16 weeks: F2, 30 = 7.241, p = 0.0027, WT vs. KO p = 0.0013; 52 weeks: F2, 14 = 0.6358, p = 0.5441). *p<0.05, **p<0.01, and ***p<0.001. Values are mean +/- s.e.m.

