
Fig. 7.
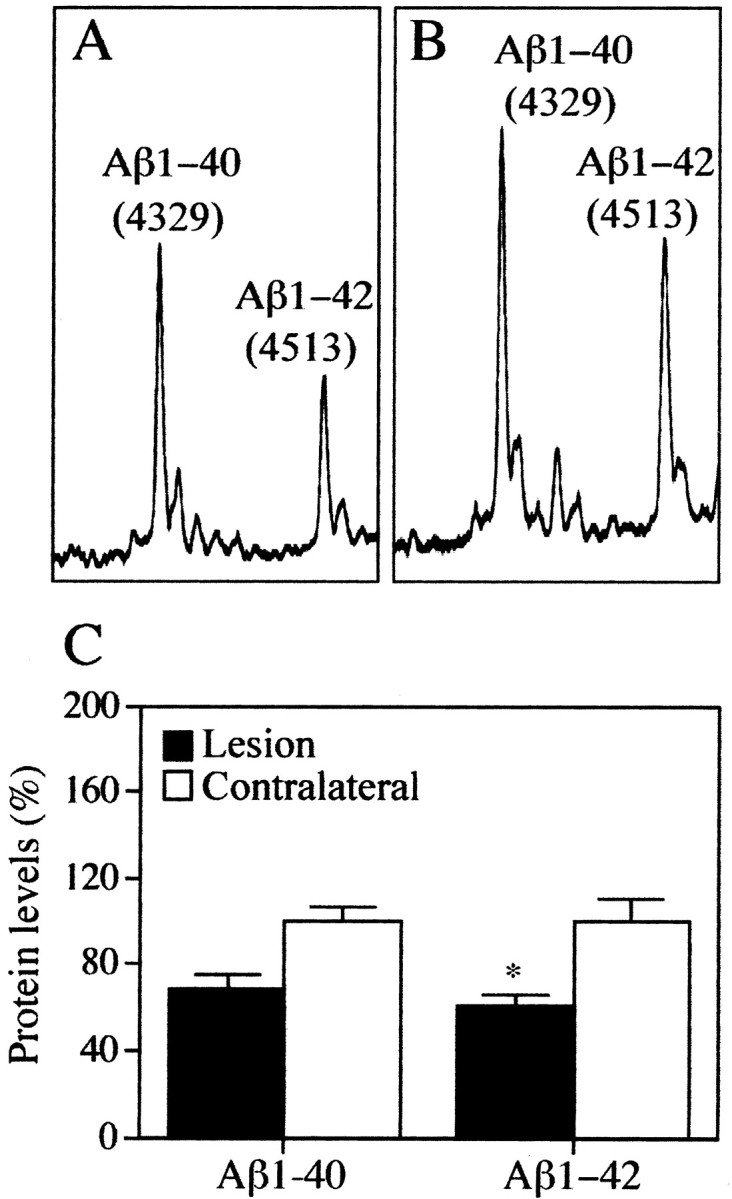
ProteinChip assays for Aβ1-40 and Aβ1-42 in the dentate gyrus ipsilateral (A) and contralateral (B) to an ERC lesion. Aβ1-40 peak corresponds to a mass value of 4329; Aβ1-42 peak has a mass value of 4513. C, Bar graph of Aβ1-40 and Aβ1-42 protein levels ipsilateral and contralateral to ERC lesion by ProteinChip analysis. *p < 0.005 (comparison between lesion and contralateral side).