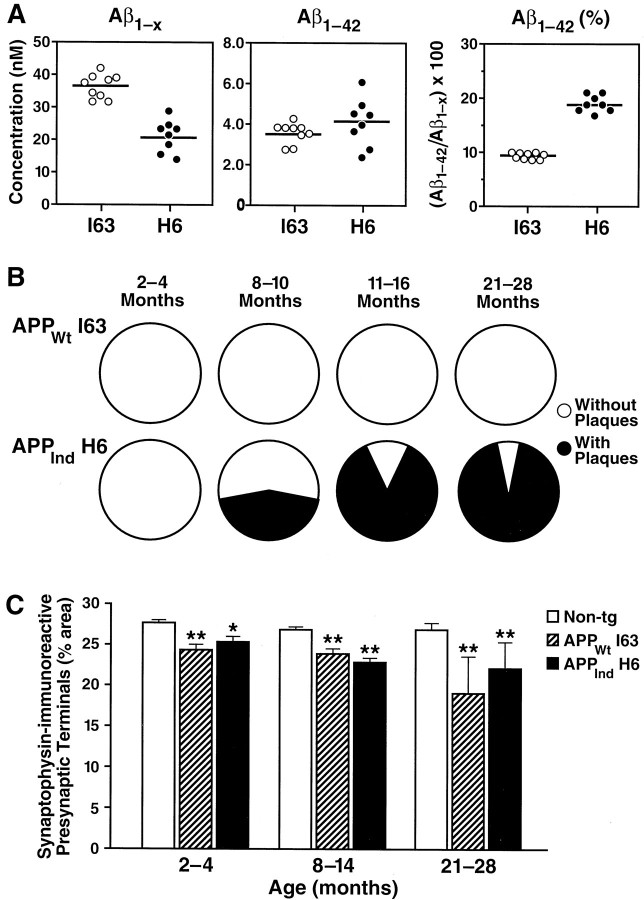
Fig. 7.
Comparison of hippocampal Aβ levels, plaque formation, and density of SYN-IR presynaptic terminals in the high expresser lines APPWt I63 and APPInd H6. Note that the cerebral hAPP mRNA levels in these lines are very well matched (Figs. 1, 2). A, Levels of human Aβ were determined at 2–4 months of age in 8–9 mice per line by ELISA.Circles represent values in individual mice;horizontal lines indicate group means. B, Proportion of mice in which 3D6-immunoreactive plaques were identified (black) at the ages indicated (n = 4–18 mice per line and age range). C, The density of SYN-IR presynaptic terminals was determined in 4–41 mice per genotype and age range. Data represent group means ± SD. *p < 0.05, **p < 0.01 versus nontransgenic controls (Tukey–Kramer post hoctest).

