
Fig. 11.
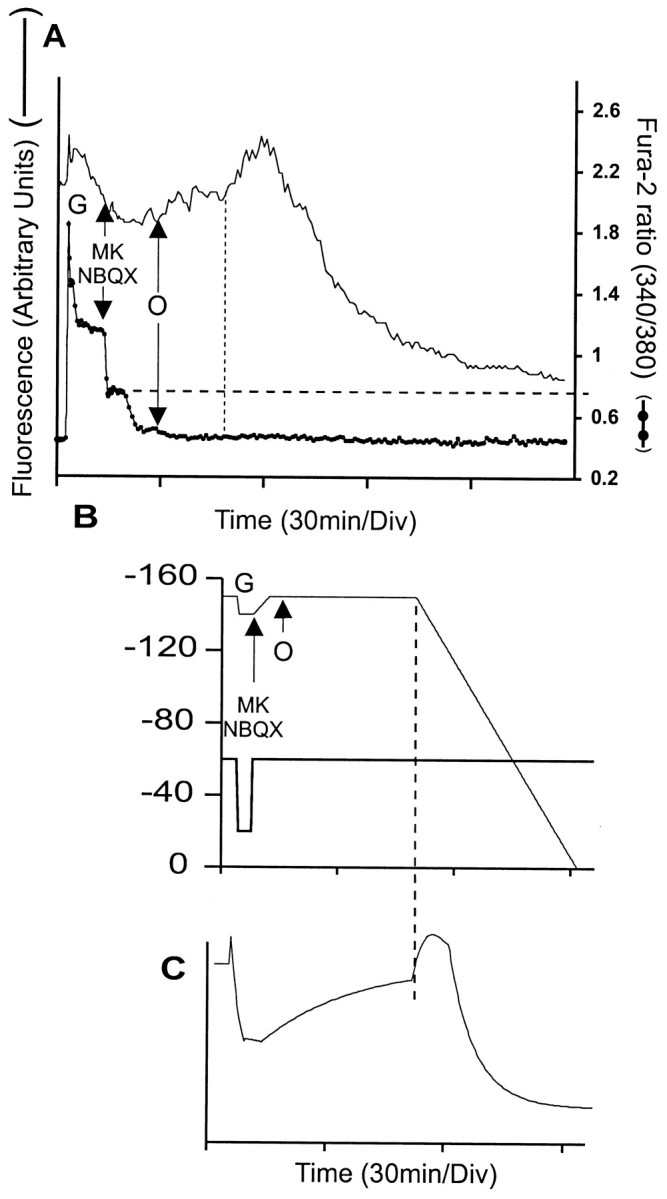
Oligomycin prevents DCD, but not mitochondrial depolarization, in cells after transient exposure to glutamate/glycine. The 7 DIV cells were loaded with fura-2 and TMRM+ as in Figure 6 and exposed to 100 μm glutamate plus 10 μm glycine (G). Where indicated, 10 μm each of MK 801 and NBQX (MK/NBQX) and 5 μg/ml oligomycin (O) were added. The vertical dotted line represents the time point at which mitochondrial depolarization can be detected. The horizontal dashed line shows the set point at which mitochondria become net accumulators of Ca2+. Smooth trace, TMRM+ fluorescence; filled circlestrace, fura-2 fluorescence ratio. B, Time course of Δψp and Δψm input into the simulation; note that the plasma membrane rate constant is taken to bek = 0.02/sec while NMDA receptors are active and 0.003/sec when the receptors are inhibited. C, Cell simulation. The vertical dashed line represents the time point at which mitochondrial depolarization starts.