
Fig. 5.
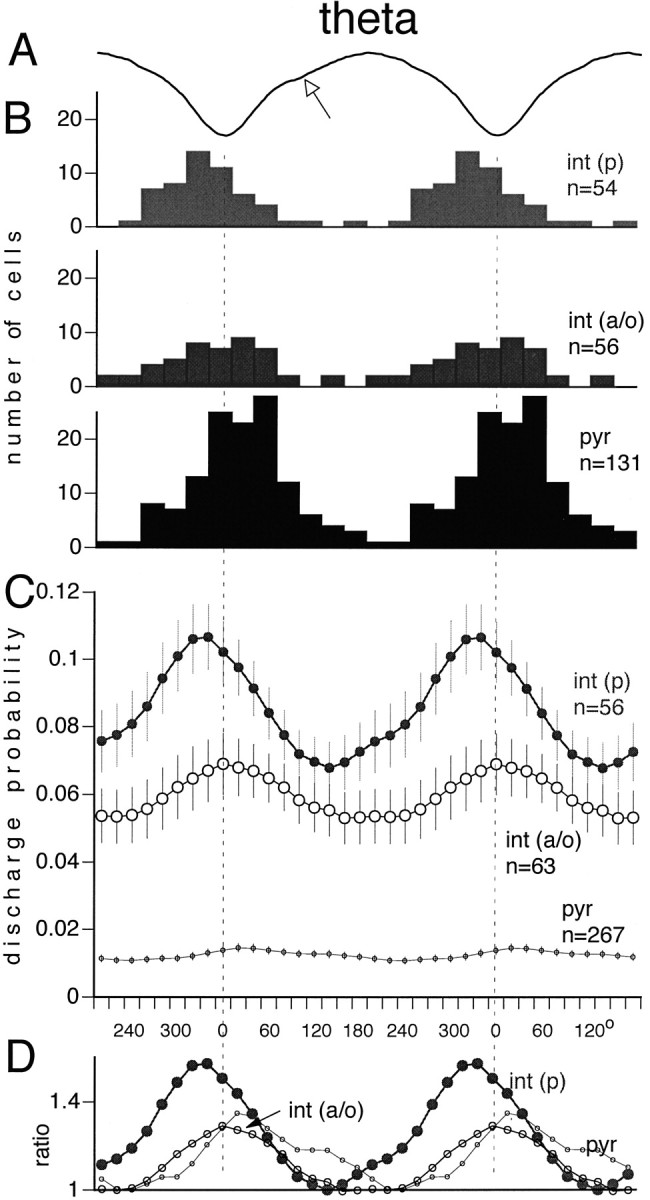
Theta phase modulation of pyr,int(p), and int(a/o). A, Averaged field theta wave. Two theta cycles are shown to facilitate phase comparison with unit discharges. The arrowindicates a “notch” in the waveform, typical in the theta wave of strata oriens and pyramidale. B, Phase distribution of single cells relative to the negative peak of the locally recorded theta waves (dashed vertical lines). The peak of the theta phase histogram was used to determine the preferred phase of a single cell. Only neurons with significant phase modulation are shown (see Materials and Methods). C, Average discharge probability of the neuronal subgroups (mean ± SE). All neurons are included, independent of whether their cross-correlograms showed a significant modulation with theta waves or not. Note thatint(p) preceded pyramidal neurons by ∼60°.D, Normalized probabilities of the different cell groups (depth of theta modulation). The lowest probability value during the theta cycle was regarded as the baseline for each neuronal type, and the probabilities were divided by this value. Note that the strongest inhibition occurs before the highest probability of pyramidal cell discharge.