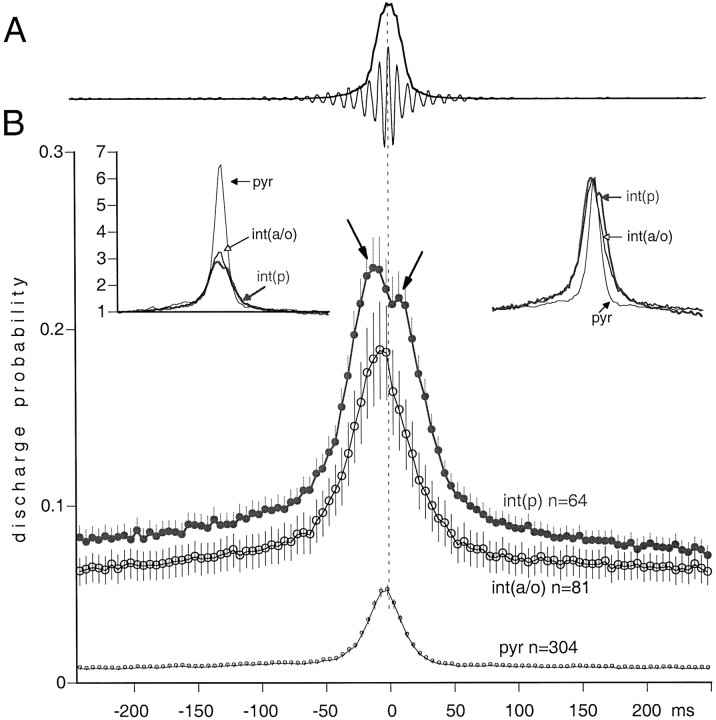
Fig. 6.
Discharge probability of pyr,int(p), and int(a/o) during hippocampal SPW-associated ripples. A, Averaged field ripple wave (thin line) and integrated, squared sum of the ripple (thick line). Neuronal discharges were aligned to the peak of the integrated ripple (time 0).B, Averaged discharge probability of the neuronal subgroups (mean ± SE). Left inset, Normalized probabilities. Each point of the probability curve was divided by the baseline discharge probability (averages of points between −250 and −200 msec). Note the 2.5-fold increase of discharge probability of pyramidal cells relative to that of interneurons during the peak of the ripple. Right inset, The probability distributions of the three groups shown at the same relative scale (0–100%). Note the earlier and longer-lasting discharge of interneurons relative to pyramidal cells.

