
Fig. 10.
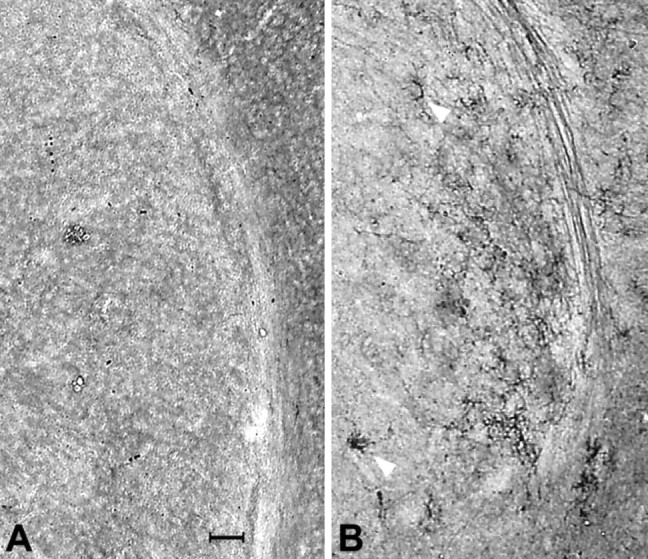
GFAP immunohistochemistry in normal (A) and HZac mouse brain (B) at the level of the striatum.Arrows indicate GFAP-positive cells in the mutant striatum. Scale bar: A, 100 μm.
Official websites use .gov
A
.gov website belongs to an official
government organization in the United States.
Secure .gov websites use HTTPS
A lock (
) or https:// means you've safely
connected to the .gov website. Share sensitive
information only on official, secure websites.
GFAP immunohistochemistry in normal (A) and HZac mouse brain (B) at the level of the striatum.Arrows indicate GFAP-positive cells in the mutant striatum. Scale bar: A, 100 μm.