
Figure 2.
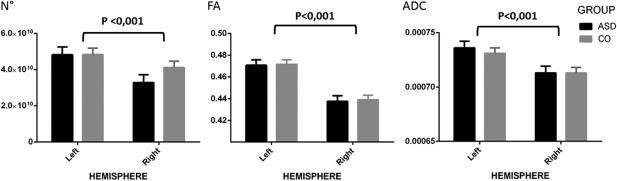
Bar graph showing the mean number of streamlines (N°), mean fractional anisotropy (FA), and mean apparent diffusion coefficient (ADC) in controls and children with ASD. The T‐bars that extend from the boxes represent the standard deviation (SD). Main effects of hemisphere are indicated above the bar graphs (***P < 0.001).