

Abstract
Autism spectrum disorder is a complex neurodevelopmental variant thought to affect 1 in 166 [Fombonne (2003): J Autism Dev Disord 33:365–382]. Individuals with autism demonstrate atypical social interaction, communication, and repetitive behaviors, but can also present enhanced abilities, particularly in auditory and visual perception and nonverbal reasoning. Structural brain differences have been reported in autism, in terms of increased total brain volume (particularly in young children with autism), and regional gray/white matter differences in both adults and children with autism, but the reports are inconsistent [Amaral et al. (2008): Trends Neurosci 31:137–145]. These inconsistencies may be due to differences in diagnostic/inclusion criteria, and age and Intelligence Quotient of participants. Here, for the first time, we used two complementary magnetic resonance imaging techniques, cortical thickness analyses, and voxel‐based morphometry (VBM), to investigate the neuroanatomical differences between a homogenous group of young adults with autism of average intelligence but delayed or atypical language development (often referred to as “high‐functioning autism”), relative to a closely matched group of typically developing controls. The cortical thickness and VBM techniques both revealed regional structural brain differences (mostly in terms of gray matter increases) in brain areas implicated in social cognition, communication, and repetitive behaviors, and thus in each of the core atypical features of autism. Gray matter increases were also found in auditory and visual primary and associative perceptual areas. We interpret these results as the first structural brain correlates of atypical auditory and visual perception in autism, in support of the enhanced perceptual functioning model [Mottron et al. (2006): J Autism Dev Disord 36:27–43]. Hum Brain Mapp, 2010. © 2009 Wiley‐Liss, Inc.
Keywords: autism, brain, MRI, enhanced perceptual functioning model, cortical thickness, voxel‐based‐morphometry
INTRODUCTION
Despite extensive neurobiological research, the structural brain bases of autism remain elusive. An increase in total brain volume has been consistently reported in young children with autism [Courchesne et al.,2001; Hazlett et al.,2005; Sparks et al.,2002; Stanfield et al.,2008]. However, while some studies have found that this increased total brain volume persists in adolescents and adults with autism [Freitag et al.,2009; Hazlett et al.,2006], others have reported a normalization of total brain size [Aylward et al.,2002; Redcay and Courchesne,2005] at these later stages of development. It is also unclear whether the reported increase in total brain volume might be due to gray matter (GM) volume [Hazlett et al.,2006], white matter (WM) volume [Herbert et al.,2004], or some combination of both.
Findings of regional structural brain differences in autism are also inconsistent, particularly with regard to the localization and direction (increases or decreases) of the findings [Amaral et al.,2008; Stanfield et al.,2008]. The inconsistent findings on regional structural brain differences in autism may be due to the heterogeneity within the syndrome, variable inclusion/diagnostic criteria (e.g., individuals with autism of average intelligence but a history of delayed or atypical language development—often referred to as “high‐functioning autism”—versus individuals with “Asperger's syndrome,” who have average intelligence but no language delay) [Kwon et al.,2004; McAlonan et al.,2008], differences in age, gender, intelligence quotient (IQ), matching criteria, with control groups [Craig et al.,2007; Salmond et al.,2007; Spencer et al.,2006], or in the methods used [Amaral et al.,2008; Stanfield et al.,2008].
Many magnetic resonance imaging (MRI) studies on autism have used voxel‐based morphometry (VBM), a technique that gives a probabilistic measure of local GM and WM concentration [Ashburner and Friston,2000]. VBM studies have found both increased and decreased regional GM and WM differences in individuals across the autism spectrum relative to typically developing controls [Abell et al.,1999; Boddaert et al.,2004; Bonilha et al.,2008; McAlonan et al.,2002,2005,2008; Rojas et al.,2006; Waiter et al.,2004]. In the present study, our goal was to investigate the structural brain differences in a homogeneous group of individuals with autism of average intelligence. In reviewing the studies that investigated autistics with average intelligence, the results converge somewhat, but are still not very consistent. For example, in the first VBM study of 15 autistics adults, Abell et al. [1999] found GM decreases in anterior parts of an amygdala‐based system (right paracingulate sulcus, left inferior frontal gyrus) and increased GM in posterior parts (amygdala/peri‐amygdaloid cortex, middle temporal gyrus, inferior temporal gyrus), and in regions of the cerebellum [Abell et al.,1999]. A later VBM study in young adult males with autism revealed similar findings, but in the opposite direction (increase or decrease) for some structures (e.g., left inferior frontal gyrus) [Waiter et al.,2004]. In a study of autistic adults, McAlonan et al. [2002] reported some similar findings to Abell et al. [1999] and Waiter et al. [2004] in terms of GM decreases in frontal, limbic, basal ganglia, parietal, and cerebellar regions, but they also reported some WM changes [McAlonan et al.,2002]. In a later study, McAlonan et al. [2005] obtained consistent findings in a group of children with autism [McAlonan et al.,2005]. Most recently, McAlonan et al. [2008] demonstrated regional GM differences between children with autism of average intelligence but with a history of atypical language development and children with Asperger's, which suggests that the underlying neurobiology across these autism subtypes is at least partly discrete [McAlonan et al.,2008]. These findings stress the importance of considering the history of language acquisition as a valuable tool to refine the study of autism.
While the above VBM studies have successfully demonstrated structural brain differences in autism, the VBM technique is limited by the fact it conflates information about morphology, size, and position [Ashburner and Friston,2001]. In contrast, the measurement of cortical thickness (CT) provides a more direct index of cortical morphology that is less susceptible to positional variance given that the extraction of the cortex follows the GM surface despite local variations in its position [Kim et al.,2005; MacDonald et al.,2000]. Cortical thinning has been demonstrated in adults with autism of average intelligence in frontal, temporal, and parietal areas [Chung et al.,2005; Hadjikhani et al.,2006] that are implicated in social cognition, a core atypical feature in autism. However, another study reported increased CT over the entire cerebral cortex in children with autism, primarily driven by increases in parietal and temporal cortices [Hardan et al.,2006].
The objective of the present study was to investigate structural brain differences in autism by way of a dual‐analytic approach, combining cortical thickness analysis and VBM together for the first time in the same participants. The advantage of combining these two techniques lies in the complementary nature of the two methods, where CT analysis provides a direct and specific measure of cortical GM, and VBM provides an additional (but less specific) measure of cortical GM, but also WM and subcortical structures. In addition, when the CT analysis and VBM results converge, we may have a greater confidence in the results. Special attention was made to study a homogeneous group of participants with autism of average intelligence, who currently has an average verbal ability despite a history of delayed or atypical language development, relative to typically developing young adults closely matched in terms of gender, age, IQ, and handedness. We expected to find region‐specific structural brain differences particularly in frontal, but also in temporal and parietal brain areas that have been implicated in the core features of autism, as well as subcortical differences, potentially in cerebellum, brainstem, amygdala, caudate nucleus, and hippocampus [Amaral et al.,2008; Stanfield et al.,2008].
METHODS
Participants
Two groups of subjects participated in the present study: 15 young adult males with autism (AUT) with average intelligence, and 15 typically developing controls (CTR). Groups were matched on gender, age, full‐scale IQ, and handedness (all participants were right‐handed). There were no significant differences between groups in age (P > 0.1), or IQ (P > 0.1), which was measured by the Wechsler intelligence scales scored with Canadian norms [Wechsler,1991,1997]. The characteristics for the participants are presented in Table I.
Table I.
Subject characteristics
| Group | AUT (n = 15) | CTR (n = 13) |
|---|---|---|
| Age in years (SD/range) | 22.7 (6.4/14–33) | 19.2 (5.0/14–34) |
| Global IQ (SD) | 100.4 (12.6) | 106.6 (12.1) |
| Peformance IQ (SD) | 102.9 (14.2) | 101.7 (14.4) |
| Verbal IQ (SD) | 104.3 (11.4) | 110.0 (8.5) |
| ADI‐R mean cut‐off score (SD) | ||
| Social | 23.9 (4.4) | |
| Communication | 18.1 (4.3) | |
| Behavior | 7.0 (2.3) |
ADI‐R = Autism Diagnostic Interview‐Revised scores for n = 13 AUT.
All participants (AUT and CTR) were recruited from the research database of the Pervasive Developmental Disorders specialized clinic of the Rivière‐des‐Prairies Hospital (Montreal, Canada). The AUT participants were diagnosed using a combination of standard instruments including the Autism Diagnostic Interview‐Revised (ADI‐R) [Lord et al.,1994] the Autism Diagnosis Observation Schedule module 3 or 4 (ADOS‐G) [Lord et al.,2000] combined with clinical evaluation. Thirteen of the 15 AUT participants were assessed with both the ADI‐R and the ADOS‐G. Two AUT participants were assessed with the ADI‐R only, combined with a nonstandardized assessment based on the ADOS, and scored above cut‐off in the three areas of the ADI‐R algorithm. All AUT participants had average intelligence and verbal ability at the time of testing, but had presented one or more of the following atypical language features, including late speech onset, echolalia, pronoun reversal or unambiguous stereotyped sentences. Two of the 15 autistic participants were on medication (i.e., concerta, effexor), but did not take their medication on the day of the experiment.
The CTR participants were screened by way of a questionnaire created in our laboratory to document their medical health background. The CTR participants had no personal or familial history of any autistic traits or any other neurological or psychiatric disorder, and were not using any psychoactive or vasoactive medications.
The present research was conducted according to the Code of Ethics of the World Medical Association (Declaration of Helsinki) and approved by the ethics committee of the Quebec Bioimaging Network. Written informed consent was obtained from all participants, and they were compensated for their time.
Image Acquisition
Anatomical MRI scans were obtained for all participants on the same 3 Tesla Siemens MRI scanner at the “Unité de Neuroimagerie Fonctionnelle” of the “Centre de recherche de l'Institut universitaire de gériatrie de Montréal” using a T1‐weighted, magnetization prepared gradient‐echo (MPRAGE) volume acquisition with a voxel resolution of 1 × 1 × 1 mm3.
Brain Structural Analyses
The T1 anatomical MRIs for all subjects were submitted to “CIVET” (http://wiki.bic.mni.mcgill.ca/index.php/CIVET) [Ad‐Dab'bagh et al.,2006; Zijdenbos et al.,2002] for CT and VBM analyses. First, the T1 images were registered to standard MNI‐space (ICBM152 template) with a 12‐parameter linear transformation [Collins et al.,1994], corrected for signal intensity nonuniformity [Sled et al.,1998], and classified into gray matter (GM), white matter (WM), and cerebrospinal fluid using an automatic tissue classification algorithm [Zijdenbos,1998] that accounted for partial volume effects [Tohka et al.,2004]. The gray and white tissue class maps were then processed independently with the CT and VBM techniques.
Cortical Thickness Analysis
Deformable models were applied to the GM and WM tissue classified maps to create GM and WM surfaces, for each hemisphere separately [Kim et al.,2005; MacDonald et al.,2000], resulting in four surfaces of 41,962 vertices each. The surface deformation algorithm works by first fitting the white matter surface, then expanding outward to find the gray matter and cerebral spinal fluid intersection. Each vertex on the white matter surface is closely related to its gray matter surface counterpart, and CT can thus be defined as the distance between linked vertices or “t‐link” metric [Lerch and Evans,2005]. A CT map was calculated for each subject, where CT was measured at every vertex on the cortical mantle. The CT data were then blurred using a 20‐mm surface‐based diffusion blurring kernel in preparation for statistical analyses [Chung and Taylor,2004].
Voxel‐Based Morphometry
The tissue classified GM and WM maps were smoothed using a Gaussian smoothing kernel of 12‐mm full width at half‐maximum, resulting in three‐dimensional maps of GM and WM concentration. A 12‐mm smoothing kernel was used here, as commonly used in similar VBM experiments, as an ideal compromise to improve the validity of statistical inferences, reduce inter‐individual variation, and to obtain good spatial resolution [Salmond et al.,2002]
Statistical Analyses
Statistical analyses were performed on the CT and VBM data according to the general linear model using age as a covariate. Between‐group comparisons (AUT vs. CTR) were conducted to test for a difference in whole‐brain CT (averaged across all cortical vertices), or total brain GM and WM volume (averaged across all GM or WM voxels), as well as the corresponding regional measures (at each vertex for cortical thickness, or at each voxel for VBM), defined according to the atlas of Duvernoy [1999]. To visualize the results, the CT and VBM results were then projected onto a study‐specific template: either an average cortical surface (for CT), or brain volume (for VBM), which were created by averaging the MRIs across all participants (see Figs. 1 and 2). The CT and VBM results were thresholded at a whole‐brain level using the false discovery rate theory [Genovese et al.,2002] at P < 0.05 level, with corresponding t‐thresholds of 2.3 for the CT data, and 3.7 for the VBM data.
Figure 1.

Group cortical thickness differences. Results from the statistical analysis of cortical thickness data from 15 autistic (AUT) versus 15 typically developing controls (CTR) participants are displayed at each vertex of the surface of a standardized brain (averaged over all participants) in terms of t statistical color maps. Top panel: areas of significant cortical thickness increases (AUT > CTR). Bottom panel: areas of significant cortical thickness decreases (CTR > AUT). aCG = anterior cingulate gyrus, FG = frontal gyri, FusG = fusiform gyrus, HG = Heschl's gyrus, IPL = inferior parietal lobule, LG = lingual gyrus, MedFG = medial frontal gyrus, MOG = middle occipital gyrus, ParaCG = para‐central gyrus, pCG = posterior cingulate gyrus, PostCG = post‐central gyrus, PreCG = pre‐central gyrus, STS = superior temporal sulcus. See Table II for corresponding t values.
Figure 2.
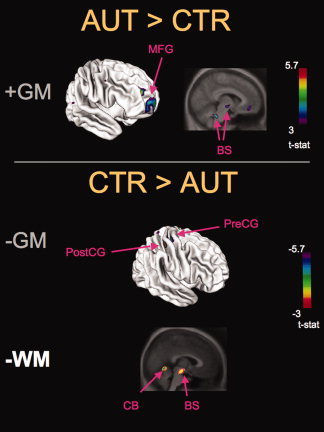
Group VBM differences. Results from the statistical analysis of VBM from 15 autistic (AUT) versus 15 typically developing controls (CTR) participants are displayed in the form of t statistical color maps superimposed on either the surface of a standardized brain (e.g., top left brain image) to facilitate the comparison with the cortical thickness results, or on a standardized brain anatomical MRI volume (e.g. top right brain image) (averaged over all participants). Top panel: areas of significant GM increases (AUT > CTR). Bottom panel: areas of significant GM and WM decreases (CTR > AUT). MFG = middle frontal gyrus, PreCG = pre‐central gyri, PostCG = post‐central gyrus, BS = brainstem, CB = cerebellum. See Table III for corresponding t values.
RESULTS
No Whole‐Brain Cortical Thickness/Volume Differences
There were no significant between‐group differences in terms of whole‐brain (mean) cortical thickness (AUT = 3.35 ± 0.06 mm; CTR = 3.37 ± 0.05 mm, P = 0.94) or the volumes of total GM (AUT = 597 ± 59 cm3; CTR = 597 ± 62 cm3; P = 0.98) or total WM (AUT = 533 ± 47 cm3; CTR = 519 ± 54 cm3; P = 0.47).
Regional Cortical Thickness Differences
The AUT group exhibited significantly thicker cortex relative to CTR (Table II and Fig. 1) in frontal (Brodmann area [BA] 9, 10, 11, and 44/45), temporal (BA 41 and superior temporal sulcus), parietal (BA 39), occipital (BA 17 and 18/19), cingulate gyrus (BA 24, 31, and 32), and fusiform gyri (BA 19/20). The AUT group demonstrated only three areas of significantly thinner cortex GM concentration relative to CTR, specifically the right pre‐ (BA 4) and postcentral gyri (BA 3) and paracentral gyrus (BA 4/5).
Table II.
Group cortical thickness differences
| Brodmann Area (BA) | Hemisphere | Sterotaxic coordinates (MNI‐space) | t‐value at peak vertexa | AUT: cortical thickness value in mm (SD) | CTR: cortical thickness value in mm (SD) | |||
|---|---|---|---|---|---|---|---|---|
| x | y | z | ||||||
| Cortical thickness increases (AUT > CTR) | ||||||||
| Anterior fusiform gyrus | 20 | Left | −40 | −26 | −22 | 2.80 | 3.81 (0.19) | 3.62 (0.20) |
| Anterior superior temporal sulcus | 22 | Left | −54 | −16 | −5 | 3.70 | 3.74 (0.23) | 3.54 (0.10) |
| Dorsal posterior cingulate gyrus | 31 | Left | −2 | −65 | 24 | 2.60 | 3.68 (0.30) | 3.55 (0.20) |
| Heschl's Gyrus | 41 | Left | 31 | −24 | 14 | 3.00 | 3.85 (0.26) | 3.69 (0.21) |
| Lingual gyrus | 17 | Left | −8 | −89 | 3 | 2.50 | 3.06 (0.22) | 2.91 (0.16) |
| Medial frontal gyrus | 10 | Left | −8 | 64 | −1 | 3.80 | 3.13 (0.37) | 2.85 (0.27) |
| Medial oribital frontal gyrus | 11 | Left | −5 | 52 | −16 | 3.70 | 2.90 (0.26) | 2.70 (0.19) |
| Middle frontal gyrus | 9 | Left | −27 | 34 | 41 | 3.30 | 3.50 (0.25) | 3.30 (0.16) |
| Middle frontal gyrus | 10 | Left | −40 | 55 | 8 | 3.50 | 3.34 (0.18) | 3.13 (0.24) |
| Posterior fusiform gyrus | 19 | Left | −21 | −62 | −8 | 3.10 | 3.32 (0.13) | 3.21 (0.12) |
| Posterior superior temporal sulcus | 22 | Left | −48 | −46 | 8 | 2.70 | 3.40 (0.23) | 3.37 (0.18) |
| Ventral posterior cingulate gyrus | 24 | Left | −2 | −11 | 37 | 2.80 | 3.61 (0.28) | 3.48 (0.25) |
| Anterior fusiform gyrus | 20 | Right | 41 | −35 | −20 | 2.50 | 3.70 (0.40) | 3.56 (0.26) |
| Dorsal anterior cingulate gyrus | 32 | Right | 7 | 20 | 32 | 5.00 | 3.72 (0.42) | 3.53 (0.22) |
| Dorsal posterior cingulate gyrus | 31 | Right | 3 | −57 | 20 | 3.20 | 3.79 (0.26) | 3.67 (0.19) |
| Heschl's Gyrus | 41 | Right | 46 | −20 | 12 | 3.00 | 3.63 (0.29) | 3.46 (0.22) |
| Inferior frontal gyrus | 44/45 | Right | 48 | 14 | 24 | 2.70 | 3.41 (0.23) | 3.34 (0.18) |
| Inferior parietal lobule | 39 | Right | 53 | −57 | 35 | 2.80 | 3.44 (0.31) | 3.24 (0.19) |
| Medial frontal gyrus | 10 | Right | 5 | 56 | −3 | 2.50 | 3.42 (0.43) | 3.20 (0.31) |
| Middle frontal gyrus | 10 | Right | 31 | 48 | 24 | 4.00 | 3..30 (0.26) | 3.10 (0.19) |
| Middle occipital gyrus | 18/19 | Right | 45 | −84 | 2 | 2.30 | 3.12 (0.18) | 3.10 (0.23) |
| Superior frontal gyrus | 10 | Right | 13 | 66 | 12 | 3.20 | 2.90 (0.33) | 2.61 (0.31) |
| Superior temporal sulcus | 22 | Right | 45 | −29 | −1 | 3.60 | 3.71 (0.28) | 3.62 (0.16) |
| Cortical thickness decreases (CTR > AUT) | ||||||||
| Paracentral gyrus | 4/5 | Right | 3 | −37 | 72 | −3.70 | 2.78 (0.31) | 2.92 (0.20) |
| Postcentral gyrus | 3 | Right | 50 | −16 | 58 | −2.70 | 2.41 (0.18) | 2.56 (0.15) |
| Precentral gyrus | 4 | Right | 33 | −14 | 68 | −2.50 | 2.74 (0.25) | 2.82 (0.18) |
Results significant at false discovery rate threshold q = 0.05.
Regional VBM Differences
For the VBM analysis, (Table III and Fig. 2) the AUT group had significantly increased GM concentration relative to CTR in frontal brain areas (BA 10 and 11) and in the brainstem, and had decreased GM in the pre‐ (4 and 6) and postcentral (BA 3) gyri. The AUT group had decreased WM in the anterior cerebellum, and brainstem, but no significant WM increases were found.
Table III.
Group VBM differences
| Brodmann Area (BA) | Hemisphere | Sterotaxic coordinates (MNI‐space) | t‐value at peak voxela | |||
|---|---|---|---|---|---|---|
| x | y | z | ||||
| VBM GM increases (AUT > CTR) | ||||||
| Brainstem/midbrain | — | Right | 14 | −11 | −4 | 4.243 |
| Brainstem/midbrain | — | Left | −10 | −12 | −7 | 3.76 |
| Brainstem/reticular formation | — | Left | −7 | −41 | −32 | 4.251 |
| Medial frontal gyrus | 10 | Right | 6 | 69 | −12 | 3.911 |
| Medial oribital frontal gyrus | 11 | Left | −9 | 44 | −11 | 3.716 |
| Middle frontal gyrus | 10 | Right | 28 | 50 | 16 | 5.566 |
| Middle frontal gyrus | 10 | Right | 26 | 42 | 12 | 3.967 |
| Middle frontal gyrus | 10 | Left | −34 | 43 | 13 | 3.958 |
| VBM GM decreases (CTR > AUT) | ||||||
| Postcentral gyrus | 3 | Right | 40 | −33 | 57 | −4.264 |
| Precentral gyrus | 4 | Right | 30 | −23 | 65 | −3.956 |
| Precentral gyrus | 6 | Left | −19 | −21 | 69 | −3.94 |
| VBM WM decreases (CTR > AUT) | ||||||
| Anterior cerebellum | — | Left | −2 | −60 | −6 | −5.713 |
| Brainstem/midbrain | — | Right | 14 | −12 | −4 | −4.22 |
| Brainstem/midbrain | — | Right | 1 | −20 | −13 | −4.062 |
Results significant at false discovery rate threshold q = 0.05
DISCUSSION
In the present study we used a dual‐analytic approach to demonstrate converging and complementary region‐specific CT and VBM differences in a homogeneous group of young adults with autism and average intelligence relative to closely matched typically developing controls. In light of recent structural brain differences found between individuals diagnosed with different subtypes of autism (autism versus Asperger's syndrome) [Kwon et al.,2004; McAlonan et al.,2008], the homogeneity of the present sample (inclusion of only autistic participants of average intelligence who had a delayed language acquisition but now have average verbal ability) is an important improvement over previous structural imaging studies that did not distinguish in terms of autism spectrum subtypes. Moreover, the close matching of our groups in terms of age, IQ, gender, and handedness, reduces potential confounds due to these factors. The combined approach of using both CT and VBM provided the means to directly investigate cortical GM (by CT), and also to investigate subcortical GM and WM (by VBM) in the same group of autistic participants. The converging results found here from the CT and VBM analysis, allows us to make more confident interpretations about the structural brain differences found in autism.
A Dual‐Analytic Approach to Investigating Structural Brain Differences in Autism: Evidence From Cortical Thickness Analysis and Voxel‐Based Morphometry
The autism and control groups did not differ in terms of mean CT or total GM/WM volume over the entire brain. This lack of whole‐brain difference is probably due to the fact that our participants were young adults, and brain volume increases in autism have typically been reported during very young childhood [Courchesne et al.,2001; Hazlett et al.,2005; Sparks et al.,2002], and whether or not this increased brain volume persists into adulthood is controversial [Aylward et al.,2002; Herbert,2005; Palmen et al.,2005; Piven et al.,1996; Redcay and Courchesne,2005]. However, both CT and VBM analyses demonstrated persistent regional structural differences in the autistic group.
As expected, the CT analysis demonstrated regional GM differences in autistic participants particularly in frontal cortex, which is consistent with the location of previous GM differences found in autism, including the middle frontal gyrus [Bonilha et al.,2008; Hadjikhani et al.,2006; McAlonan et al.,2005; Waiter et al.,2004], superior frontal gyrus [Bonilha et al.,2008; Hadjikhani et al.,2006; Waiter et al.,2004], inferior frontal gyrus [Abell et al.,1999; Bonilha et al.,2008; Hadjikhani et al.,2006; McAlonan et al.,2005], and medial orbital frontal cortex [Bonilha et al.,2008; Hadjikhani et al.,2006; McAlonan et al.,2005; Waiter et al.,2004]. The VBM cortical GM results converged with the CT findings in terms of GM increases in middle and medial orbital frontal gyrus. The CT and VBM analyses also converged in terms of finding GM decreases in pre‐ and postcentral gyri, which is consistent with previous findings of GM differences in similar brain areas [Bonilha et al.,2008; Hadjikhani et al.,2006; Rojas et al.,2006]. These converging results from the CT and VBM analyses, point to these frontal and pre‐and postcentral regions as key areas in which brain structure differs in autism.
The CT analysis also demonstrated GM differences in various other cortical areas which are consistent with previous findings in autistic individuals with average intelligence, including the superior temporal sulcus [Boddaert et al.,2004; Hadjikhani et al.,2006], inferior parietal lobule [Bonilha et al.,2008; Hadjikhani et al.,2006], cingulate [Bonilha et al.,2008; Hadjikhani et al.,2006; McAlonan et al.,2005; Waiter et al.,2004], lingual gyrus [Bonilha et al.,2008; Hadjikhani et al.,2006; Waiter et al.,2004], fusiform gyrus [Bonilha et al.,2008; Hadjikhani et al.,2006; McAlonan et al.,2005; Rojas et al.,2006; Waiter et al.,2004], and middle occipital gyrus [Bonilha et al.,2008; Hadjikhani et al.,2006]. In addition, for the first time, the CT analysis revealed thicker GM in primary auditory cortex. These latter results are in contrast to a set of studies by Rojas et al. that failed to find differences in the volume of the primary auditory cortex between adults [Rojas et al.,2002] or children [Rojas et al.,2005] with autism relative to typically developing controls. The fact that Rojas et al. [2002,2005] did not find primary auditory cortical volume differences in autism, or that the present VBM analyses did not completely overlap with the CT findings reported above, may be due to the fact that the CT technique was more sensitive to detect subtle cortical differences in these regions. Support for this claim comes from a recent CT study [Hyde et al.,2007] that demonstrated auditory cortical differences in individuals with a congenital musical disorder (congenital amusia), that were not previously found with the VBM technique in the same individuals [Hyde et al.,2006].
However, unlike the CT technique, VBM provides a way to investigate subcortical GM as well as WM differences. Consistent with previous reports, the VBM analysis revealed subcortical GM differences in the brainstem [Elia et al.,2000; Jou et al.,2008; Stanfield et al.,2008] and WM differences in the cerebellum [Amaral et al.,2008; McAlonan et al.,2005; Stanfield et al.,2008]. Because of the inherent uncertainty of the tissue classification in the brainstem and cerebellum, caution must be used when interpreting differences in these regions as truly corresponding to GM or WM. Nonetheless, the VBM results complement the CT findings by demonstrating GM/WM differences in the brainstem and cerebellum.
Structural Brain Differences Found in Brain Areas That are Functionally Atypical in the Core Features of Autism
The present results are important from a functional perspective since the region‐specific CT and VBM differences were found in brain areas that play a functional role in the core features of autism (social, communication, repetitive behaviors). Regional GM differences were found in socially‐relevant brain areas (inferior frontal cortex, superior temporal sulcus, cingulate gyrus, middle occipital gyrus, fusiform gyrus, and inferior parietal lobule) [for a review of the role of these regions in social cognition in typical development see Adolphs,2001; Redcay,2008] that have been shown to be atypical in autism [Hadjikhani et al.,2006; Redcay,2008], in communication‐related brain areas (superior temporal sulcus and inferior frontal gyrus) that have been shown to be atypical in autism [for a review of the role of these regions in communication in typical development and in autism see Redcay,2008], and in brain areas implicated in repetitive behaviors (orbital frontal gyrus, and anterior cingulate gyrus) [Atmaca et al., 2007; Whiteside et al.2004] that have been shown to be atypical in autism [Rojas et al.,2006]. GM differences were also found in brain areas that play a role in empathic behavior (inferior frontal gyrus, superior temporal sulcus, inferior parietal lobule) [for a review see Hadjikhani et al.,2006], and face‐related areas (pre‐ and postcentral gyri) [Adolphs et al.,1996] that have been shown to be atypical in autism [Hadjikhani et al.,2006].
Neuroanatomical Evidence in Support of the Enhanced Perceptual Functioning Model of Autism
In addition to the brain structural differences found in brain regions that are implicated in the core features of autism, we demonstrate CT increases in autism in visual cortex (middle occipital gyrus), and for the first time, in primary auditory cortex (Heschl's gyrus). While structural differences in the middle occipital gyrus in autism have previously been reported and linked in a general way to social cognition [Hadjikhani et al.,2006], here we propose the novel interpretation that these visual and auditory cortical thickness increases may be related to enhanced low‐level and locally‐oriented visual [Bertone et al.,2005; Dakin and Frith,2005], and auditory [Jarvinen‐Pasley and Heaton,2007; Samson et al.,2006] perception in autism [for a review of the enhanced role and function of perception in autism, see the enhanced perceptual functioning model in Mottron et al.,2006]. An increased role of visual associative areas in autistic participants has been demonstrated in a variety of tasks involving the manipulation of visual stimuli, including problem‐solving tasks [for relevant findings and a review, see Soulieres et al.,2009]. Atypical visual perception in autism, in particular in the form of more local visual analysis, is also related to atypical face perception [Lahaie et al.,2006].
The CT increase found in primary auditory cortex of the autistic group is particularly interesting given that this region is known to play a key role in low‐level pitch perception in typically developing individuals [McDermott and Oxenham,2008; Zatorre,2001], and individuals with autism have enhanced low‐level pitch perception [Bonnel et al.,2003; Heaton,2005; Heaton et al.,2008; Samson et al.,2006]. Moreover, recent functional MRI findings from our laboratory (in the same participants tested here) revealed atypical brain activation in the autistic group in a proximal primary auditory cortical region in response to sounds that varied spectro‐temporally [Samson et al.,2008]. These results motivate future studies to more closely examine the relationship between visual and auditory cortical structure, function, and behavior in autism.
Interpreting the Directionality of Brain Structural Differences in Autism
The present findings of mostly regional increases in cortical GM in the autistic group (versus only three areas of decreased cortical GM) are consistent with regional GM increases found in several other similar structural MRI studies [Bonilha et al.,2008; Hardan et al.,2006; Rojas et al.,2006; Waiter et al.,2004]. Overall, the present study is similar to these studies in the age ranges studied [Rojas et al.,2006; Waiter et al.,2004], the homogeneity of the samples, matched control groups, and structural MRI techniques used. However, the present findings are in contrast to other MRI studies that have principally shown GM decreases [Boddaert et al.,2004; Hadjikhani et al.,2006; McAlonan et al.,2005]. The differences in the direction of results (increases versus decreases) between the present study and the studies by Boddaert et al. [2004] and McAlonan et al. [2005] may be in part due to age‐related differences since these authors studied children with autism, and we studied young adults. Moreover, in the present study, only individuals with autism and average intelligence were included, whereas the Boddaert et al. [2004] study included participants with low‐functioning autism, some of who had severe mental retardation. In contrast to a study by Hadjikhani et al. [2006], here we included a homogeneous sample of young adults with autism (excluding Asperger's syndrome), whereas Hadjikhani et al., [2006] included participants diagnosed with autism, Asperger's syndrome, or a pervasive developmental disorder not otherwise specified. Based on findings of structural brain differences found between subtypes within the autism spectrum (autism vs. Asperger's syndrome) [Kwon et al.,2004; McAlonan et al.,2008], it is plausible that the heterogeneity of the Hadjikhani et al., [2006] sample contributes to the different direction in the GM findings (i.e., regional cortical thinning versus cortical thickening found in our homogeneous sample of only autistic individuals).
A challenging issue in this type of MRI structural brain imaging research is how to interpret the direction of the results (increased versus decreased GM), particularly in the absence of behavioral measures as in the case of the present study. Depending on the function of interest and the interpretation, a regional increase or decrease in GM may reflect a positive or negative symptom of a given disorder [Gernsbacher,2007]. The important point here is that we have found region‐specific brain structural differences in autism in functionally relevant areas that are different from typically developing matched controls.
Microstructural Nature of Brain Structural Differences in Autism
While we have discussed the functional significance of the brain structural differences found here, the underlying structural properties of these results are not trivial to explain. CT and VBM techniques provide a viable index of brain structure differences in autism, but these techniques are not designed to measure microstructural changes. The brain structural differences in autism found here might be the product of atypical neurogenesis, neuronal cell death, production of nonneuronal brain tissues (i.e., glial cells), synaptic pruning, or abnormalities of myelin [Bauman and Kemper,2005]. Consistent with the present findings of increased CT and GM concentration in the prefrontal cortex in the autism group, Casanova et al. [Buxhoeveden et al.,2006; Casanova et al.,2002,2006] have demonstrated that there are an atypical number and width of the smallest cortical columns (minicolumns), as well as increases in neuronal density on the order of 23% [Casanova et al.,2006], in individuals with autism, particularly in prefrontal cortex. The sum of these microstructural changes could amount to structural differences that are detectable on a macrostructural level such as those observed in the present study by way of CT and VBM techniques.
Study Limitations
There are some limitations to our work. First, because our study only addressed a subset of the autism spectrum and that we had a relatively small sample size; the results may not apply to the entire population with this condition. In particular, these results may not apply to individuals with Asperger's syndrome, autism, and low nonverbal IQ, younger autistic individuals, or to individuals with secondary autism. Next, just as many previous structural MRI studies, our study had a cross‐sectional design, which does not allow conclusions about causality. Future structural MRI studies with a longitudinal design will be necessary to trace brain development in autism. Correlations between the structural brain differences found here with behavioral measures, for example visual and auditory perceptual measures, would serve to make stronger inferences about these structural brain differences. Finally, additional imaging techniques that can examine microstructural aspects of GM and WM, such as spectroscopy and T2 relaxometry, will be a key to better understand the underlying etiologies of GM/WM atypicalities in autism.
CONCLUSIONS
In conclusion, here we demonstrate regional structural brain differences in a homogeneous group of individuals with autism for the first time using a dual‐analytic approach, by way of cortical thickness analysis and voxel‐based morphometry. The combination of these two techniques in the same sample of individuals with autism provides complementary information on both cortical and subcortical GM/WM structural differences. The converging nature of the CT and VBM cortical GM differences allow us to make stronger conclusions regarding structural brain differences in autism. These structural differences are key from a functional perspective since differences were found in brain regions that subserve the core atypical features in autism (social, communication, and repetitive behaviors), as well as in enhanced auditory and visual perception. Further studies in other neurodevelopmental conditions will determine the specificity of the present results as a neurobiological marker of autism.
Acknowledgements
The authors thank their participants for their cooperation in taking part in our experiments.
REFERENCES
- Abell F,Krams M,Ashburner J,Passingham R,Friston K,Frackowiak R,Happe F,Frith C,Frith U ( 1999): The neuroanatomy of autism: A voxel‐based whole brain analysis of structural scans. Neuroreport 10: 1647–1651. [DOI] [PubMed] [Google Scholar]
- Ad‐Dab'bagh Y,Lyttelton O,Muehlboeck JS,Lepage C,Einarson D,Mok K,Ivanov O,Vincent RD,Lerch J,Fombonne E and Evans AC ( 2006): The CIVET image‐processing environment: A fully automated comprehensive pipeline for anatomical neuroimaging research In: Corbetta M, editor. NeuroImage. Florence, Italy. [Google Scholar]
- Adolphs R ( 2001): The neurobiology of social cognition. Curr Opin Neurobiol 11: 231–239. [DOI] [PubMed] [Google Scholar]
- Adolphs R,Damasio H,Tranel D,Damasio AR ( 1996): Cortical systems for the recognition of emotion in facial expressions. J Neurosci 16: 7678–7687. [DOI] [PMC free article] [PubMed] [Google Scholar]
- Amaral DG,Schumann CM,Nordahl CW ( 2008): Neuroanatomy of autism. Trends Neurosci 31: 137–145. [DOI] [PubMed] [Google Scholar]
- Ashburner J,Friston KJ ( 2000): Voxel‐based morphometry—The methods. Neuroimage 11( 6, Part 1): 805–821. [DOI] [PubMed] [Google Scholar]
- Ashburner J,Friston KJ ( 2001): Why voxel‐based morphometry should be used. Neuroimage 14: 1238–1243. [DOI] [PubMed] [Google Scholar]
- Atmaca M, Yildirim H, Ozdemir H, Tezcan E, Poyraz AK ( 2007): Volumetric MRI study of key brain regions implicated in obsessive‐compulsive disorder. Prog Neuropsychopharmacol Biol Psychiatry 31( 1): 46–52. [DOI] [PubMed] [Google Scholar]
- Aylward EH,Minshew NJ,Field K,Sparks BF,Singh N ( 2002): Effects of age on brain volume and head circumference in autism. Neurology 59: 175–183. [DOI] [PubMed] [Google Scholar]
- Bauman ML,Kemper TL ( 2005): Neuroanatomic observations of the brain in autism: A review and future directions. Int J Dev Neurosci 23: 183–187. [DOI] [PubMed] [Google Scholar]
- Bertone A,Mottron L,Jelenic P,Faubert J ( 2005): Enhanced and diminished visuo‐spatial information processing in autism depends on stimulus complexity. Brain 128 ( Part 10): 2430–2441. [DOI] [PubMed] [Google Scholar]
- Boddaert N,Chabane N,Gervais H,Good CD,Bourgeois M,Plumet MH,Barthelemy C,Mouren MC,Artiges E,Samson Y,Brunelle F,Frackowiak RS,Zilbovicius M ( 2004): Superior temporal sulcus anatomical abnormalities in childhood autism: A voxel‐based morphometry MRI study. Neuroimage 23: 364–369. [DOI] [PubMed] [Google Scholar]
- Bonilha L,Cendes F,Rorden C,Eckert M,Dalgalarrondo P,Li LM,Steiner CE ( 2008): Gray and white matter imbalance—Typical structural abnormality underlying classic autism? Brain Dev 30: 396–401. [DOI] [PubMed] [Google Scholar]
- Bonnel A,Mottron L,Peretz I,Trudel M,Gallun E,Bonnel AM ( 2003): Enhanced pitch sensitivity in individuals with autism: A signal detection analysis. J Cogn Neurosci 15: 226–235. [DOI] [PubMed] [Google Scholar]
- Buxhoeveden DP,Semendeferi K,Buckwalter J,Schenker N,Switzer R,Courchesne E ( 2006): Reduced minicolumns in the frontal cortex of patients with autism. Neuropathol Appl Neurobiol 32: 483–491. [DOI] [PubMed] [Google Scholar]
- Casanova MF,Buxhoeveden DP,Switala AE,Roy E ( 2002): Minicolumnar pathology in autism. Neurology 58: 428–432. [DOI] [PubMed] [Google Scholar]
- Casanova MF,van Kooten IA,Switala AE,van Engeland H,Heinsen H,Steinbusch HW,Hof PR,Trippe J,Stone J,Schmitz C ( 2006): Minicolumnar abnormalities in autism. Acta Neuropathol 112: 287–303. [DOI] [PubMed] [Google Scholar]
- Chung MK,Taylor J ( 2004): Diffusion smoothing on brain surface via finite element method. In: Biomedical imaging: nano to macro, 2004. IEEE International Symposium on 2004, Arlington, VA, USA. 1: 432–435.
- Chung MK,Robbins SM,Dalton KM,Davidson RJ,Alexander AL,Evans AC ( 2005): Cortical thickness analysis in autism with heat kernel smoothing. Neuroimage 25: 1256–1265. [DOI] [PubMed] [Google Scholar]
- Collins DL,Neelin P,Peters TM,Evans AC ( 1994): Automatic 3D intersubject registration of MR volumetric data in standardized Talairach space. J Comput Assist Tomogr 18: 192–205. [PubMed] [Google Scholar]
- Courchesne E,Karns CM,Davis HR,Ziccardi R,Carper RA,Tigue ZD,Chisum HJ,Moses P,Pierce K,Lord C,Lincoln AJ,Pizzo S,Schreibman L,Haas RH,Akshoomoff NA,Courchesne RY ( 2001): Unusual brain growth patterns in early life in patients with autistic disorder: An MRI study. Neurology 57: 245–254. [DOI] [PubMed] [Google Scholar]
- Craig MC,Zaman SH,Daly EM,Cutter WJ,Robertson DM,Hallahan B,Toal F,Reed S,Ambikapathy A,Brammer M,Murphy CM,Murphy DG ( 2007): Women with autistic‐spectrum disorder: Magnetic resonance imaging study of brain anatomy. Br J Psychiatry 191: 224–228. [DOI] [PubMed] [Google Scholar]
- Dakin S,Frith U ( 2005): Vagaries of visual perception in autism. Neuron 48: 497–507. [DOI] [PubMed] [Google Scholar]
- Duvernoy HM 1999. The Human Brain: Surface, Three‐Dimensional Sectional Anatomy with MRI, and Blood Supply Austria: Springer‐Verlag/Wien; 491 p. [Google Scholar]
- Elia M,Ferri R,Musumeci SA,Panerai S,Bottitta M,Scuderi C ( 2000): Clinical correlates of brain morphometric features of subjects with low‐functioning autistic disorder. J Child Neurol 15: 504–508. [DOI] [PubMed] [Google Scholar]
- Fombonne E ( 2003): Epidemiological surveys of autism and other pervasive developmental disorders: An update. J Autism Dev Disord 33: 365–382. [DOI] [PubMed] [Google Scholar]
- Freitag CM,Luders E,Hulst HE,Narr KL,Thompson PM,Toga AW,Krick C,Konrad C ( 2009): Total brain volume and corpus callosum size in medication‐naive adolescents and young adults with autism spectrum disorder. Biol Psychiatry 66( 4): 316–319. [DOI] [PMC free article] [PubMed] [Google Scholar]
- Genovese CR,Lazar NA,Nichols T ( 2002): Thresholding of statistical maps in functional neuroimaging using the false discovery rate. Neuroimage 15: 870–878. [DOI] [PubMed] [Google Scholar]
- Gernsbacher MA ( 2007): The eye of the beholder Psychol Sci (The Observer) 20, Chicago, USA, pp. 44–45. [Google Scholar]
- Hadjikhani N,Joseph RM,Snyder J,Tager‐Flusberg H ( 2006): Anatomical differences in the mirror neuron system and social cognition network in autism. Cereb Cortex 16: 1276–1282. [DOI] [PubMed] [Google Scholar]
- Hardan AY,Muddasani S,Vemulapalli M,Keshavan MS,Minshew NJ ( 2006): An MRI study of increased cortical thickness in autism. Am J Psychiatry 163: 1290–1292. [DOI] [PMC free article] [PubMed] [Google Scholar]
- Hazlett HC,Poe M,Gerig G,Smith RG,Provenzale J,Ross A,Gilmore J,Piven J ( 2005): Magnetic resonance imaging and head circumference study of brain size in autism: Birth through age 2 years. Arch Gen Psychiatry 62: 1366–1376. [DOI] [PubMed] [Google Scholar]
- Hazlett HC,Poe MD,Gerig G,Smith RG,Piven J ( 2006): Cortical gray and white brain tissue volume in adolescents and adults with autism. Biol Psychiatry 59: 1–6. [DOI] [PubMed] [Google Scholar]
- Heaton P ( 2005): Interval and contour processing in autism. J Autism Dev Disord 35: 787–793. [DOI] [PubMed] [Google Scholar]
- Heaton P,Williams K,Cummins O,Happe F ( 2008): Autism and pitch processing splinter skills: A group and subgroup analysis. Autism 12: 203–219. [DOI] [PubMed] [Google Scholar]
- Herbert MR ( 2005): Large brains in autism: The challenge of pervasive abnormality. Neuroscientist 11: 417–440. [DOI] [PubMed] [Google Scholar]
- Herbert MR,Ziegler DA,Makris N,Filipek PA,Kemper TL,Normandin JJ,Sanders HA,Kennedy DN,Caviness VS Jr ( 2004): Localization of white matter volume increase in autism and developmental language disorder. Ann Neurol 55: 530–540. [DOI] [PubMed] [Google Scholar]
- Hyde KL,Zatorre RJ,Griffiths TD,Lerch JP,Peretz I ( 2006): Morphometry of the amusic brain: A two‐site study. Brain 129 ( Part 10): 2562–2570. [DOI] [PubMed] [Google Scholar]
- Hyde KL,Lerch JP,Zatorre RJ,Griffiths TD,Evans AC,Peretz I ( 2007): Cortical thickness in congenital amusia: When less is better than more. J Neurosci 27: 13028–13032. [DOI] [PMC free article] [PubMed] [Google Scholar]
- Jarvinen‐Pasley A,Heaton P ( 2007): Evidence for reduced domain‐specificity in auditory processing in autism. Dev Sci 10: 786–793. [DOI] [PubMed] [Google Scholar]
- Jou RJ,Minshew NJ,Melhem NM,Keshavan MS,Hardan AY ( 2009): Brainstem volumetric alterations in children with autism. Psychol Med 39 ( 8): 1347–1354. [DOI] [PMC free article] [PubMed] [Google Scholar]
- Kim JS,Singh V,Lee JK,Lerch J,Ad‐Dab'bagh Y,MacDonald D,Lee JM,Kim SI,Evans AC ( 2005): Automated 3‐D extraction and evaluation of the inner and outer cortical surfaces using a Laplacian map and partial volume effect classification. Neuroimage 27: 210–221. [DOI] [PubMed] [Google Scholar]
- Kwon H,Ow AW,Pedatella KE,Lotspeich LJ,Reiss AL ( 2004): Voxel‐based morphometry elucidates structural neuroanatomy of high‐functioning autism and Asperger syndrome. Dev Med Child Neurol 46: 760–764. [DOI] [PubMed] [Google Scholar]
- Lahaie A,Mottron L,Arguin M,Berthiaume C,Jemel B,Saumier D ( 2006): Face perception in high‐functioning autistic adults: Evidence for superior processing of face parts, not for a configural face‐processing deficit. Neuropsychology 20: 30–41. [DOI] [PubMed] [Google Scholar]
- Lerch JP,Evans AC ( 2005): Cortical thickness analysis examined through power analysis and a population simulation. Neuroimage 24: 163–173. [DOI] [PubMed] [Google Scholar]
- Lord C,Rutter M,Le Couteur A ( 1994): Autism diagnostic interview‐revised: A revised version of a diagnostic interview for caregivers of individuals with possible pervasive developmental disorders. J Autism Dev Disord 24: 659–685. [DOI] [PubMed] [Google Scholar]
- Lord C,Risi S,Lambrecht L,Cook EH Jr,Leventhal BL,DiLavore PC,Pickles A,Rutter M ( 2000): The autism diagnostic observation schedule‐generic: A standard measure of social and communication deficits associated with the spectrum of autism. J Autism Dev Disord 30: 205–223. [PubMed] [Google Scholar]
- MacDonald D,Kabani N,Avis D,Evans AC ( 2000): Automated 3‐D extraction of inner and outer surfaces of cerebral cortex from MRI. Neuroimage 12: 340–356. [DOI] [PubMed] [Google Scholar]
- McAlonan GM,Daly E,Kumari V,Critchley HD,van Amelsvoort T,Suckling J,Simmons A,Sigmundsson T,Greenwood K,Russell A,Schmitz N,Happe F,Howlin P,Murphy DG ( 2002): Brain anatomy and sensorimotor gating in Asperger's syndrome. Brain 125 ( Part 7): 1594–1606. [DOI] [PubMed] [Google Scholar]
- McAlonan GM,Cheung V,Cheung C,Suckling J,Lam GY,Tai KS,Yip L,Murphy DG,Chua SE ( 2005): Mapping the brain in autism. A voxel‐based MRI study of volumetric differences and intercorrelations in autism. Brain 128 ( Part 2): 268–276. [DOI] [PubMed] [Google Scholar]
- McAlonan GM,Suckling J,Wong N,Cheung V,Lienenkaemper N,Cheung C,Chua SE ( 2008): Distinct patterns of grey matter abnormality in high‐functioning autism and Asperger's syndrome. J Child Psychol Psychiatry 49: 1287–1295. [DOI] [PubMed] [Google Scholar]
- McDermott JH,Oxenham AJ ( 2008): Music perception, pitch, and the auditory system. Curr Opin Neurobiol 18: 452–463. [DOI] [PMC free article] [PubMed] [Google Scholar]
- Mottron L,Dawson M,Soulieres I,Hubert B,Burack J ( 2006): Enhanced perceptual functioning in autism: An update, and eight principles of autistic perception. J Autism Dev Disord 36: 27–43. [DOI] [PubMed] [Google Scholar]
- Palmen SJ,Hulshoff Pol HE,Kemner C,Schnack HG,Durston S,Lahuis BE,Kahn RS,Van Engeland H ( 2005): Increased gray‐matter volume in medication‐naive high‐functioning children with autism spectrum disorder. Psychol Med 35: 561–570. [DOI] [PubMed] [Google Scholar]
- Piven J,Arndt S,Bailey J,Andreasen N ( 1996): Regional brain enlargement in autism: A magnetic resonance imaging study. J Am Acad Child Adolesc Psychiatry 35: 530–536. [DOI] [PubMed] [Google Scholar]
- Redcay E ( 2008): The superior temporal sulcus performs a common function for social and speech perception: Implications for the emergence of autism. Neurosci Biobehav Rev 32: 123–142. [DOI] [PubMed] [Google Scholar]
- Redcay E,Courchesne E ( 2005): When is the brain enlarged in autism? A meta‐analysis of all brain size reports. Biol Psychiatry 58: 1–9. [DOI] [PubMed] [Google Scholar]
- Rojas DC,Bawn SD,Benkers TL,Reite ML,Rogers SJ ( 2002): Smaller left hemisphere planum temporale in adults with autistic disorder. Neurosci Lett 328: 237–240. [DOI] [PubMed] [Google Scholar]
- Rojas DC,Camou SL,Reite ML,Rogers SJ ( 2005): Planum temporale volume in children and adolescents with autism. J Autism Dev Disord 35: 479–486. [DOI] [PubMed] [Google Scholar]
- Rojas DC,Peterson E,Winterrowd E,Reite ML,Rogers SJ,Tregellas JR ( 2006): Regional gray matter volumetric changes in autism associated with social and repetitive behavior symptoms. BMC Psychiatry 6: 56. [DOI] [PMC free article] [PubMed] [Google Scholar]
- Salmond CH,Ashburner J,Vargha‐Khadem F,Connelly A,Gadian DG,Friston KJ ( 2002): Distributional assumptions in voxel‐based morphometry. Neuroimage 17: 1027–1030. [PubMed] [Google Scholar]
- Salmond CH,Vargha‐Khadem F,Gadian DG,de Haan M,Baldeweg T ( 2007): Heterogeneity in the patterns of neural abnormality in autistic spectrum disorders: Evidence from ERP and MRI. Cortex 43: 686–699. [DOI] [PubMed] [Google Scholar]
- Samson F,Mottron L,Jemel B,Belin P,Ciocca V ( 2006): Can spectro‐temporal complexity explain the autistic pattern of performance on auditory tasks? J Autism Dev Disord 36: 65–76. [DOI] [PubMed] [Google Scholar]
- Samson F,Zeffiro TA,Soulières I,Ahad P,Mendrek A,Mottron L ( 2008): Spectral and temporal auditory processing in autism: An fMRI study. International Meeting for Autism Research (IMFAR), London, UK.
- Sled JG,Zijdenbos AP,Evans AC ( 1998): A nonparametric method for automatic correction of intensity nonuniformity in MRI data. IEEE Trans Med Imaging 17: 87–97. [DOI] [PubMed] [Google Scholar]
- Soulieres I,Dawson M,Samson F,Barbeau EB,Sahyoun CP,Strangman GE,Zeffiro TA,Mottron L ( 2009): Enhanced visual processing contributes to matrix reasoning in autism. Hum Brain Mapping [Epub ahead of print]. [DOI] [PMC free article] [PubMed] [Google Scholar]
- Sparks BF,Friedman SD,Shaw DW,Aylward EH,Echelard D,Artru AA,Maravilla KR,Giedd JN,Munson J,Dawson G,Dager SR ( 2002): Brain structural abnormalities in young children with autism spectrum disorder. Neurology 59: 184–192. [DOI] [PubMed] [Google Scholar]
- Spencer MD,Moorhead TW,Lymer GK,Job DE,Muir WJ,Hoare P,Owens DG,Lawrie SM,Johnstone EC ( 2006): Structural correlates of intellectual impairment and autistic features in adolescents. Neuroimage 33: 1136–1144. [DOI] [PubMed] [Google Scholar]
- Stanfield AC,McIntosh AM,Spencer MD,Philip R,Gaur S,Lawrie SM ( 2008): Towards a neuroanatomy of autism: A systematic review and meta‐analysis of structural magnetic resonance imaging studies. Eur Psychiatry 23: 289–299. [DOI] [PubMed] [Google Scholar]
- Tohka J,Zijdenbos A,Evans A ( 2004): Fast and robust parameter estimation for statistical partial volume models in brain MRI. Neuroimage 23: 84–97. [DOI] [PubMed] [Google Scholar]
- Waiter GD,Williams JH,Murray AD,Gilchrist A,Perrett DI,Whiten A ( 2004): A voxel‐based investigation of brain structure in male adolescents with autistic spectrum disorder. Neuroimage 22: 619–625. [DOI] [PubMed] [Google Scholar]
- Wechsler D ( 1991): Wechsler Intelligence Scale for Children, 3rd ed Toronto, Canada: Canadian (WISC‐III). [Google Scholar]
- Wechsler D ( 1997): WAIS‐III: Administration and Scoring Manual: Wechsler Adult Intelligence Scale, 3rd ed San Antonio, TX: Psychological Corporation. [Google Scholar]
- Whiteside SP, Port JD, Abramowitz JS ( 2004): A meta‐analysis of functional neuroimaging in obsessive‐compulsive disorder. Psychiatry Res 132( 1): 69–79. [DOI] [PubMed] [Google Scholar]
- Zatorre RJ ( 2001): Neural specializations for tonal processing. Ann N Y Acad Sci 930: 193–210. [DOI] [PubMed] [Google Scholar]
- Zijdenbos AP,Forghani R,Evans AC ( 1998): Automatic quantification of MS lesions in 3D MRI brain data sets: Validation of INSECT. In: Proceedings of the First International Conference on Medical Image Computing and Computer‐Assisted Intervention, Springer‐Verlag. pp. 439–448.
- Zijdenbos AP,Forghani R,Evans AC ( 2002): Automatic “pipeline” analysis of 3‐D MRI data for clinical trials: Application to multiple sclerosis. IEEE Trans Med Imaging 21: 1280–1291. [DOI] [PubMed] [Google Scholar]