

Abstract
ASD involves a fundamental impairment in processing social‐communicative information from faces. Several recent studies have challenged earlier findings that individuals with autism spectrum disorder (ASD) have no activation of the fusiform gyrus (fusiform face area, FFA) when viewing faces. In this study, we examined activation to faces in the broader network of face‐processing modules that comprise what is known as the social brain. Using 3T functional resonance imaging, we measured BOLD signal changes in 10 ASD subjects and 7 healthy controls passively viewing nonemotional faces. We replicated our original findings of significant activation of face identity‐processing areas (FFA and inferior occipital gyrus, IOG) in ASD. However, in addition, we identified hypoactivation in a more widely distributed network of brain areas involved in face processing [including the right amygdala, inferior frontal cortex (IFC), superior temporal sulcus (STS), and face‐related somatosensory and premotor cortex]. In ASD, we found functional correlations between a subgroup of areas in the social brain that belong to the mirror neuron system (IFC, STS) and other face‐processing areas. The severity of the social symptoms measured by the Autism Diagnostic Observation Schedule was correlated with the right IFC cortical thickness and with functional activation in that area. When viewing faces, adults with ASD show atypical patterns of activation in regions forming the broader face‐processing network and social brain, outside the core FFA and IOG regions. These patterns suggest that areas belonging to the mirror neuron system are involved in the face‐processing disturbances in ASD. Hum Brain Mapp, 2007. © 2006 Wiley‐Liss, Inc.
Keywords: autism spectrum disorder, face perception, fusiform gyrus, amygdala, mirror neuron system, social brain, visual processing
INTRODUCTION
Autism spectrum disorder (ASD) is a behaviorally defined neurodevelopmental disorder affecting as many as 1 in 166 children [Fombonne, 2003]. Defining features of ASD include mild to severe qualitative impairment in communicative abilities and in reciprocal interactions as well as repetitive and stereotyped behaviors. Among the most characteristic social‐communicative impairments in ASD is a failure to use information from faces, such as eye gaze, facial expression, and facial speech, to regulate social interaction [Lord et al., 1994, 2000; American Psychiatric Association, 2000].
Face perception is mediated by a distributed neural system [for reviews, see Haxby et al., 2000; Johnson, 2005]. The face‐processing network is involved in face identification [fusiform face area (FFA), inferior occipital gyrus (IOG)], gaze perception [superior temporal sulcus (STS)], and emotion evaluation of facial expression [amygdala, insula, limbic system, sensorimotor cortex, inferior frontal cortex (IFC)] [Nakamura et al., 1999; de Gelder et al., 2003; Johnson, 2005]. Several areas involved in face processing (IFC, STS) also belong to the mirror neuron system (MNS) and/or the “social brain” (STS, amygdala) [Brothers, 1990]. The MNS generates internal representations of actions performed either by the subject or by another person [Gallese et al., 2004]. It has been hypothesized to provide the neural basis of “mind reading” and empathy [Gallese, 2003; Leslie et al., 2004] and may play an important role in autistic social deficits [Williams et al., 2001, 2005; Dapretto et al., 2006; Hadjikhani et al., 2006].
Initial fMRI studies [Schultz et al., 2000; Pierce et al., 2001] described a lack of FFA activation in response to emotionally neutral faces in individuals with ASD. However, unlike patients with fusiform gyrus damage, individuals with ASD are generally not prosopagnosic, and their face‐processing deficits appear to be more complex than those that would be entailed by a basic deficit in face identification. Several recent studies have shown that visual scanning of faces is abnormal in individuals with autism and characterized by a tendency to look less at the inner features of the face, particularly the eyes [Klin et al., 2002; Pelphrey et al., 2002; Dalton et al., 2005; but see van der Geest et al., 2002]. Not looking at the eye region can have profound behavioral consequences, as recently underlined by Adolphs et al. [ 2005; see also Pelphrey et al., 2002, 2004a; Dalton et al., 2005]. It may be that in studies that failed to find FFA activation, subjects were not adequately inspecting areas of the face that are critical for face identification and discrimination.
A number of recent studies have demonstrated FFA activation in ASD subjects [Aylward et al., 2004; Hadjikhani et al., 2004; Pierce et al., 2004; Dalton et al., 2005]. In our initial study, we found that ASD subjects had significant activation in the FFA when continuously cued to attend to the eye region (with a central fixation cross). Furthermore, ASD subjects showed the same differential pattern of activation in the ventral temporal cortex to faces (lateral fusiform/FFA) compared to nonface objects (medial fusiform) as did normal controls, contradicting the claim that autistic individuals use mechanisms associated with basic‐level object recognition to discriminate among faces [Schultz et al., 2000]. We concluded from our first study that face‐processing deficiencies in autism could not be reduced to dysfunction of the FFA and suggested that abnormalities had to be sought at other nodes in the face‐processing system.
In our earlier study, analysis was limited by a slice prescription that only covered the posterior third of the brain. In the present study, we reapplied our stimulus paradigm to a new group of subjects with ASD (one participant, subject 8, also took part in our first study) in order to assess the replicability of our previous finding of significant activation in the FFA. Furthermore, we extended our observations to the entire brain in order to assess ASD‐specific abnormalities across all of the neural circuitry involved in face processing [Haxby et al., 2000, 2002; Ishai et al., 2005], including the IOG, STS, IFC, the somatosensory cortex (S1), the premotor cortex (PM), and the amygdala. Based on our previous finding of cortical thinning of the MNS in ASD [Hadjikhani et al., 2006] as well as other findings of activation of MNS areas in passive viewing of faces in healthy subjects [Kesler‐West et al., 2001; Ishai et al., 2004, 2005], we were particularly interested in examining the pattern of activation in MNS areas (IFC, STS) and their role in modulating other areas of the face‐processing network. Toward the latter goal, we conducted exploratory correlational analyses to assess patterns of coactivation across brain areas in response to face stimuli. Finally, we examined associations between brain activation to faces and autism symptom severity in the social domain.
MATERIALS AND METHODS
Participants
The Massachusetts General Hospital Human Studies Committee and the Boston University Internal Review Board approved all procedures under protocol 2002P‐000228 and BU H22800. After complete description of the study to the subjects, written informed consent was obtained. Ten adult high‐functioning (IQ: 124 ± 10) ASD subjects (eight male; mean age, 34 ± 11 years) and seven healthy controls (four male; mean age, 35 ± 12 years) participated in the study [WASI, 1999]. Functional data from one ASD participant was discarded because of excessive motion artifacts. The ASD participants were diagnosed with autism (six subjects), Asperger disorder (three subjects), or pervasive developmental disorder not otherwise specified (one subject) by an experienced clinician on the basis of their current presentation and developmental history. The diagnoses were confirmed using the Autism Diagnostic Interview—Revised (ADI‐R) [Lord et al., 1994] and the Autism Diagnostic Observation Schedule (ADOS; Table I) [Lord et al., 2000].
Table 1.
Participant characteristics
| VIQ | PIQ | FSIQ | ADI‐R | ADOS | Diagnosis | |||||
|---|---|---|---|---|---|---|---|---|---|---|
| Communication | Social | Repetitive behaviors | Communication | Social | Total | |||||
| Subject 1 | 131 | 117 | 127 | 16 | 22 | 8 | 3 | 10 | 13 | Autism |
| Subject 2 | 131 | 128 | 133 | 9 | 12 | 4 | 3 | 9 | 12 | Autism |
| Subject 3 | 119 | 109 | 116 | 7 | 14 | 3 | 7 | 8 | 15 | Asperger |
| Subject 4 | 106 | 121 | 115 | 5 | 21 | 5 | 3 | 6 | 9 | Asperger |
| Subject 5 | 119 | 106 | 114 | 9 | 14 | 8 | 2 | 7 | 9 | Autism |
| Subject 6 | 141 | 127 | 139 | 14 | 14 | 5 | 3 | 8 | 11 | Autism |
| Subject 7 | 112 | 111 | 114 | 8 | 14 | 5 | 2 | 4 | 6 | PDDNOS |
| Subject 8 | 117 | 119 | 120 | 7 | 15 | 5 | 1 | 5 | 6 | Asperger |
| Subject 9a | 139 | 125 | 136 | 20 | 18 | 5 | 3 | 7 | 10 | Autism |
| Subject 10 | 131 | 119 | 128 | 12 | 17 | 7 | 2 | 7 | 9 | Autism |
Excluded for motion. VIQ: verbal IQ; PIQ: performance IQ; FSIQ: full scale IQ; PPDNOS: pervasive developmental disorder‐not otherwise specified.
Imaging Data
Anatomical and functional MR images of brain activity were collected in a 3T high‐speed echoplanar‐imaging device (Trio; Siemens, Erlangen, Germany) using a quadrature head coil. Subjects lay on a padded scanner couch in a dimly illuminated room and wore foam earplugs. Foam padding stabilized the head. Two high‐resolution (1.0 × 1.0 × 1.3 mm) structural images were obtained with a magnetization‐prepared rapid acquisition with gradient echoes (MP‐RAGE) sequence [128 slices; 256 × 256 matrix; echo time (TE) = 3.34 ms; repetition time (TR) = 2,000 ms; flip = 7°]. MR images of brain activity were then collected. Functional sessions began with an initial sagittal localizer scan, followed by autoshimming to maximize field homogeneity. Slices were automatically positioned using an online 3D localizer [van der Kouwe et al., 2005]. To register functional data to the high‐resolution T1, a set of high‐resolution (40 slices; AC‐PC; 1.5 × 1.5 mm in‐plane no skip) inversion time T1‐weighted echo‐planar images (TE = 39 ms; TI = 1,200 ms; TR = 9,840 ms) was acquired. The coregistered functional series (TR = 3,000 ms; 40 AC‐PC slices; 3 mm thick; 3.125 mm × 3.125 mm in plane resolution; 128 images per slice; TE = 30 ms; flip angle = 90°; matrix = 64 × 64) lasted 384 s.
The stimuli were the same as those used in our previous studies [Hadjikhani and de Gelder, 2002; Hadjikhani et al., 2004] and consisted of 64 different gray‐scale pictures of faces and their own Fourier scrambled version in an AB‐blocked presentation, with 24‐s epochs for each stimulus type. Each stimulus had a red fixation cross in the center, corresponding to the eyes level, and was contained within a circle 480 pixels in diameter to control for retinotopic differences. Each stimulus was presented for 1,800 ms followed by a blank interval of 200 ms. As in our initial study, participants passively watched the stimuli. They were instructed to fixate the red cross at the center of each visual stimulus throughout the period of scan acquisition in order to maximize their attention to the eye region of the face.
Data Analysis
Anatomical data
The two MP‐RAGE scans were motion‐corrected and averaged to create a single image volume with high contrast‐to‐noise. Brain surfaces were reconstructed and inflated as described previously [Dale et al., 1999; Fischl et al., 1999a]. Cortical thickness measurements were obtained by reconstructing the gray/white matter boundary [Dale and Sereno, 1993; Dale et al., 1999; Fischl et al., 1999a] and the cortical surface. The distance between these two surfaces was calculated individually at each point across the cortical mantle (representing a total of ∼ 147,000 vertices in each individual). Because the two groups were not strictly matched on number and sex, we did not perform between‐group analyses of cortical thickness.
Functional data
The techniques used in our analysis were similar to those described in Hadjikhani et al. [ 2004]. Each functional run was first motion‐corrected with AFNI [Cox, 1996] and spatially smoothed using a three‐dimensional Gaussian filter with full width at half maximum of 6 mm. The mean offset and linear drift were estimated and removed from each voxel. The spectrum of the remaining signal was computed using a fast Fourier transform at each voxel. The task‐related component was estimated as the spectral component at the task fundamental frequency. The noise was estimated by summing the remaining spectral components after removing the task harmonics and those components immediately adjacent to the fundamental. The phase at the fundamental was used to determine whether the BOLD signal was increasing in response to the first stimulus (positive phase) or the second stimulus (negative phase).
Signal drift occurred during the scanning in two ASD subjects (subjects 6 and 10). This did not affect the computation of the phase at the fundamental and the subsequent group map modeling. However, data for these two subjects could not be included in the time course and correlation analyses.
Each participant's fMRI scan was registered to a high‐resolution T1. The results of the individual per‐voxel analysis were resampled onto a tessellated cortical representation of each hemisphere, which was aligned with a template sphere. The techniques for mapping between an individual volume and this spherical space are detailed by Fischl et al. [ 1999b]. The T1 volume was also registered to the MNI305 Talairach brain and the results of the individual analysis were resampled into this volume‐based space. Group average significance maps for the cortical surface and for the volume were computed using GLM analyses to perform random‐effect averages of the real and imaginary components of the signal across subjects on a per‐vertex and per‐voxel basis. Cross‐subject variance was computed as the variance pooled across the real and imaginary components. Significance of the average activation was determined using an F‐statistic and mapped from the standard sphere to a target individual's cortical surface [Fischl et al., 1999b]. Maps were visualized on this individual's surface geometry, overlaying a group curvature pattern averaged in spherically morphed space [Fischl et al., 1999b].
ROI analyses
Regions of interest (ROIs) were defined by anatomical and functional constraints. The anatomical constraints were specified by labels corresponding to the areas produced by automatic cortical parcellation [Fischl et al., 2004]. For the functional constraints, we used FFA and ROI labels independently defined in previous studies [Hadjikhani et al., 2004]. For the other ROIs, located in the right S1, PM, IFC, and STS, voxels with a functional significance level of P ≤ 0.05 in the normal control (NC) spherical‐space group average were selected. ROIs created on a standard brain were mapped back to each individual subject using spherical morphing to find homologous regions across subjects, and time courses were extracted. For each group, an unpaired two‐tailed t‐test was computed between BOLD signal levels at each time point during face and scrambled face presentation. For the comparison between groups, average level of activation was computed for each subject, and unpaired t‐test with Welch's correction was used to take into account the variance of the data.
Correlation analyses
Spearman rank correlation coefficients were computed to examine associations between ADOS social score and cortical thickness in the ROIs, between ADOS social score and level of activation in the ROIs, and between the ROIs in each group.
RESULTS
We first analyzed patterns of activation across conditions within each group and then compared results between the two groups. All nine individuals with ASD showed bilateral activation of FFA in response to faces. Unweighted random‐effect group analyses showed clear activation in the IOG and the FFA, consistent with our previous results (Fig. 1).
Figure 1.

Ventral view of a 3D reconstruction of a brain. A shows the location of the IOG (orange), the FG (red), and the ITG (blue). B and C show activation for faces in a random‐effect average for ASD subjects in the present study (B) and in our previous study (C). FG: Fusiform Gyrus; ITG: Inferior Temporal Gyrus.
Two‐tailed unpaired t‐tests between BOLD response levels in the FFA and the IOG showed significant bilateral activation for faces versus scrambled faces in both groups. Although the activation to faces was somewhat stronger in the control group, the difference was not statistically significant (Fig. 3A).
Figure 3.
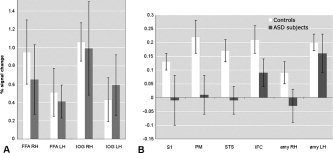
BOLD signal change in areas of the face‐processing network in subjects with ASD and healthy controls. A shows activation in the FFA and IOG, and B in the S1, PM, STS, IRF, and amygdala. Note the difference in scale between panels. FFA and IOG are significantly activated in both groups (P < 0.0001). There is no significant difference between ASD and NC in FFA (rh: t = 1.5, df = 11, P = 0.16; lh: t = 0.9, df = 10, P = 0.41) or in IOG (rh: t = 0.4, df = 8, P = 0.72; lh: t = 0.4, df = 10, P = 0.74). There is a significant activation for faces in the NC group in right S1 (t = 3.5, df = 782, P < 0.001), right PM (t = 6.9, df = 782, P < 0.0001), right STS (t = 3.8, df = 782, P < 0.001), right IFC (t = 6.2, df = 782, P < 0.0001), right amygdala (t = 2.1, df = 782, P < 0.05), and left amygdala (t = 5.4, df = 782, P < 0.0001). In the ASD group, significant activation is only found in IFC (t = 3.1; df = 782; P < 0.01) and in the left amygdala (t = 3.1; df = 782; P < 0.01). A one‐tailed Mann‐Whitney test between groups showed close to significant difference between groups in S1 (P = 0.082) and significant difference in PM (P = 0.036), STS (P = 0.009), IFC (P = 0.036), and right amygdala (P = 0.049).
Beyond the FFA and the IOG, consistent with previous imaging studies of healthy subjects, differential activation for faces was found in the right hemisphere of the NC group but not in the ASD random‐average group in the STS, S1, PM, IFC, and the amygdala (Fig. 2). Direct between‐group comparisons of each ROI confirmed these findings. In both ASD and NC, little activation was present in the left hemisphere, except for the left amygdala, which was activated equally in both groups. The right lateralization of the activations is consistent with prior evidence of right hemisphere dominance for facial processing [Blonder et al., 1991; Adolphs et al., 2000; Leslie et al., 2004].
Figure 2.
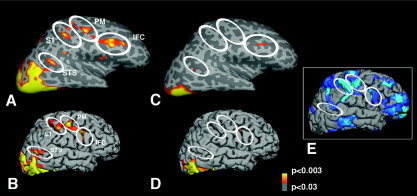
Location of random‐effect average activation for faces in the right hemisphere in normal controls (A and B) and in ASD (C and D). In A and C, the hemispheres have been inflated in order to show the sulci (darker shade of gray) and the gyri (lighter shade of gray). In the right hemisphere of the NC group, activation can be seen in the lateral superior and inferior occipital cortex. In addition, activation is seen in the STS, as well as in S1 and PM, at the level of face representation, and in IFC. These areas were weakly or not activated in the left hemisphere in NC group, and in either hemisphere in the ASD group. The areas of “missing” (S1, PM) or diminished (IFC, STS) activation in the ASD group correspond to areas where we previously described a thinning of the cortex in another group of subjects, shown in E [Hadjikhani et al., 2006].
Moreover, areas that were activated in NC in response to faces overlapped with areas of cortical thinning in ASD reported in a previous study of an independent sample of ASD subjects (Fig. 2E) [Hadjikhani et al., 2006].
Replicating our previous correlational findings in another group of ASD participants, social symptom severity in the ASD group was inversely related with cortical thickness of the right IFC (r = −0.85; P = 0.02; Fig. 4), the left IOG (r = −0.79; P = 0.05), and the right IOG (r = 0.96; P = 0.003). Cortical thickness in these ROIs was neither correlated with age (P > 0.3) nor with IQ (P > 0.3). In addition, ADOS social score was correlated with functional activation in the right IFC (r = 0.82; P = 0.03).
Figure 4.
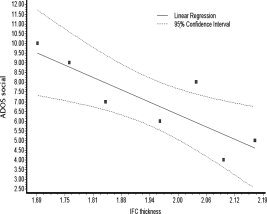
Correlation between the severity of the social symptoms as measured by the ADOS and the cortical thickness in the IFC (r2 = 0.72; P = 0.02).
The IFC is a region of the MNS that may play an important role in emotion understanding and empathy. We hypothesized that the level of activity in the MNS might modulate the activity of other face‐processing areas. Using correlational analyses, we examined the contribution of the MNS areas, the IFC and the STS, to activity in the other regions of the face‐processing system (Table II). In the ASD group, there was a significant relationship between activation in the IFC and other parts of the face‐processing network. The signal change in the IFC positively correlated with the signal change bilaterally in the FFA and the right PM (FFA rh, r = 0.86, P = 0.02; FFA lh, r = 0.96, P = 0.003; PM, r = 0.82, P = 0.03). Correlations between the IFC and the other parts of the face‐processing network were not found in the NC group. In the STS, activation was also positively correlated with other face‐processing areas (FFA rh, r = 0.82, P = 0.03; FFA lh, r = 0.82, P = 0.003; PM, r = 0.82, P = 0.03) as well as with the amygdala (amygdala rh, r = 0.89, P = 0.012; amygdala lh, r = 0.95, P = 0.003) in the ASD subjects. In the NC group, the STS was only correlated with the left FFA (r = 0.86; P = 0.024) and the left IOG (r = 0.89; P = 0.01).
Table II.
Correlation matrix of activation in the different ROIs of the face‐processing network in ASD and NC
| R AMY | L AMY | R FFA | L FFA | R IOG | L IOG | R S1 | R PM | R IFC | R STS | |
|---|---|---|---|---|---|---|---|---|---|---|
| R AMY | 0.95; P = 0.003 | NS | NS | NS | NS | NS | NS | NS | 0.89; P = 0.012 | |
| L AMY | NS | 0.88; P = 0.012 | 0.85P = 0.024 | NS | NS | NS | 0.81; P = 0.034 | NS | 0.95; P = 0.003 | |
| R FFA | NS | NS | 0.93P = 0.007 | NS | 0.79; P = 0.048 | NS | 0.93; P = 0.007 | 0.86; P = 0.024 | 0.82; P = 0.034 | |
| L FFA | 0.79; P = 0.048 | NS | NS | NS | 0.93; P = 0.007 | NS | 0.93; P = 0.007 | 0.96; P = 0.003 | 0.82; P = 0.034 | |
| R IOG | NS | NS | 0.89; P = 0.012 | NS | NS | NS | NS | NS | NS | |
| L IOG | NS | NS | 0.86; P = 0.024 | 0.93; P = 0.007 | NS | NS | 0.79; P = 0.048 | 0.96; P = 0.003 | NS | |
| R S1 | NS | NS | NS | NS | NS | NS | NS | NS | NS | |
| R PM | NS | NS | NS | 0.82; P = 0.034 | NS | NS | NS | 0.82; P = 0.034 | 0.82; P = 0.034 | |
| R IFC | NS | NS | NS | NS | NS | NS | NS | NS | NS | |
| R STS | NS | NS | NS | 0.86; P = 0.024 | NS | 0.89; P = 0.012 | NS | NS | NS |
ASD, top triangle, roman letters; NC, bottom triangle, italic letters; AMY, amygdala.
Spearman r, two‐tailed P value. False discovery rate (FDR) was used to correct for multiple comparisons, at P ≤ 0.048, FDR = 17% and at P ≤ 0.007, FDR = 7%.
DISCUSSION
Similarities Between ASD and NC
In this study, using the same stimuli as in our previous investigation of an independent group of ASD subjects and normal controls, we replicated our initial observation of significant FFA and IOG activation in ASD for faces. The FFA and IOG are involved in the analysis of the invariant aspect of faces necessary for identity perception [Haxby et al., 2000]. It is therefore not surprising that they are activated in individuals with ASD, who do not exhibit primary deficits in face identification and recognition. As reported previously [Hadjikhani et al., 2006], we found a correlation between IOG cortical thickness and symptom severity, but not with level of activation. The precise role of IOG in face perception needs to be further examined [Rossion et al., 2003; Rotshtein et al., 2005; Bouvier and Engel, 2006].
Differences Between ASD and NC
In the NC group, we observed additional differential activation in areas belonging to the face perception network, including areas of the MNS (IFC, STS) as well as the amygdala, S1, and PM [Haxby et al., 2000; de Gelder et al., 2003; Ishai et al., 2004; Johnson, 2005]. Although the face stimuli used in our study were not emotional faces, they elicited activation in areas normally associated with emotion perception. Most studies of face perception have compared emotional and neutral faces and have observed modulation of specific face‐processing areas by emotion. However, several studies comparing neutral faces with scrambled faces in humans and monkeys have reported, similar to our present findings, activation in the STS, IFC, PM, and amygdala [Kesler‐West et al., 2001; Ishai et al., 2004, 2005]. We can conclude from these findings that while emotional faces modulate the network that participates in face perception, the mere percept of a face is sufficient to engage areas of the network involved in processing social and emotional cues.
Influence of Amygdala on Face‐Processing Network
A correlation between amygdala activation and FFA has been described for emotion perception in healthy subjects [Morris et al., 1998; Iidaka et al., 2001] and in ASD subjects [Dalton et al., 2005]. The left amygdala has been associated with the processing of negative expression [Iidaka et al., 2001], whereas the right amygdala seems to be more involved with face processing in general, regardless of emotional valence [Iidaka et al., 2001; Golarai et al., 2004]. In the NC group, activation in the right amygdala was correlated with the left FFA. In the ASD group, activation in the left amygdala was correlated with the FFA bilaterally, as described previously [Dalton et al., 2005], as well as with the premotor cortex. In addition, in the ASD subjects, activation in the right and the left amygdala was correlated with activation in the right STS. The amygdala is important in directing fixation toward the eyes, as recently demonstrated in a patient suffering from early amygdala damage [Adolphs et al., 2005], and it is involved in processing information about the eye region of the face [Kawashima et al., 1999; Morris et al., 2002; Johnson, 2005]. In the monkey, the amygdala is directly connected with the homologoue of STS, area TEO [Aggleton et al., 1980]. The perception of direct gaze increases the correlation between amygdala activity and cortical face‐processing areas in healthy individuals [George et al., 2001], and a primary deficit in amygdala activation could at least partly explain gaze processing deficits in ASD subjects, as has already been suggested [Baron‐Cohen et al., 1999, 2000].
Face‐Processing, Mirror Neuron System, and Social Perceptual Network
The perception of faces involves areas of the social perceptual network, including the MNS, comprising the somatosensory, motor, and premotor cortices, IFC, STS, and the amygdala, suggesting that we see other people and understand their feelings through a mechanism of action representation. This is further illustrated by the large degree of overlap between the neural substrates of emotion perception and emotional experience [Adolphs et al., 1994] and the fact that lesions of the somatosensory cortex impair face emotion recognition [Adolphs et al., 2000]. Passive viewing of unseen (masked) emotional faces is sufficient to induce unconscious mimicry as measured by EMG in healthy controls [Dimberg et al., 2000]. Evidence from studies using neutral faces shows that viewing of faces automatically activates mirroring mechanisms including the IFC, PM, and STS, and that the presence of an emotional expression modulates this activation [Ishai et al., 2005].
The STS mediates the perception of gaze, a function that is known to be deficient in ASD. Our finding of hypoactivation of the STS in individuals with ASD is consistent with evidence of abnormal processing of eye gaze in autism [Baron‐Cohen et al., 1997; Leekam et al., 1998; Pelphrey et al., 2005]. The right STS is preferentially involved in processing of social information conveyed by shifts in eye gaze [Pelphrey et al., 2004b]. Deficits of activation of STS in ASD have been found in a variety of tasks involving attribution of intentions on the basis of shifts of gaze, body movements, or geometric figures movement [Baron‐Cohen et al., 1999; Castelli et al., 2002; Mosconi et al., 2005; Pelphrey et al., 2005]. Our finding of hypoactivation in the right STS of ASD is also consistent with findings of volumetric differences [Boddaert et al., 2004] of STS in children with ASD.
The MNS, by simulating the observed action or emotion, has been proposed as a key neural substrate for emotion understanding and empathy [Preston and de Waal, 2002; Gallese, 2003; Gallese et al., 2004; Leslie et al., 2004]. The IFC is the homologue of area F5 of the monkey, where the first mirror neurons were described [Rizzolatti et al., 2001]. Abnormal functioning of the MNS has been hypothesized to be at the basis of some of the social deficits in autism [Williams et al., 2001, 2005; Oberman et al., 2005], and our and other recent findings point to an anatomical and functional abnormality in the MNS of ASD subjects [Dapretto et al., 2006; Hadjikhani et al., 2006; Theoret et al., 2005]. Strong correlations were found between the IFC and the STS with other areas of the face‐processing network (amygdala, FFA, PM). Although these correlations are not informative with regard to direction of causation, they do support the possibility that face processing is modulated by the MNS, and that face‐processing deficits in ASD may result from MNS dysfunction. Interestingly, and in line with our present results, recent work by Dapretto et al. [ 2006] has demonstrated robust fusiform activation but significantly lower activity in the right IFC during passive observation of emotional faces in children with ASD. In addition, these authors report a correlation between social symptom severity and IFC activation during imitation of facial expression.
The finding that activation across different brain regions was not correlated in the NC groups is likely to reflect the restricted range of variance in levels of activation. In contrast, paralleling the differences in symptom severity within the ASD group, variable activation of the face‐processing network in ASD helped to reveal functional connections among brain regions.
Our findings may help to reconcile conflicting reports regarding activation in the face‐processing network of individuals with autism. In both of our studies, we examined high‐functioning individuals and found robust FFA activation. However, here we report that more subtle deficits can be observed in the social brain of these high‐functioning subjects, and that activity in the MNS may modulate face processing. Future research using magnetoencephalography to examine the timing of activations within these different areas may cast light on their individual contributions as well as provide potential causal information based on where the sequence of activation breaks down or diverges from normal.
Our findings show that while robust activation can be found in areas involved in face identification in ASD, hypoactivation is present in other areas of the network forming the broader face perception system. Areas of the social brain, crucial for emotional and communicative competence, including the STS, IFC, S1, and PM, as well as the amygdala, show evidence of anatomical [Hadjikhani et al., 2006] and functional abnormalities. These findings point toward a deficiency in the MNS and the somatic marker network [Damasio, 1999], which is likely to play an important role in processing information from people's faces. This hypothesis is further supported by the association that was found between symptom severity and cortical thinning of the IFC, implicating again the MNS in the social competence of individuals with ASD.
Acknowledgements
This research was supported by National Institutes of Health grants RO1 NS44824‐01 to Nouchine Hadjikhani, K01 MH073944‐01 (to R.M.J.), and U19 DC 03610 (to H.T.‐F.) and was part of the NICHD: The National Institute of Child Health and Human Development/NIDCD: The National Institute of Deafness and Other Communication Disorders‐funded Collaborative Programs of Excellence in Autism.
REFERENCES
- Adolphs R, Tranel D, Damasio H, Damasio A 1994: Impaired recognition of emotion in facial expressions following bilateral damage to the human amygdala. Nature 372: 669–672. [DOI] [PubMed] [Google Scholar]
- Adolphs R, Damasio H, Tranel D, Cooper G, Damasio AR 2000: A role for somatosensory cortices in the visual recognition of emotion as revealed by three‐dimensional lesion mapping. J Neurosci 20: 2683–2690. [DOI] [PMC free article] [PubMed] [Google Scholar]
- Adolphs R, Gosselin F, Buchanan TW, Tranel D, Schyns P, Damasio AR 2005: A mechanism for impaired fear recognition after amygdala damage. Nature 433: 68–72. [DOI] [PubMed] [Google Scholar]
- Aggleton JP, Burton MJ, Passingham RE 1980: Cortical and subcortical afferents to the amygdala of the rhesus monkey (Macaca mulatta). Brain Res 190: 347–368. [DOI] [PubMed] [Google Scholar]
- American Psychiatric Association 2000: Diagnostic and statistical manual of mental disorders, DSM‐IV‐TR. Washington, DC: American Psychiatric Association. [Google Scholar]
- Aylward E, Bernier R, Field A, Grimme A, Dawson G ( 2004): Autism during the view of familiar faces. Poster presented at the International Meeting for Autism Research, Sacramento, CA.
- Baron‐Cohen S, Wheelwright S, Jolliffe T 1997: Is there a “language of the eyes”? evidence from normal adults and adults with autism or Asperger syndrome. Visual Cogn 4: 311–331. [Google Scholar]
- Baron‐Cohen S, Ring HA, Wheelwright S, Bullmore ET, Brammer MJ, Simmons A, Williams SC 1999: Social intelligence in the normal and autistic brain: an fMRI study. Eur J Neurosci 11: 1891–1898. [DOI] [PubMed] [Google Scholar]
- Baron‐Cohen S, Ring HA, Bullmore ET, Wheelwright S, Ashwin C, Williams SC 2000: The amygdala theory of autism. Neurosci Biobehav Rev 24: 355–364. [DOI] [PubMed] [Google Scholar]
- Blonder LX, Bowers D, Heilman KM 1991: The role of the right hemisphere in emotional communication. Brain 114(Pt 3): 1115–1127. [DOI] [PubMed] [Google Scholar]
- Boddaert N, Chabane N, Gervais H, Good CD, Bourgeois M, Plumet MH, Barthelemy C, Mouren MC, Artiges E, Samson Y, et al. 2004: Superior temporal sulcus anatomical abnormalities in childhood autism: a voxel‐based morphometry MRI study. Neuroimage 23: 364–369. [DOI] [PubMed] [Google Scholar]
- Bouvier SE, Engel SA 2006: Behavioral deficits and cortical damage loci in cerebral achromatopsia. Cereb Cortex 16: 183–191. [DOI] [PubMed] [Google Scholar]
- Brothers L 1990: The neural basis of primate social communication. Motivat Emotion 14: 81–91. [Google Scholar]
- Castelli F, Frith C, Happe F, Frith U 2002: Autism, Asperger syndrome and brain mechanisms for the attribution of mental states to animated shapes. Brain 125(Pt 8): 1839–1849. [DOI] [PubMed] [Google Scholar]
- Cox RW 1996: AFNI: software for analysis and visualization of functional magnetic resonance neuroimages. Comp Biomed Res 29: 162–173. [DOI] [PubMed] [Google Scholar]
- Dale AM, Sereno MI 1993: Improved localization of cortical activity by combining EEG and MEG with MRI cortical surface reconstruction: a linear approach. J Cogn Neurosci 5: 162–176. [DOI] [PubMed] [Google Scholar]
- Dale AM, Fischl B, Sereno MI 1999: Cortical surface‐based analysis: I, segmentation and surface reconstruction. Neuroimage 9: 179–194. [DOI] [PubMed] [Google Scholar]
- Dalton KM, Nacewicz BM, Johnstone T, Schaefer HS, Gernsbacher MA, Goldsmith HH, Alexander AL, Davidson RJ 2005: Gaze fixation and the neural circuitry of face processing in autism. Nat Neurosci 8: 519–526. [DOI] [PMC free article] [PubMed] [Google Scholar]
- Damasio AR 1999: The feeling of what happens. New York: Harcourt Brace. [Google Scholar]
- Dapretto M, Davies MS, Pfeifer JH, Scott AA, Sigman M, Bookheimer SY, Iacoboni M 2006: Understanding emotions in others: mirror neuron dysfunction in children with autism spectrum disorders. Nat Neurosci 9(1): 28–30. [DOI] [PMC free article] [PubMed] [Google Scholar]
- de Gelder B, Frissen I, Barton J, Hadjikhani N 2003: A modulatory role for facial expressions in prosopagnosia. Proc Natl Acad Sci U S A 100(22): 13105–13110. [DOI] [PMC free article] [PubMed] [Google Scholar]
- Dimberg U, Thunberg M, Elmehed K 2000: Unconscious facial reactions to emotional facial expressions. Psychol Sci 11: 86–89. [DOI] [PubMed] [Google Scholar]
- Fischl B, Sereno MI, Dale AM 1999a: Cortical surface‐based analysis II: Inflation, flattening, and a surface‐based coordinate system. Neuroimage 9: 195–207. [DOI] [PubMed] [Google Scholar]
- Fischl B, Sereno MI, Tootell RBH, Dale AM 1999b: High‐resolution intersubject averaging and a coordinate system for the cortical surface. Hum Brain Mapp 8: 272–284. [DOI] [PMC free article] [PubMed] [Google Scholar]
- Fischl B, Van Der Kouwe A, Destrieux C, Halgren E, Segonne F, Salat DH, Busa E, Seidman LJ, Goldstein J, Kennedy D, et al. 2004: Automatically parcellating the human cerebral cortex. Cereb Cortex 14: 11–22. [DOI] [PubMed] [Google Scholar]
- Fombonne E 2003: Epidemiological surveys of autism and other pervasive developmental disorders: an update. J Autism Dev Disord 33: 365–382. [DOI] [PubMed] [Google Scholar]
- Gallese V 2003: The roots of empathy: the shared manifold hypothesis and the neural basis of intersubjectivity. Psychopathology 36: 171–180. [DOI] [PubMed] [Google Scholar]
- Gallese V, Keysers C, Rizzolatti G 2004: A unifying view of the basis of social cognition. Trends Cogn Sci 8: 396–403. [DOI] [PubMed] [Google Scholar]
- George N, Driver J, Dolan RJ 2001: Seen gaze‐direction modulates fusiform activity and its coupling with other brain areas during face processing. Neuroimage 13(6 Pt 1): 1102–1112. [DOI] [PubMed] [Google Scholar]
- Golarai G, Ghahremani DG, Eberhardt JL, Grill‐Spector K, Gabrieli GDE 2004: Representation of parts and canonical face configuration in the amygdala, superior temporal sulcus (STS) and the fusiform “face area” (FFA). J Vision 4: 131A. [Google Scholar]
- Hadjikhani N, de Gelder B 2002: Neural basis of prosopagnosia: an fMRI study. Hum Brain Mapp 16: 176–182. [DOI] [PMC free article] [PubMed] [Google Scholar]
- Hadjikhani N, Joseph RM, Snyder J, Chabris CF, Clark J, Steele S, McGrath L, Vangel M, Aharon I, Feczko E, et al. 2004: Activation of the fusiform gyrus when individuals with autism spectrum disorder view faces. Neuroimage 22: 1141–1150. [DOI] [PubMed] [Google Scholar]
- Hadjikhani N, Joseph RM, Snyder J, Tager‐Flusberg H 2006: Anatomical differences in the mirror neuron system and social cognition network in autism. Cereb Cortex 16(9): 1276–1282. [DOI] [PubMed] [Google Scholar]
- Haxby JV, Hoffman EA, Gobbini MI 2000: The distributed human neural system for face perception. Trends Cogn Sci 4: 223–233. [DOI] [PubMed] [Google Scholar]
- Haxby JV, Hoffman EA, Gobbini MI 2002: Human neural systems for face recognition and social communication. Biol Psychiatry 51: 59–67. [DOI] [PubMed] [Google Scholar]
- Iidaka T, Omori M, Murata T, Kosaka H, Yonekura Y, Okada T, Sadato N 2001: Neural interaction of the amygdala with the prefrontal and temporal cortices in the processing of facial expressions as revealed by fMRI. J Cogn Neurosci 13: 1035–1047. [DOI] [PubMed] [Google Scholar]
- Ishai A, Pessoa L, Bikle PC, Ungerleider LG 2004: Repetition suppression of faces is modulated by emotion. Proc Natl Acad Sci USA 101: 9827–9832. [DOI] [PMC free article] [PubMed] [Google Scholar]
- Ishai A, Schmidt CF, Boesiger P 2005: Face perception is mediated by a distributed cortical network. Brain Res Bull 67: 87–93. [DOI] [PubMed] [Google Scholar]
- Johnson M 2005: Subcortical face processing. Nat Neurosci Reviews 6: 2–9. [DOI] [PubMed] [Google Scholar]
- Kawashima R, Sugiura M, Kato T, Nakamura A, Hatano K, Ito K, Fukuda H, Kojima S, Nakamura K 1999: The human amygdala plays an important role in gaze monitoring: a PET study. Brain 122(Pt 4): 779–783. [DOI] [PubMed] [Google Scholar]
- Kesler‐West ML, Andersen AH, Smith CD, Avison MJ, Davis CE, Kryscio RJ, Blonder LX 2001: Neural substrates of facial emotion processing using fMRI. Brain Res Cogn Brain Res 11: 213–226. [DOI] [PubMed] [Google Scholar]
- Klin A, Jones W, Schultz R, Volkmar F, Cohen D 2002: Visual fixation patterns during viewing of naturalistic social situations as predictors of social competence in individuals with autism. Arch Gen Psychiatry 59: 809–816. [DOI] [PubMed] [Google Scholar]
- Leekam SR, Hunnisett E, Moore C 1998: Targets and cues: gaze‐following in children with autism. J Child Psychol Psychiatry 39: 951–962. [PubMed] [Google Scholar]
- Leslie KR, Johnson‐Frey SH, Grafton ST 2004: Functional imaging of face and hand imitation: towards a motor theory of empathy. Neuroimage 21: 601–607. [DOI] [PubMed] [Google Scholar]
- Lord C, Rutter M, Le Couteur A 1994: Autism diagnostic interview‐revised: a revised version of a diagnostic interview for caregivers of individuals with possible pervasive developmental disorders. J Autism Dev Disord 24: 659–685. [DOI] [PubMed] [Google Scholar]
- Lord C, Risi S, Lambrecht L, Cook EH Jr, Leventhal BL, DiLavore PC, Pickles A, Rutter M 2000: The autism diagnostic observation schedule‐generic: a standard measure of social and communication deficits associated with the spectrum of autism. J Autism Dev Disord 30: 205–223. [PubMed] [Google Scholar]
- Morris JS, Friston KJ, Buchel C, Frith CD, Young AW, Calder AJ, Dolan RJ 1998: A neuromodulatory role for the human amygdala in processing emotional facial expressions. Brain 121(Pt 1): 47–57. [DOI] [PubMed] [Google Scholar]
- Morris JS, deBonis M, Dolan RJ 2002: Human amygdala responses to fearful eyes. Neuroimage 17: 214–222. [DOI] [PubMed] [Google Scholar]
- Mosconi MW, Mack PB, McCarthy G, Pelphrey KA 2005: Taking an “intentional stance” on eye‐gaze shifts: a functional neuroimaging study of social perception in children. Neuroimage 27: 247–252. [DOI] [PubMed] [Google Scholar]
- Nakamura K, Kawashima R, Ito K, Sugiura M, Kato T, Nakamura A, Hatano K, Nagumo S, Kubota K, Fukuda H, et al. 1999: Activation of the right inferior frontal cortex during assessment of facial emotion. J Neurophysiol 82: 1610–1614. [DOI] [PubMed] [Google Scholar]
- Oberman LM, Hubbard EM, McCleery JP, Altschuler EL, Ramachandran VS, Pineda JA 2005: EEG evidence for mirror neuron dysfunction in autism spectrum disorders. Brain Res Cogn Brain Res 24: 190–198. [DOI] [PubMed] [Google Scholar]
- Pelphrey KA, Sasson NJ, Reznick JS, Paul G, Goldman BD, Piven J 2002: Visual scanning of faces in autism. J Autism Dev Disord 32: 249–261. [DOI] [PubMed] [Google Scholar]
- Pelphrey K, Adolphs R, Morris JP 2004a: Neuroanatomical substrates of social cognition dysfunction in autism. Ment Retard Dev Disabil Res Rev 10: 259–271. [DOI] [PubMed] [Google Scholar]
- Pelphrey KA, Viola RJ, McCarthy G 2004b: When strangers pass: processing of mutual and averted social gaze in the superior temporal sulcus. Psychol Sci 15: 598–603. [DOI] [PubMed] [Google Scholar]
- Pelphrey KA, Morris JP, McCarthy G 2005: Neural basis of eye gaze processing deficits in autism. Brain 128(Pt 5): 1038–1048. [DOI] [PubMed] [Google Scholar]
- Pierce K, Muller RA, Ambrose J, Allen G, Courchesne E 2001: Face processing occurs outside the fusiform “face area” in autism: evidence from functional MRI. Brain 124(Pt 10): 2059–2073. [DOI] [PubMed] [Google Scholar]
- Pierce K, Haist F, Sedaghat F, Courchesne E 2004: The brain response to personally familiar faces in autism: findings of fusiform activity and beyond. Brain 127: 2703–2716. [DOI] [PubMed] [Google Scholar]
- Preston SD, de Waal FB 2002: Empathy: Its ultimate and proximate bases. Behav Brain Sci 25: 1–20. [DOI] [PubMed] [Google Scholar]
- Rizzolatti G, Fogassi L, Gallese V 2001: Neurophysiological mechanisms underlying the understanding and imitation of action. Nat Rev Neurosci 2: 661–670. [DOI] [PubMed] [Google Scholar]
- Rossion B, Schiltz C, Crommelinck M 2003: The functionally defined right occipital and fusiform “face areas” discriminate novel from visually familiar faces. Neuroimage 19: 877–883. [DOI] [PubMed] [Google Scholar]
- Rotshtein P, Henson RN, Treves A, Driver J, Dolan RJ 2005: Morphing Marilyn into Maggie dissociates physical and identity face representations in the brain. Nat Neurosci 8: 107–113. [DOI] [PubMed] [Google Scholar]
- Schultz RT, Gauthier I, Klin A, Fulbright RK, Anderson AW, Volkmar F, Skudlarski P, Lacadie C, Cohen DJ, Gore JC 2000: Abnormal ventral temporal cortical activity during face discrimination among individuals with autism and Asperger syndrome. Arch Gen Psychiatry 57: 331–340. [DOI] [PubMed] [Google Scholar]
- Theoret H, Halligan E, Kobayashi M, Fregni F, Tager‐Flusberg H, Pascual‐Leone A 2005: Impaired motor facilitation during action observation in individuals with autism spectrum disorder. Curr Biol 15: R84–R85. [DOI] [PubMed] [Google Scholar]
- van der Geest JN, Kemner C, Camfferman G, Verbaten MN, van Engeland H 2002: Looking at images with human figures: comparison between autistic and normal children. J Autism Dev Disord 32: 69–75. [DOI] [PubMed] [Google Scholar]
- van der Kouwe AJ, Benner T, Fischl B, Schmitt F, Salat DH, Harder M, Sorensen AG, Dale AM 2005: On‐line automatic slice positioning for brain MR imaging. Neuroimage 27: 222–230. [DOI] [PubMed] [Google Scholar]
- WASI 1999: Wechsler abbreviated scale of intelligence. San Antonio, TX: Psychological Corporation. [Google Scholar]
- Williams JH, Whiten A, Suddendorf T, Perrett DI 2001: Imitation, mirror neurons and autism. Neurosci Biobehav Rev 25: 287–295. [DOI] [PubMed] [Google Scholar]
- Williams JH, Waiter GD, Gilchrist A, Perrett DI, Murray AD, Whiten A 2005: Neural mechanisms of imitation and “mirror neuron” functioning in autistic spectrum disorder. Neuropsychologia. [DOI] [PubMed] [Google Scholar]