

Abstract
Overt speech production in functional magnetic resonance imaging (fMRI) studies is often associated with imaging artifacts, attributable to both movement and susceptibility. Various image‐processing methods have been proposed to remove these artifacts from the data but none of these methods has been shown to work with continuous overt speech, at least over periods greater than 3 s. In this study natural, continuous, overt sentence production was evaluated in normal volunteers using both arterial spin labeling (ASL) and conventional echoplanar blood oxygenation level‐dependent (BOLD) imaging sequences on the same 1.5‐T scanner. We found a high congruency between activation results obtained with ASL and the de facto gold standard in overt language production imaging, positron emission tomography (PET). No task‐related artifacts were found in the ASL study. However, the BOLD data showed artifacts that appeared as large bilateral false‐positive temporopolar activations; percent signal change estimated in these regions showed signal increases and temporal dynamics that were incongruent with typical BOLD activations. These artifacts were not distributed uniformly, but were aligned at the frontotemporal base, close to the oropharynx. The calculated head movement parameters for overt speech blocks were within the range of the rest blocks, indicating that head movement is unlikely the reason for the artifact. We conclude that ASL is not influenced by overt speech artifacts, whereas BOLD showed significant susceptibility artifacts, especially in the opercular and insular regions, where activation would be expected. ASL may prove to be the method of choice for fMRI investigations of continuous overt speech. Hum. Brain Mapping 24:173–183, 2005. Published 2004 Wiley‐Liss, Inc.
Keywords: magnetic resonance imaging, brain function, speech, artifacts, human brain mapping, motion artifact, spin tagging
INTRODUCTION
Neuroimaging methods like functional magnetic resonance imaging (fMRI) and positron emission tomography (PET) have made it possible to study language in the living human brain. Most fMRI studies have explored language comprehension, generally focusing on responses to single words, to evaluate phonologic or semantic processing, although more recent studies have evaluated processing of sentences [Sakai et al., 2001].
Studies of language production using blood oxygenation level‐dependent (BOLD) fMRI have historically employed covert speech paradigms to circumvent associated problems: overt speech is imaged easily using PET [Braun et al., 1997; Petersen et al., 1988], but it may cause problems in BOLD studies because of two distinct artifacts associated with movement and susceptibility. It has been proposed that task‐related movement causes false positive results [Friston et al., 1996; Hajnal et al., 1994] because movement creates steep signal changes in brain areas close to tissue boundaries such as brain and skull. These signal changes are correlated with the overt speech task and can so mimic task‐related BOLD activation in the data analysis.
Studies on the effect of head motion on BOLD signal during overt speech show little absolute motion [Palmer et al., 2001] and have lead to the hypothesis that susceptibility‐related changes in the magnetic field homogeneity are the cause of the observed artifact [Birn et al., 1998, 1999].
There are several reasons why studying overt speech is important. First, overt speech is not equivalent to silent performance plus activation of motor cortices. Other regions, such as thalamus and basal ganglia, are engaged differently during covert and overt speech production [Rosen et al., 2000]. Second, observing and recording subjects' responses in studies of language production is important, because performance measures (production rate and error rate) represent significant covariates of interest. This is especially true in patient studies (e.g., aphasia or oral apraxia) where errors are expected. Moreover, Barch et al. [1999] emphasizes the need to check task compliance and performance even in normal volunteers.
Recently, event‐related studies using overt production of single words have provided an apparent solution to the artifact problem: assuming that brief single motions affect only volumes acquired before the hemodynamic response function (HRF) peak, initial volumes can be discarded without losing true activation signal [Birn et al., 1999].
These methods are most effective for brief motion associated with single word utterances. Because connected speech means continuous generation of artifact, methods that use event‐related paradigms to correct these artifacts should not work in this instance. It is nevertheless critically important to study continuous overt speech: As in comprehension studies, single‐word paradigms are limited to the evaluation of phonology and semantics. Continuous speech is necessary to expand existing paradigms to investigate syntactic construction and discourse production.
PET studies show different patterns for language production at the sentence and narrative level. A recent study demonstrated bilateral recruitment of extrasylvian areas not associated classically to the left hemispheric language areas [Braun et al., 2001] during discourse production. If technical limitations could be overcome, using fMRI instead of PET would have many well known advantages, such as longitudinal repeatability and superior spatial and temporal resolution.
Perfusion‐based arterial spin labeling (ASL) sequences represent an alternative to BOLD imaging. ASL subtracts brain scans with tagged and nontagged arterial inflow, producing cerebral bloodflow images. As a modification of the flow‐sensitive alternating inversion‐recovery (FAIR) spin tagging technique [Kim, 1995], we developed a background suppressed sequence, designated as ASSIST (attenuating the static signal in arterial spin tagging), which has been used to obtain functional maps in a cognitive [Ye et al., 2000] and a motor task [St. Lawrence et al., 2003].
Its use in a continuous overt speech paradigm would avoid both motion‐ and susceptibility‐artifacts associated with BOLD. The background suppression removes signal from static water protons; therefore, slight head motion can no longer cause sizable false signal change. Furthermore, the ASSIST sequence does not rely on the T2* effect. The short TE spin‐echo sequences that are used are unaffected by susceptibility artifacts.
In this study, we directly compared conventional BOLD and ASL methods, using both to assess a natural, continuous overt speech task. We hypothesized that ASL can be used to identify localized cerebral activation in such a paradigm, and that the results would be superior to those obtained with BOLD, in which the signal would be obscured by either motion or susceptibility artifact.
SUBJECTS AND METHODS
Subjects
Six male subjects participated in the BOLD scans (mean age, 33 ± 12 years). Four were rescanned in the ASSIST study on a later date, two new subjects were recruited due to unavailability. Subjects were right handed, native English speakers, with no neurologic diseases. Consent was obtained before participation; the study was conducted in accordance with the Declaration of Helsinki and after approval by the NIH review board.
Stimuli and Design
The total duration of the BOLD scans was 80 min; the time required to complete the ASSIST scans was 90–100 min. Scanning both study parts on the same day would have necessitated very long scan sessions, in which subjects would be expected to exhibit fatigue as well as loss of concentration and compliance. For this reason, BOLD and ASSIST scans were collected in separate sessions on different days. The same experimental design was used for BOLD and ASSIST, differing only in the total number of volumes acquired. We used a block design with three blocks (rest, syllable generation, and sentence construction). For sentence construction, a single verb was presented aurally at the beginning; different mono‐ or bisyllabic verbs were used for all blocks. Subjects were instructed to overtly generate series of sentences using this verb without constraints upon sentence length, complexity, or speed, to achieve natural, continuous overt speech.
The task for the syllable‐generation block was continuous overt production of the alternating consonants and vowels “pa‐ta‐ka.” Subjects were asked to keep their eyes open and stop articulation during the rest block. Blocks were 1 min long; 15 different blocks per run resulted in a scan duration of 15 min per run. The block order was sorted randomly across runs and subjects, preserving a ratio of one‐third each: rest, syllable generation, and sentence construction. Due to differences in time required to acquire one data volume in BOLD and ASSIST, two runs were scanned for BOLD and three for ASSIST. Subjects were introduced to the task and practiced it before the scans.
Data Acquisition
Data were acquired on a 1.5‐T whole‐body scanner (GE Signa; General Electric, Milwaukee, WI). Subjects lay supine with their heads were secured with a Velcro strap.
The ASSIST sequence is a modified FAIR sequence with added background suppression. The technical parameters and scan implementation are described in detail elsewhere [St. Lawrence et al., 2003; Ye et al., 2000]. We acquired 30 perfusion images per run (15 min each), with 3 runs per subject. The scan orientation was parallel to the Sylvian fissure. We scanned 12 oblique slices (voxel size in mm was 5 × 3.75 × 3.75). The volume included basally anterior temporal and orbitofrontal cortices and apically the motor hand area. Not included were cerebellum, temporobasal gyri, dorsal anterior cingulate, and supplementary motor area (SMA). In addition to the functional scans, we acquired anatomic images with standard clinical sequences. For the BOLD study, we acquired 21 whole‐brain axial slices (thickness 5 mm, gap 1 mm) with an echo‐planar sequence (TR 2,000 ms, TE 45 ms, 64 × 64, field of view [FOV] 220 mm, flip angle 90 degrees). Each run comprised 450 volumes, 15 min per run, and 2 runs per subject. Anatomic images were obtained as in the ASSIST part. An ASSIST perfusion volume took 30 s to scan, whereas a BOLD volume took only 2 s. Differences in the number of runs and acquired scans in our study thus reflected a compromise between overall scan duration and sample size.
Data Processing
Because of expected different signal characteristics (ASL vs. echoplanar imaging [EPI], different signal‐to‐noise ratio [SNR], different number of acquired scans), we chose to process each method individually to gain optimal statistical significance. Currently, there is no fMRI software analysis package available for the joined analysis of BOLD and ASL data. Instead of analyzing both datasets using a single program and attempting to compare the results directly in a random‐effects analysis, we chose to analyze each set individually using an established procedure, optimized for each method, and compared the results using standardized Z‐scores.
The ASSIST data processing was done using own scripts implemented in Interactive Data Language (IDL; RSI, Boulder, CO) and is described in detail elsewhere [St. Lawrence et al., 2003; Ye et al., 1999, 2000].
We defined three functional contrasts: (1) syllable generation versus rest; (2) sentence construction versus rest; and (3) sentence construction versus syllable generation. Activation results for the fixed‐effect group analysis were reported at corrected Z‐scores with a significance threshold of 0.01. Activation in anatomic areas that were not included in all six subjects were not reported. Multislice visualization was done using MRIcro software [Rorden and Brett, 2000].
BOLD Data Processing
The BOLD data analysis was carried out using statistical parametric mapping (SPM99; Wellcome Dept., London, UK), implemented in MATLAB (MathWorks, Sherborn, MA). We applied slice‐timing correction, motion correction by realignment, normalization in Talairach space using the Montreal Neurological Institute (MNI) template, and smoothing with an isotropic Gaussian filter of 8 mm.
The same functional contrasts (1–3) as for the ASSIST analysis were used here: syllable generation versus rest, sentence construction versus rest and sentence construction versus syllable generation. Results were reported with a threshold of P < 0.01 corrected.
Furthermore, we used AFNI [Cox, 1996] to calculate absolute task‐related % signal changes for all subjects in different regions including areas of suspected artifact. A typical signal time course was extracted for one subject in a region of artifact and in a region of real activation, to visualize the different temporal characteristics.
RESULTS
Head Movement
The movement analysis of the BOLD data based on the SPM movement correction parameters showed very little absolute head movement, with minimal differences between rest and overt speech. The maximal movement for translation was under 0.3 mm; the maximal rotation was under 0.5 degrees.
Activation Results: ASSIST
The analysis of the ASSIST perfusion data demonstrated significant hemodynamic responses for all three contrasts. Overt syllable generation versus rest elicited bilateral activation of Rolandic cortices, primary auditory cortices (Heschl's gyrus) and superior temporal gyri (STG) (Fig. 1; Table I). No activation was detected in anterior or posterior perisylvian language areas.
Figure 1.

ASSIST data analysis. A: Activation clusters for the contrast syllable‐generation vs. rest, normalized group results (n = 6), projected on a MNI‐normalized T1 structural MRI. The statistical threshold was set at a z‐score of 3; scores are indicated in the accompanying color bar. Bilateral activation is detected in the Rolandic cortices, Heschl's gyri, and superior temporal gyri. B: Activation for the contrast sentence‐construction vs. rest shows all areas seen in A and additionally left IFG, anterior insula (left > right), left premotor BA 44/6, left thalamus, and left supramarginal gyrus (BA 40).
Table I.
Significant activations for pairwise contrasts in the ASSIST study
| Region | BA | Syllable‐generation vs. rest | Sentence construction vs. rest | Sentence construction vs. syllable‐generation | |||||||||
|---|---|---|---|---|---|---|---|---|---|---|---|---|---|
| Z‐score | x | y | z | Z‐score | x | y | z | Z‐score | x | y | z | ||
| Insula | |||||||||||||
| R anterior | — | — | — | — | — | 4.79 | 42 | 14 | 10 | 3.99 | 38 | 18 | −2 |
| L anterior | — | — | — | — | — | 8.2 | −40 | 14 | 10 | 8.92 | −50 | 16 | 8 |
| Prefrontal cortex | |||||||||||||
| R dorsal operculum | 44/6 | — | — | — | — | — | — | — | — | — | — | — | — |
| L dorsal operculum | 44/6 | — | — | — | — | 5.82 | −46 | 6 | 30 | 7.72 | −46 | 0 | 44 |
| R ventral operculum | 45 | — | — | — | — | — | — | — | — | — | — | — | — |
| L ventral operculum | 45 | — | — | — | — | 5.78 | −48 | 28 | −4 | 7.01 | −48 | 34 | 4 |
| Frontal motor cortex | |||||||||||||
| R Rolandic cortex | — | 22.27 | 50 | −12 | 46 | 21.77 | 50 | −14 | 46 | — | — | — | — |
| L Rolandic cortex | — | 23.96 | −48 | −18 | 44 | 24.28 | −48 | −18 | 46 | — | — | — | — |
| Temporal lobe | |||||||||||||
| R PAC | 41 | 6.41 | 40 | −30 | 18 | 5.28 | 38 | −30 | 16 | — | — | — | — |
| L PAC | 41 | 9.58 | −38 | −30 | 18 | 8.08 | −38 | −30 | 16 | — | — | — | — |
| R STG | 22 | 10.16 | 66 | −14 | 8 | 8.91 | 52 | −34 | 6 | — | — | — | — |
| L STG | 22 | 8.65 | −64 | −26 | 8 | 6.7 | −62 | −38 | 14 | — | — | — | — |
| Parietal lobe | |||||||||||||
| R SMG | 40 | — | — | — | — | — | — | — | — | — | — | — | — |
| L SMG | 40 | — | — | — | — | 4.95 | −58 | −48 | 22 | 4.76 | −62 | −52 | 22 |
| Thalamus | |||||||||||||
| R VLN | — | — | — | — | — | — | — | — | — | — | — | — | — |
| L VLN | — | — | — | — | — | 4.43 | −14 | −16 | 10 | 4.61 | −6 | −18 | 6 |
Significant activations (Z > 3) for pairwise contrasts in the ASSIST study (n = 6). Z‐scores represent local maxima and are tabulated along with associated MNI coordinates. BA, Brodmann area; L, left hemisphere; R, right hemisphere; PAC, primary auditory cortex; STG, superior temporal gyrus; SMG, supramarginal gyrus; VLN, ventrolateral nucleus.
Sentence construction versus rest showed similar activation of Rolandic and superior temporal cortices as well as left‐hemispheric activation of the anterior insula, inferior frontal gyrus (IFG) and premotor cortex (BA 44/6) (Fig. 1A,B; Table I).
In addition, weaker activation in the left supramarginal gyrus (BA 40), the right anterior insula, and the left ventrolateral thalamus was seen with Z‐scores below five (Table I). Because of the limited ASSIST brain coverage, temporal regions including and below the medial temporal gyri (MTG) were not included. Similarly, cerebellum, anterior medial frontal, dorsolateral prefrontal cortex, and the pre‐SMA were also not covered.
The third contrast, sentence construction versus syllable generation, showed strong left‐hemispheric lateralization with activation in the anterior insula and IFG, left premotor cortex, and also weaker the left ventrolateral thalamus, left supramarginal gyrus and right anterior insula (Fig. 2A).
Figure 2.

Results of the contrast sentence‐construction vs. syllable‐generation using both ASL and BOLD methods. A: Activation results for the ASSIST sequence show activation of left IFG, premotor cortex, thalamus, and supramarginal gyrus, and of the anterior insula in both hemispheres. B: Results for the BOLD study show activation in portions of the temporopolar/frontobasal cluster seen in Figure 3, including contiguous regions, i.e., left ventral frontal operculum and anterior insula (left > right). Activations are also seen in the middle temporal gyrus bilaterally and in pre‐SMA. In each case, significance levels are indicated in the accompanying color tables. Left hemisphere on the left side.
Activation Results: BOLD
Syllable generation versus rest showed large areas of apparent activation in both anterior temporal lobes, extending dorsally from the poles, including gray and white matter structures, and partially covering the insular cisterns. In the left hemisphere, this contiguous activation cluster reached the left insular cortex and the IFG. Activation clusters were also found bilaterally in the frontal white matter, larger and with higher Z‐scores in the left hemisphere. A midline activation cluster presented in the pre‐SMA and almost symmetrical activation was seen in the medial cerebellar hemispheres. We also found left‐lateralized activation clusters in the STG and the left premotor cortex (BA 44/6).
Sentence construction versus rest showed a very similar distribution of results. In addition to these, bilateral temporal activation clusters were located in the superior temporal sulcus (STS) and MTG, a previous white matter cluster was not reproduced here, and the bilateral temporopolar, pre‐SMA, and cerebellar clusters were larger (Fig. 3; Table II).
Figure 3.

BOLD data analysis. A: Activation clusters for the contrast syllable‐generation vs. rest, fixed effects cohort results corrected P < 0.01; t‐scores are indicated in the accompanying color bar. Large apparent activation clusters can be seen in the temporopolar area, extending into the operculum and insula (left > right), bilateral cerebellum, frontal white matter. B: Activation for the contrast sentence‐construction vs. rest; activation essentially the same as that in A. Left hemisphere on the left side.
Table II.
Local maxima for the BOLD study
| Region | BA | Syllable generation vs. rest | Sentence construction vs. rest | Sentence construction vs. syllable generation | ||||||||||||
|---|---|---|---|---|---|---|---|---|---|---|---|---|---|---|---|---|
| t | Z | x | y | z | t | Z | x | y | z | t | Z | x | y | z | ||
| TP/FB cluster | ||||||||||||||||
| R | 13.5 | (Inf) | 54 | 9 | −21 | 15.49 | (Inf) | 51 | 12 | −27 | 5.56 | 5.53 | 33 | 24 | −24 | |
| L | 9.98 | (Inf) | −51 | 6 | −21 | 14.65 | (Inf) | −57 | −6 | −24 | 13.08 | (Inf) | −48 | 21 | −18 | |
| Insula | ||||||||||||||||
| R anterior | — | — | — | — | — | — | — | — | — | — | 8.75 | (Inf) | 36 | 15 | −3 | |
| L anterior | 6.67 | 6.61 | −39 | 6 | −9 | 10.37 | (Inf) | −36 | 15 | −6 | 8.21 | (Inf) | −36 | 15 | −3 | |
| Prefrontal cortex | ||||||||||||||||
| R ventral operculum | 47 | — | — | — | — | — | — | — | — | — | — | — | — | — | — | — |
| L ventral operculum | 47 | 11.98 | (Inf) | −39 | 33 | −12 | 16.82 | (Inf) | −48 | 27 | −12 | 11.38 | (Inf) | −48 | 21 | −12 |
| R frontal white matter | 8.12 | (Inf) | 33 | 39 | −3 | — | — | — | — | — | — | — | — | — | — | |
| L frontal white matter | 9.07 | (Inf) | −21 | 48 | −9 | 8.06 | (Inf) | −21 | 39 | 0 | — | — | — | — | — | |
| Frontal motor cortex | ||||||||||||||||
| R Rolandic cortex | 4 | — | — | — | — | — | — | — | — | — | — | — | — | — | — | — |
| L Rolandic cortex | 4 | 11.89 | (Inf) | −54 | −3 | −12 | 11.85 | (Inf) | −51 | 0 | 12 | — | — | — | — | — |
| R pre‐SMA | 6 | 6.25 | 6.22 | 6 | 3 | 66 | — | — | — | — | — | — | — | — | — | — |
| L pre‐SMA | 6 | — | — | — | — | — | 11.57 | (Inf) | −3 | 6 | 66 | 20.21 | (Inf) | −3 | 12 | 63 |
| Temporal lobe | ||||||||||||||||
| R STG | 41/22 | — | — | — | — | — | — | — | — | — | — | — | — | — | — | — |
| L STG | 41/22 | 7.82 | 7.75 | −42 | −42 | 12 | — | — | — | — | — | — | — | — | — | — |
| R STS/MTG | 21 | — | — | — | — | — | 9.34 | (Inf) | 45 | −33 | −6 | 10.46 | (Inf) | 54 | −39 | −3 |
| L STS/MTG | 21 | — | — | — | — | — | 7.21 | 7.16 | −45 | −36 | 3 | 13.97 | (Inf) | −54 | −39 | 0 |
| Cerebellum | ||||||||||||||||
| R cerebellar midline | 11.18 | (Inf) | 12 | −63 | −24 | 10.62 | (Inf) | 12 | −63 | −24 | 9.87 | (Inf) | 27 | −81 | −30 | |
| L cerebellar midline | 12.09 | (Inf) | −15 | −63 | −24 | 12.94 | (Inf) | −15 | −63 | −21 | 6.05 | 6.02 | −6 | −51 | −36 | |
Group results for six subjects, corrected P < 0.01; t‐ and Z‐scores represent local maxima and are tabulated along with associated MNI coordinates. BA, Brodmann area; L, left hemisphere; R, right hemisphere; TP/FB, temporopolar/frontobasal; STG, superior temporal gyrus; STS, superior temporal sulcus; MTG, medial temporal gyrus; Inf, infinite.
The direct contrast sentence‐construction minus syllable‐generation showed activation in very close proximity to the large temporopolar/frontobasal clusters seen previously: apparent activation was found in the left anterior insula, extending to the opercular IFG and the insular cistern, illustrated in a sagittal projection (Fig. 4A). Similarly, a smaller right insular activation reached the right insular cistern. Cerebellar activation showed a left midline and a right lateral distribution. Finally, strong activation was found in the pre‐SMA and the bilateral MTG (Fig. 2B).
Figure 4.
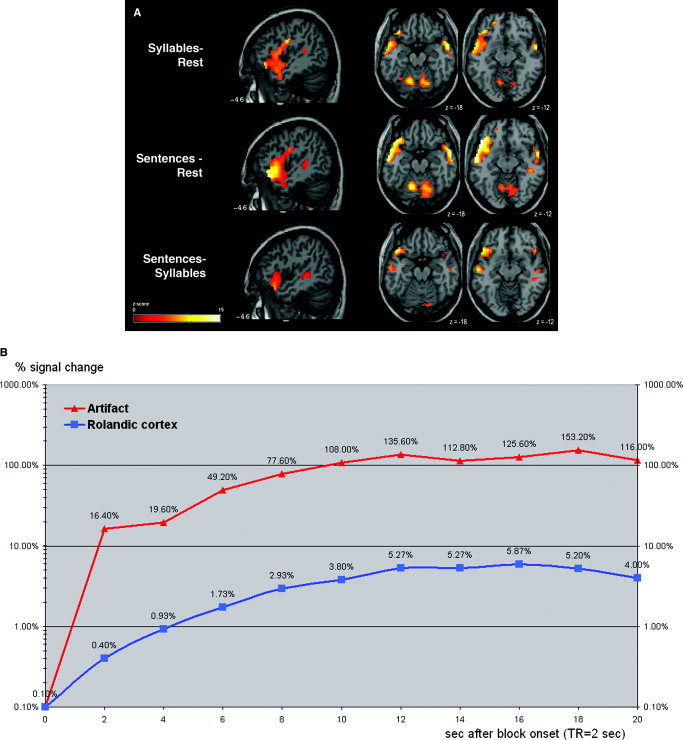
Spatial and temporal characteristics of the BOLD response in the temporopolar/frontobasal areas in the BOLD study. A: Anatomic localization of the large cluster from the cohort analysis of the BOLD data. The slice positions in MNI coordinates are indicated. Left hemisphere on the left side. B: Percent signal change extracted from a single subject's EPI time series at two coordinates, one within the temporopolar/frontobasal cluster, the other in the Rolandic cortex.
Percent Signal Changes: BOLD
We measured the percent signal increase of the BOLD data of five subjects, for each contrast in four different anatomic regions. Table III lists the individual results and the mean changes for the group. The average increase in the motor cortex was 1.6%, in the large temporopolar cluster, 21.1%, in the opercular IFG close to this large cluster, it was 4.95%. The average increase in the temporoparietal MTG/STG (BA 37/39) was 1.43% (Table III).
Table III.
Percent signal changes derived from BOLD time‐series data in five subjects
| Region/contrast | Subject no. | Mean % | ||||
|---|---|---|---|---|---|---|
| 1 | 2 | 3 | 4 | 5 | ||
| Rolandic cortex | ||||||
| Syll | 1.40 | 2.70 | 1.90 | 1.40 | 1.60 | 1.80 |
| Sent | 0.90 | 1.70 | 2.00 | 1.40 | 1.00 | 1.40 |
| Sent‐syll | −0.40 | −1.00 | 0.10 | 0.00 | −0.60 | −0.38 |
| Superior temporal gyrus | ||||||
| Syll | 0.30 | −2.40 | 0.70 | −0.10 | −0.50 | −0.40 |
| Sent | 2.10 | 2.80 | 1.40 | 2.50 | 1.50 | 2.06 |
| Sent‐syll | 2.00 | 5.20 | 0.70 | 2.60 | 2.00 | 2.50 |
| Temporopolar/frontobasal cluster | ||||||
| Syll | 10.30 | 52.80 | 3.70 | 10.80 | 24.90 | 20.50 |
| Sent | 13.60 | 36.40 | 6.80 | 22.90 | 29.10 | 21.76 |
| Sent‐syll | 3.30 | −16.30 | 3.10 | 12.10 | 4.20 | 1.28 |
| Ventral operculum | ||||||
| Syll | 4.50 | 4.20 | 1.90 | 5.90 | 6.70 | 4.64 |
| Sent | 4.90 | 5.50 | 2.40 | 6.20 | 7.30 | 5.26 |
| Sent‐syll | 0.40 | 1.30 | 0.50 | 0.30 | 0.60 | 0.62 |
Voxels representing individual local maxima in four different anatomic regions were sampled for each functional contrast. The last column shows the average percent change for each region (n = 5).
Syll, syllable‐generation vs. rest; Sent, sentence‐construction vs. rest; Sent‐syll, sentence‐construction vs. syllable‐generation.
To illustrate the different temporal characteristics of the signal changes in the temporopolar apparent activation and the Rolandic cortex, we extracted time series for two different voxels from one subject's BOLD data. Both voxels were local maxima identified with SPM: the “artifact” voxel lay in the left‐hemispheric large temporofrontal cluster and the “Rolandic” voxel was the local maximum in the left sensorimotor activation. Figure 4B shows a plot of the signal changes beginning with the onset of an overt speech block. The signal from the Rolandic cortex showed a relatively slow increase; the maximal signal increase did not exceed 10% and reached its peak relatively slowly after 12 s. The signal from the temporopolar/frontobasal cluster increased rapidly to 16.4% within the first 2 s and to almost 50% after 6 s.
DISCUSSION
We evaluated the effectiveness of two fMRI methods in a continuous overt speech task. We asked whether BOLD is a practical method for this purpose, or if its value may be limited by accompanying artifacts. We asked whether ASL might be an useful alternative, potentially superior to BOLD, for these paradigms. This is the first study to directly compare both methods in the same experiment using a language task that involves natural, continuous speech production.
Starting with a paradigm that has been studied before using PET [Braun, unpublished data], we had clear‐cut hypotheses about what we would see during both syllable‐ and sentence‐construction tasks.
The ASSIST results were similar to the PET data. The BOLD data, on the other hand, did not show the same activation patterns but included large areas, lying partially outside of the brain, with high signal changes and time courses typical for susceptibility artifact, which overlapped areas of expected activation. We suggest that these artifacts degrade the expected signal changes in the functionally relevant perisylvian cortex.
Arterial Spin Labeling
Results obtained with the ASSIST spin‐labeling sequence showed activations in the same cortical areas as that seen in PET results [Braun et al., 2001; Braun, unpublished observations] using a similar paradigm. Continuous overt generation of alternating syllables without a semantic and syntactic context activated the motor cortices, Heschl's gyri, and the STG (BA 22) bilaterally.
The production of sentences activated all of these areas but also the left premotor cortex, the left IFG (pars triangularis, BA 45), the left anterior insula, and, significantly weaker, the right anterior insula and left thalamus. These regions were significantly more active during sentence production when this was contrasted directly with syllable production. The increase in the complexity of the articulation (from “pa‐ta‐ka” toward full sentence articulation) could explain the left‐hemispheric activation in thalamus and premotor cortex, although most sentence‐related activations likely are due to the introduction of language. The opercular IFG and the anterior insula have been described previously as activated in language studies, which have demonstrated the involvement of these regions in phonologic, semantic, and syntactic processing [Binder and Price, 2001].
The expected activation in the posterior STG/MTG was not reproduced in our ASSIST dataset, because the slices did not include these and lower regions.
Both overt tasks versus rest showed a clear activation of Heschl's gyri and the surrounding STG bilaterally, an effect not always observed in auditory fMRI studies. We speculate that this is due to the very low overall acoustic noise level of the ASSIST sequence itself, rendering self‐perception of spoken language much clearer and unobstructed by scanner noise.
BOLD Imaging
The BOLD results showed some activations in expected areas: both sentence and syllable generation activated the primary motor cortex; sentence generation additionally showed activation of the posterior MTG/STG. However, the largest clusters of apparent activation for both sentences and syllables versus rest, were found in temporopolar areas bilaterally, beginning below the temporal poles and frequently projecting onto the skull base. Previous studies have not reported activation in these regions using similar paradigms.
A close examination of the percent signal changes in these clusters showed average increases of around 20%, tenfold higher than in primary motor cortex and MTG/STG, which were on the order of 1–3% (typical values for BOLD are ∼2–4%) [Hoge et al., 1999].
Another conspicuous feature of the signal changes in the temporopolar/frontobasal regions was the time course of the signal increase. The time series in these regions showed a rapid rise of the signal (Fig. 4B), more than a 15% increase within the first 2 s, which is inconsistent with the characteristics of the true hemodynamic response function.
We suggest that the “activation” found in the temporopolar/frontobasal regions is an artifact associated with continuous overt speech generation, rather than a true BOLD contrast activation. This could be due either to movement or susceptibility; however, we found very little head movement in the overt speech blocks compared to rest, not remarkably different from values found in studies without any speech production at all. This particular observation of low overall head movement was also reported in other studies [Huang et al., 2002; Palmer et al., 2001]. Additionally, the observed artifact was most pronounced in the inferior region of the brain, close to the pharyngeal air–tissue interfaces, where the largest magnetic field changes during overt speech have been observed [Birn et al., 1998].
We suggest that the cause of the artifact is the susceptibility effect, generated by inhomogeneities in the magnetic field due to continuous changes in airflow, as well as tongue and jaw movement during articulation. It is important to stress the difference between these changes, and the susceptibility artifacts typically found in EPI scans that do not involve overt speech. The latter, localized close to air–bone interfaces above the nasal sinuses and near the petrous bone close to the posterior temporal base, are always present and do not change during the scan; these static artifacts are not the reason for the speech‐associated false activation in the temporal poles. Instead, overt speech generates susceptibility changes in new areas, localized close to the pharynx, where movement of muscles and bones and changes in airflow induce rapid, dynamic magnetic inhomogeneities. These changes are strongly task correlated, so their effect on the data is primarily on the signal and to a lesser extent on the noise.
In single‐word studies, artifact and true BOLD signal can be separated based on their different temporal characteristics: in the former, signal changes are rapid and short, whereas the latter shows a delayed and prolonged response. This difference vanishes in continuous natural speech, where both signals are generated continuously and overlap to a degree that makes it impossible to separate them.
This artifact does not affect the EPI volume uniformly: We found expected BOLD activation with typical features distant from the pharynx, e.g., in the Rolandic cortex and in the posterior MTG/STG. Some regions with a critical role in speech and language production are perilously close to the area of artifact: the left Broca's area and the anterior insula should be activated during language production, consistent with our ASSIST results.
Are the observed BOLD activations in these regions corrupted by the nearby artifact, which may propagate into these contiguous areas? The percent signal changes extracted from the IFG suggest exactly that. Our BOLD data showed signal changes in the IFG on the order of 5% for both sentences and syllables versus rest, still two to three times greater than activation known to be real (in Rolandic, temporoparietal areas).
Moreover, there should be no significant activation in the opercular IFG for syllable generation, but a strong activation for sentence construction. The fact that the BOLD activations in both these conditions are similar in magnitude contradicts these expectations, suggesting that the artifact has propagated upward, corrupting the real, expected activation.
Could the artifact be subtracted off in a direct contrast of sentences minus syllables to show usable results? The calculated contrast found only an increase of 0.6% in the IFG in proximity to the artifact, but a 2.5% increase distant from it in the posterior temporal activation unaffected by the artifact. This suggests that the 0.6% signal increase in the IFG does not represent a real activation revealed after subtraction, but more likely represents a difference of the residual artifact. In the presence of artifact, real activation can not be detected reliably by subtraction.
Our initial hypothesis when we planned the study was that two possible artifacts would have to be taken into consideration for overt speech fMRI: susceptibility and motion. The ASSIST sequence was an ideal sequence because it uses background suppression to minimize the motion effect and it is a spin‐echo sequence with short TE, thus less prone to susceptibility artifacts. Our results suggested that head movement is in fact minimal, with the measures directly comparable to other fMRI studies without any speech production.
The BOLD results suggested significant artifacts even without head movement, and we conclude that susceptibility is the reason for these. Although the background suppression of ASSIST would minimize movement artifacts, these are not relevant. Because head movement is not a factor, it seems that the spin‐echo ASSIST with short TE is itself less affected by susceptibility, compared to the T2* gradient echo BOLD sequence. A recent study [Wang et al., 2004] confirms exactly this effect; they used a spin‐echo ASL sequence in a simple motor task and demonstrated the advantage of ASL due to lack of susceptibility artifacts.
A limitation of our study was the selection of ASSIST for the ASL scans. Because of technical restrictions (scan duration, number of slices, and number of volumes), the data had to be collected in separate sessions, and not all scan parameters could be matched. The chosen paradigms reflected a balance between feasibility (total scan duration) and being able to acquire a sufficient number of volumes for the statistical analysis.
More research needs to be carried out using faster ASL sequences, ideally including simultaneous acquisition of BOLD and ASL data. Possible sequences would be those described by Yang et al. [2002] or the QUIPSS II sequence [Luh et al., 2000].
CONCLUSIONS
When BOLD and ASSIST methods were compared using the same overt speech paradigm, obligatory artifacts were detected in the BOLD, but not in the ASSIST data. These artifacts appeared as large bilateral false‐positive temporopolar activations with characteristics incongruent with BOLD data. Areas distant from the artifact did show typical BOLD signal changes, but in critical instances, e.g., the IFG, we found that the signal was corrupted by the artifact and therefore not useable.
The ASSIST results reproduced activation identified in previous PET studies, but omitted certain areas due to limited spatial coverage. Newer spin‐labeling sequences may make it possible to image the full brain, so this limitation should likely disappear. Although signal changes are greater with BOLD, the Z‐scores indicate that variability is greater as well. ASSIST seems to detect task‐related activations with equal sensitivity. Although at present, image acquisition is faster using BOLD, development of ASL sequences with a fast TR (≤ 4 s) could eventually make event‐related designs using ASL possible. Another advantage of ASSIST is reduced acoustic noise in the scanner. This may enable effective stimulus presentation and recording of responses without additional hardware.
In summary, we conclude that BOLD imaging is impractical for language studies using continuous speech. ASSIST represents a better alternative, and future improvements promise to overcome present technical restrictions, making it the method of choice for such studies.
This article is a US Government work and, as such, is in the public domain in the United States of America.
REFERENCES
- Barch DM, Sabb FW, Carter CS, Braver TS, Noll DC, Cohen JD ( 1999): Overt verbal responding during fMRI scanning: empirical investigations of problems and potential solutions. Neuroimage 10: 642–657. [DOI] [PubMed] [Google Scholar]
- Binder J, Price CJ ( 2001): Functional neuroimaging of language In: Cabeza R, Kingstone A, editors. Handbook of functional neuroimaging of cognition. Cambridge, MA: MIT Press; p 187–251. [Google Scholar]
- Birn RM, Bandettini PA, Cox RW, Jesmanowicz A, Shaker R ( 1998): Magnetic field changes in the human brain due to swallowing or speaking. Magn Reson Med 40: 55–60. [DOI] [PubMed] [Google Scholar]
- Birn RM, Bandettini PA, Cox RW, Shaker R ( 1999): Event‐related fMRI of tasks involving brief motion. Hum Brain Mapp 7: 106–114. [DOI] [PMC free article] [PubMed] [Google Scholar]
- Braun AR, Guillemin A, Hosey L, Varga M ( 2001): The neural organization of discourse: an H2 15O‐PET study of narrative production in English and American sign language. Brain 124: 2028–2044. [DOI] [PubMed] [Google Scholar]
- Braun AR, Varga M, Stager S, Schulz G, Selbie S, Maisog JM, Carson RE, Ludlow CL ( 1997): Altered patterns of cerebral activity during speech and language production in developmental stuttering. An H2(15)O positron emission tomography study. Brain 120: 761–784. [DOI] [PubMed] [Google Scholar]
- Cox RW ( 1996): AFNI: Software for analysis and visualization of functional magnetic resonance neuroimages. Comput Biomed Res 29: 162–173. [DOI] [PubMed] [Google Scholar]
- Friston KJ, Williams S, Howard R, Frackowiak RS, Turner R ( 1996): Movement‐related effects in fMRI time‐series. Magn Reson Med 35: 346–355. [DOI] [PubMed] [Google Scholar]
- Hajnal JV, Myers R, Oatridge A, Schwieso JE, Young IR, Bydder GM ( 1994): Artifacts due to stimulus correlated motion in functional imaging of the brain. Magn Reson Med 31: 283–291. [DOI] [PubMed] [Google Scholar]
- Hoge RD, Atkinson J, Gill B, Crelier GR, Marrett S, Pike GB ( 1999): Linear coupling between cerebral blood flow and oxygen consumption in activated human cortex. Proc Natl Acad Sci USA 96: 9403–9408. [DOI] [PMC free article] [PubMed] [Google Scholar]
- Huang J, Carr TH, Cao Y ( 2002): Comparing cortical activations for silent and overt speech using event‐related fMRI. Hum Brain Mapp 15: 39–53. [DOI] [PMC free article] [PubMed] [Google Scholar]
- Kim SG ( 1995): Quantification of relative cerebral blood flow change by flow‐sensitive alternating inversion recovery (FAIR) technique: application to functional mapping. Magn Reson Med 34: 293–301. [DOI] [PubMed] [Google Scholar]
- Luh WM, Wong EC, Bandettini PA, Ward BD, Hyde JS ( 2000): Comparison of simultaneously measured perfusion and BOLD signal increases during brain activation with T(1)‐based tissue identification. Magn Reson Med 44: 137–143. [DOI] [PubMed] [Google Scholar]
- Palmer ED, Rosen HJ, Ojemann JG, Buckner RL, Kelley WM, Petersen SE ( 2001): An event‐related fMRI study of overt and covert word stem completion. Neuroimage 14: 182–193. [DOI] [PubMed] [Google Scholar]
- Petersen SE, Fox PT, Posner MI, Mintun M, Raichle ME ( 1988): Positron emission tomographic studies of the cortical anatomy of single‐word processing. Nature 331: 585–589. [DOI] [PubMed] [Google Scholar]
- Rorden C, Brett M ( 2000): Stereotaxic display of brain lesions. Behav Neurol 12: 191–200. [DOI] [PubMed] [Google Scholar]
- Rosen HJ, Ojemann JG, Ollinger JM, Petersen SE ( 2000): Comparison of brain activation during word retrieval done silently and aloud using fMRI. Brain Cogn 42: 201–217. [DOI] [PubMed] [Google Scholar]
- Sakai KL, Hashimoto R, Homae F ( 2001): Sentence processing in the cerebral cortex. Neurosci Res 39: 1–10. [DOI] [PubMed] [Google Scholar]
- Lawrence KS St, Ye FQ, Lewis BK, Frank JA, McLaughlin AC ( 2003): Measuring the effects of indomethacin on changes in cerebral oxidative metabolism and cerebral blood flow during sensorimotor activation. Magn Reson Med 50: 99–106. [DOI] [PubMed] [Google Scholar]
- Wang J, Li L, Roc AC, Alsop DC, Tang K, Butler NS, Schnall MD, Detre JA ( 2004): Reduced susceptibility effects in perfusion fMRI with single‐shot spin‐echo EPI acquisitions at 1.5 Tesla. Magn Reson Imaging 22: 1–7. [DOI] [PubMed] [Google Scholar]
- Yang Y, Gu H, Zhan W, Xu S, Silbersweig DA, Stern E ( 2002): Simultaneous perfusion and BOLD imaging using reverse spiral scanning at 3T: characterization of functional contrast and susceptibility artifacts. Magn Reson Med 48: 278–289. [DOI] [PubMed] [Google Scholar]
- Ye FQ, Frank JA, Weinberger DR, McLaughlin AC ( 2000): Noise reduction in 3D perfusion imaging by attenuating the static signal in arterial spin tagging (ASSIST). Magn Reson Med 44: 92–100. [DOI] [PubMed] [Google Scholar]
- Ye FQ, Yang Y, Duyn J, Mattay VS, Frank JA, Weinberger DR, McLaughlin AC ( 1999): Quantitation of regional cerebral blood flow increases during motor activation: a multislice, steady‐state, arterial spin tagging study. Magn Reson Med 42: 404–407. [DOI] [PubMed] [Google Scholar]