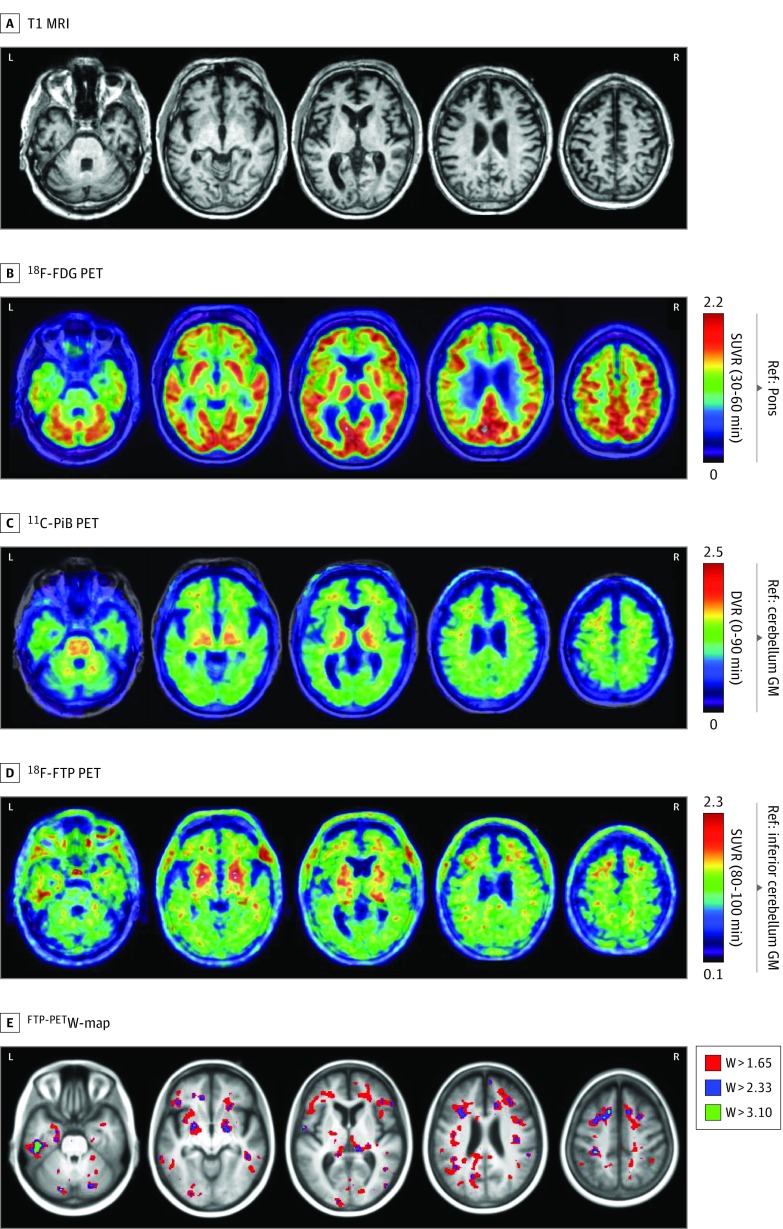
Figure 1. Neuroimaging in Pathologically Proven Chronic Traumatic Encephalopathy.
T1-weighted magnetic resonance (MRI) (top row) demonstrated mild medial temporal and frontal atrophy. Fluorine F 18–labeled (18F)–fludeoxyglucose (FDG) on positron emission tomography (PET) images (second row) demonstrated mild hypometabolism in the medial temporal, medial and dorsolateral frontal, and peri-insular regions, whereas carbon 11–labeled Pittsburgh compound B (PiB) PET scan (third row) was visually rated as negative for cortical retention. On 18F-flortaucipir PET imaging (fourth row), there was widespread patchy binding predominantly in the left greater than right frontotemporal areas. The 18F-flortaucipir PET W-map (bottom row) (thresholded at 3 different levels) showed that these focal increases were higher than what would be expected considering the patient’s age. DVR indicates distribution volume ratio; GM, gray matter; Ref, reference region; and SUVR, standardized uptake value ratio with acquisition windows in parentheses.

