

Abstract
Background
Neurofilament light chain is a marker of axonal damage and is of interest as a biofluid biomarker for PD. The objective of this study was to investigate whether CSF or serum neurofilament contributes to a combination of CSF biomarkers in defining the optimal biomarker panel for discriminating PD patients from healthy controls. In addition, we aimed to assess whether CSF and/or serum neurofilament levels are associated with clinical measures of disease severity.
Methods
We measured neurofilament light chain levels in CSF and/or serum of 139 PD patients and 52 age‐matched healthy controls. We used stepwise logistic regression analyses to test whether neurofilament contributes to a biomarker CSF panel including total, oligomeric, and phosphorylated α‐synuclein and Alzheimer's disease biomarkers. Measures of disease severity included disease duration, UPDRS‐III, Hoehn & Yahr stage, and MMSE.
Results
After correcting for age, CSF neurofilament levels were 42% higher in PD patients compared with controls (P < 0.01), whereas serum neurofilament levels were 37% higher (P = 0.08). Combining CSF neurofilament, phosphorylated‐/total α‐synuclein, and oligomeric‐/total α‐synuclein yielded the best‐fitting model for discriminating PD patients from controls (area under the curve 0.92). The discriminatory potential of serum neurofilament in the CSF biomarker panel was similar (area under the curve 0.90). Higher serum neurofilament was associated with a lower MMSE score. There were no other associations between CSF and/or serum neurofilament levels and clinical disease severity.
Conclusions
CSF neurofilament contributes to a panel of CSF α‐synuclein species in differentiating PD patients from healthy controls. Serum neurofilament may have added value to a biofluid biomarker panel for differentiating PD patients from controls. © 2019 The Authors. Movement Disorders published by Wiley Periodicals, Inc. on behalf of International Parkinson and Movement Disorder Society.
Keywords: CSF biomarkers, neurofilament light, Parkinson's disease, serum biomarkers
In the past decade, a multitude of biomarker candidates for diagnosis of Parkinson's disease (PD) have been brought forward and tested in various cohorts.1, 2, 3, 4, 5 In the search for CSF biomarkers to differentiate PD patients from controls, levels of single CSF biomarkers show considerable overlap between PD patients and controls.1, 2, 3, 4, 5 For instance, although CSF α‐synuclein (α‐syn) levels are reduced in PD patients compared with healthy controls, sensitivity and specificity are insufficient to discriminate between PD and controls in individual subjects.6 Because PD is a multifactorial disease, a panel of biomarkers reflecting the various pathological processes of PD may perform better in the discrimination between PD patients and controls.7 We have previously shown that differentiation between PD patients and controls can be improved by combining CSF α‐syn species with Alzheimer's disease (AD) CSF biomarkers.5, 8 Additional CSF or serum biomarkers reflecting other neuropathological processes in PD may further increase the discriminatory potential of this panel. One promising candidate is neurofilament light chain (NfL).
Neurofilament proteins are major components of the neuronal cytoskeleton and are particularly abundant in axons.9 Neurofilaments are composed of 4 subunits: light, medium, and heavy chains and α‐internexin.9 NfL is considered a marker of axonal damage in a variety of acute and chronic neurological diseases.10 Human postmortem brain studies have shown that axonal degeneration is a prominent feature in early‐stage PD and that NfL may be involved in Lewy body formation.11, 12, 13 Whether CSF NfL can contribute to a diagnostic panel of biomarkers for PD is yet to be determined.
Because blood collection is less invasive and blood has greater accessibility than CSF, it is of interest to investigate whether serum NfL can replace CSF NfL in differentiating PD patients from controls. Since the development of the serum NfL test on the ultrasensitive single molecule analysis (Simoa) technology,14 2 previous studies analyzed blood NfL in PD patients using Simoa.15, 16 Both studies found higher levels of blood NfL in patients with atypical parkinsonism (APD) compared with PD patients and controls with a high diagnostic accuracy (area under the curve [AUC] up to 0.91); however, comparison of serum NfL levels in PD patients with healthy controls showed conflicting results.15, 16 More biomarker studies in well‐characterized cohorts are needed to evaluate the potential diagnostic value of blood NfL in PD.
The aim of this study was therefore to investigate whether CSF or serum NfL contributes to a combination of CSF PD and AD biomarkers to discriminate PD patients from healthy control subjects. We included CSF and/or serum of a cross‐sectional cohort consisting of 139 PD patients and 52 age‐matched healthy controls.3 From this cohort the following CSF biomarkers were previously investigated: CSF total α‐syn (t‐α‐syn), oligomeric α‐syn (o‐α‐syn), phosphorylated α‐syn (p‐α‐syn), total tau (t‐tau), phosphorylated tau (p‐tau), and amyloid‐β42 (Aβ42).5, 8 We first tested whether CSF and/or serum NfL can differentiate PD patients from controls as single biomarkers. Next, we included CSF NfL to the panel of CSF biomarkers and determined the best‐fitting panel to discriminate PD patients from healthy controls. We tested whether serum NfL correlates with CSF NfL in our cohort and whether serum NfL can replace CSF NfL in discriminating PD patients from controls in the panel of biomarkers. Furthermore, we assessed the association between CSF and/or serum NfL and clinical measures of disease severity in PD.
Methods
The study population included a cross‐sectional cohort of 139 patients with PD recruited from the movement disorders outpatient clinic of the Amsterdam UMC, location VUmc, between 2008 and 2011 and 52 healthy controls (for details, see Van Dijk et al).3 Briefly, all PD patients fulfilled the United Kingdom Parkinson Disease Society Brain Bank clinical diagnostic criteria.17 PD diagnoses were not pathologically confirmed. The self‐declared healthy controls were recruited through an advertisement and were excluded if they had a history of neurological disorders or abnormal findings at general neurological examination. Dementia was excluded using the Cambridge Cognitive Examination scale.18 Disease duration was defined as the period starting from the first subjective motor symptoms until the time of CSF or blood sampling. Severity of parkinsonism and disease stage in the “on” state were rated using the Unified Parkinson Disease Rating Scale part III (UPDRS‐III)19 and the modified Hoehn and Yahr (HY) classification,20 respectively. From the 139 PD patients, 76 patients had early‐stage disease, that is, disease duration ≤5 years and HY stage <3. Global cognitive function was evaluated using the Mini‐Mental State Examination (MMSE). The study was approved by the local ethics committee of the VU University Medical Center, and written informed consent for use of clinical data and biomaterial for scientific research purposes was obtained from all participants.
Serum and Cerebrospinal Fluid Samples
CSF was obtained by lumbar puncture at the level of L3–L4 or L4–L5 and collected in polypropylene collection tubes. Cerebrospinal fluid (CSF) was routinely assayed for cell counts, centrifuged at 1800g at 4°C for 10 minutes, and aliquoted and stored at ‐80°C within 2 hours, in line with published guidelines.21 Serum was collected directly before or after lumbar puncture, centrifuged at 1800g at 4°C for 10 minutes, and aliquoted and stored at ‐80°C within 2 hours. Concentrations of CSF t‐tau, p‐tau, Aβ42, t‐α‐syn, o‐α‐syn, and p‐α‐syn in CSF were measured using enyzyme‐link immunosorbent assay (ELISA), as published elsewhere.3, 5
Biomarker Analyses
Serum NfL
Serum NfL concentrations were measured using an in‐house validated 2‐step automated Homebrew Simoa assay, as previously described.14, 22 In short, the 0.3 mg/mL monoclonal NF‐Light capture antibody (Anti NF‐L mAb 47:3; UmanDiagnostics, Umeå, Sweden) was coupled to paramagnetic carboxylated beads (Quanterix, Lexington, MA) that were activated with 0.3 mg/mL 1‐ethyl‐3‐[3‐dimethylaminopropyl]carbodiimide hydrochloride (Thermo Scientific, Rockford, IL). In step 1, 25 μL of 500K assay beads diluted in assay diluent (TBS with 1% milk, 0.1% Tween20; Dako, Santa Clara, CA) and 300 μg/mL of TRU block (Meridian Life Sciences, Memphis, TN) were incubated for 35 minutes and 15 seconds with 20 μL of 0.3 μg/mL biotinylated detector NF‐Light antibody (Anti NF‐L mAb 2:1;, UmanDiagnostics, Umeå, Sweden) and 100 μL of calibrator or 4 times on‐board diluted sample (sample diluent: TBS, 1% milk, 0.1% Tween, and 400 mg/mL TRU block). After washing, a 5‐minute, 15‐second incubation with 100 μL of 150 pM streptavidin‐conjugated β‐galactosidase (Quanterix, Lexington, MA) followed. After a next wash, 25 μL of Resorufin β‐D‐galactopyranoside (Quanterix, Lexington, MA) was added, and beads were pulled onto the imaging disc, followed by time‐lapsed fluorescent imaging. The calibration curve was constructed using purified bovine NF‐L (lyophilized; UmanDiagnostics, Umeå, Sweden) diluted in assay diluent. The assay had a lower limit of qunatitation of 1.54 pg/mL. The mean intra‐assay coefficients of variation (duplicate measurements) was 6.43% ± 5.0%.
CSF NfL
CSF NfL concentrations were measured using a commercial ELISA kit (NF‐light; UmanDiagnostics, Umeå, Sweden),23 according to manufacturer's instructions. Samples were analyzed in duplicates. The mean intra‐assay coefficient of variation was 2.21% ± 2.1%.
All biochemical analyses were performed by staff blinded to the clinical diagnoses.
Statistical Analysis
To compare sex and age between PD patients and controls, we used the chi‐square test and Student t test respectively. For comparisons of CSF and serum biomarker levels between groups, we used general linear models (analysis of covariance) and included age as a cofactor, because previous studies observed a significant correlation between CSF and blood NfL levels and age.15, 16, 24, 25, 26 We performed natural logarithmic (LN) transformation of all CSF and serum biomarker levels to obtain a normal distribution. To determine the optimal differentiating biomarker panel, we performed a binary logistic regression analysis. A panel of CSF NfL, classical AD biomarkers, that is, Aβ42, p‐tau, and CSF α‐syn species, that is, p‐α‐syn/t‐α‐syn ratio and o‐α‐syn/t‐α‐syn ratio, were tested to find the best‐fitting model in a forward stepwise logistic regression analysis. Owing to colinearity between CSF biomarkers, t‐tau and t‐α‐syn were not included in the model. We tested the correlation between LN CSF NfL and LN serum NfL with Pearson correlation. To analyze whether serum NfL can replace CSF NfL in discriminating PD patients from controls, we replaced the variable CSF NfL in serum NfL in the binary logistic regression model. Age did not affect the logistic regression model and was therefore not included. The diagnostic accuracy of the best‐fitting model of biomarkers was calculated based on the area under the curve (AUC) of the receiver operating characteristic curve. Cut‐off values were calculated using Youden's index, which maximizes the sum of sensitivity and specificity. To assess the associations between the NfL levels and clinical characteristics (disease duration, UPDRS‐III, HY, MMSE) multivariate regression models were used, adjusted for age. Statistical significance was set at P < 0.05. Statistical analysis was performed using Graph‐Pad Prism (version 7) and SPSS software (v. 22, SPSS Inc., Chicago, IL).
Results
Demographics and CSF Biomarker Levels
In the present study, CSF and serum biomarker levels of 139 PD patients and 52 controls were included. Demographic and clinical characteristics and CSF and serum biomarker levels of the diagnostic groups are presented in Table 1. PD patients and controls were matched for age, but not for sex. Median disease duration was 4 years, and the majority of patients (78%) had a Hoehn & Yahr stage below 3. Median UPDRS‐III score was 24, and median MMSE score was 28 (Table 1). As reported previously, CSF t‐α‐syn level was 19% lower in PD patients compared with age‐matched controls (P < 0.001), whereas p‐α‐syn and o‐α‐syn levels were increased in PD (18%, P = 0.01; and 113%, P < 0.001, respectively). Also, p‐α‐syn/t‐α‐syn and o‐α‐syn/t‐α‐syn ratios were increased in PD compared with controls (39%, P < 0.001; and 173%, P < 0.001, respectively; Table 1). No difference in CSF Aβ42, t‐tau, or p‐tau concentrations between PD patients and controls was found (P = 0.25, P = 0.54, and P = 0.54, respectively; Table 1).3, 5
Table 1.
Demographics and cerebrospinal fluid and serum values of Parkinson's disease patients and healthy controls
| Controls | Parkinson's disease patients | P | |||
|---|---|---|---|---|---|
| Variable | n | n | |||
| Number of men (%) | 52 | 19 (36.5%) | 139 | 89 (64%) | 0.001a |
| Age (years) | 52 | 63 ± 8.6; 35‐82 | 139 | 64 ± 9.7; 36‐86 | 0.29b |
| Disease duration (years) | 139 | 4 (2‐10) | NA | ||
| Hoehn and Yahr stage (number per stage 1/1.5/2/2.5/3/4/5) | 138 | 14 / 11 / 47 / 36 / 22 / 4 / 4 | NA | ||
| UPDRS III score | 138 | 24 (16‐33) | NA | ||
| MMSE score | 135 | 28 (27‐29) | NA | ||
| CSF total α‐synuclein (ng/mL) | 46 | 1.6 (1.4‐2.3) | 46 | 1.3 (1.2‐1.6) | < 0.001c |
| CSF p‐α‐synuclein (pg/mL) | 46 | 225 (185‐279) | 45 | 265 (208‐296) | 0.01c |
| CSF o‐α‐synuclein (pg/mL) | 46 | 56.5 (32.1‐98.9) | 44 | 120.1 (78.9‐169.9) | < 0.001c |
| CSF p‐α‐synuclein/t‐α‐synuclein (%) | 46 | 13.6 (9.1‐18.6) | 45 | 18.9 (15.7‐23.9) | < 0.001c |
| CSF o‐α‐synuclein/t‐α‐synuclein (%) | 46 | 3.3 (1.9‐5.5) | 44 | 9.0 (5.4‐12.7) | < 0.001c |
| CSF amyloid‐β42 (ng/L) | 49 | 994 (863‐1121) | 58 | 967 (794‐1077) | 0.25c |
| CSF total tau (ng/L) | 49 | 229 (163‐268) | 58 | 190 (158‐274) | 0.54c |
| CSF p‐tau (ng/L) | 49 | 41.0 (28.0‐48.0) | 58 | 39.5 (28.8‐51.3) | 0.54c |
| CSF NfL (pg/mL) | 45 | 612 (517‐848) | 41 | 866 (709‐1101) | 0.002c |
| serum NfL (pg/mL) | 47 | 13.7 (9.3‐19.7) | 138 | 18.7 (12.1‐30.8) | 0.08c |
CSF, cerebrospinal fluid; UPDRS‐III, Unified Parkinson's Disease Rating Scale part III; MMSE, Mini‐Mental State Examination; NfL, neurofilament light chain.
Data are mean ± SD and range or median and interquartile range unless specified otherwise.
Chi‐square test.
Student t test.
General linear model with age as cofactor.
CSF and Serum NfL Values in PD Patients and Controls
The median level of CSF NfL was 866 pg/mL in PD patients compared with 612 pg/mL in controls (42% higher in PD, P < 0.001; Table 1). Median serum NfL was 18.7 pg/mL in PD patients compared with 13.7 pg/mL in controls (increase of 37% in PD, P = 0.005; Table 1). We observed an overlap in NfL levels between PD patients and controls in both CSF (PD: range, 307–4948 pg/mL; controls: range, 235–6607 pg/mL) and serum (PD: range, “not detectable” to 107.1 pg/mL; controls: range, 0.8–45.3 pg/mL; Fig. 1).
Figure 1.
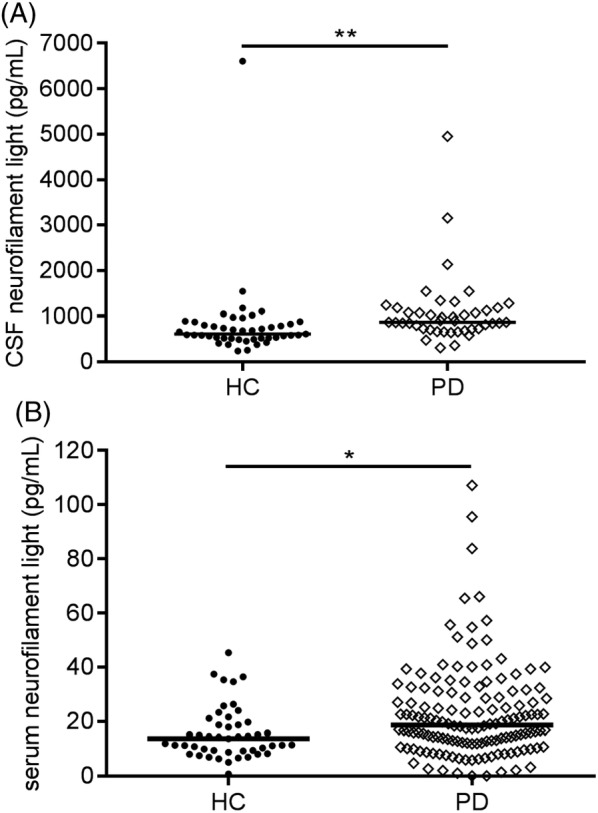
Scatter plots of neurofilament light chain concentrations of healthy controls (HC) and patients with Parkinson disease (PD). Neurofilament light chain concentrations in (A) cerebrospinal fluid (CSF) and (B) serum. Plot bars correspond to median concentrations. p values are from general linear models adjusting for age. * p = 0.08; ** p < 0.01
CSF NfL level correlated with age in both groups (PD: r = 0.43, P = 0.005; controls: r = 0.57, P < 0.001), as did serum NfL (PD: r = 0.49, P < 0.001; controls: r = 0.45, P = 0.002; Supplemental Fig. S1). After controlling for the effect of age, CSF NfL level was higher in PD patients compared with controls (P < 0.01). Serum NfL level showed a trend for discrimination between the groups (P = 0.08; Fig. 1). In both PD patients and controls, CSF NfL correlated with serum NfL level (PD: r = 0.43, P = 0.006; controls: r = 0.50, P = 0.001; Fig. 2).
Figure 2.
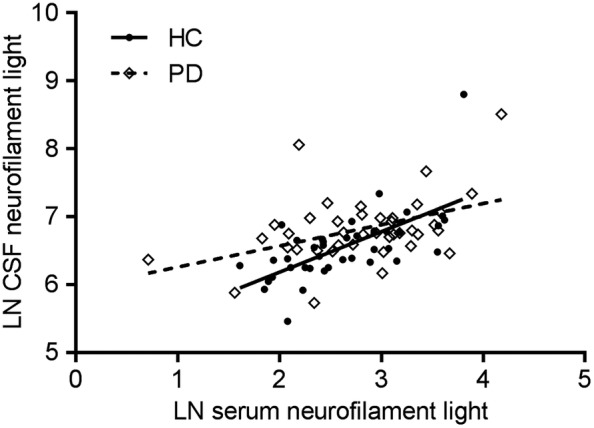
Scatter plot showing the correlations (Pearson) between paired cerebrospinal fluid and serum neurofilament light chain levels. Dashed line indicates a correlation in the healthy control group (r = 0.50, p = 0.001) and solid line indicates a correlation in the Parkinson disease group (r = 0.43, p = 0.006). Abbreviations: CSF, cerebrospinal fluid; HC, healthy controls; LN, natural log; PD, Parkinson disease
Additional Value of CSF and Serum NfL in a Panel of CSF Biomarkers
Binary logistic regression analysis of CSF NfL and serum NfL as single biomarkers revealed an AUC of 0.73 for CSF NfL, with a sensitivity and specificity of 68% and 71%, respectively, at a cut‐off value of 738 pg/mL, and an AUC of 0.64 for serum NfL, with a sensitivity and specificity of 61% and 68%, respectively, at a cut‐off value of 15.6 pg/mL (Table 2 and Supplemental Fig. S2).
Table 2.
Relations of CSF and serum neurofilament light‐chain levels with disease characteristics in Parkinson's disease patients
| Disease duration (years) | UPDRS‐III score | Hoehn and Yahr stage | MMSE score | |
|---|---|---|---|---|
| CSF NfL (pg/mL) | ‐0.007 | 0.076 | 0.040 | 0.009 |
| Serum NfL pg/mL) | 0.067 | 0.000 | 0.046 | ‐0.193a |
CSF, cerebrospinal fluid; NfL, neurofilament light chain; UPDRS‐III, Unified Parkinson Disease Rating Scale part III; MMSE, Mini‐Mental State Examination.
Data are β coefficients from linear regression models, adjusted for age.
P = 0.02.
In our previously published panel5 (consisting of CSF Aβ42, p‐tau, p‐α‐syn/t‐α‐syn ratio, and o‐α‐syn/t‐α‐syn ratio), the combination of p‐tau, p‐α‐syn/t‐α‐syn, and o‐α‐syn/t‐α‐syn yielded the best‐fitting model, with a sensitivity of 74% and a specificity of 85% (AUC, 0.89; Table 2 and Supplemental Fig. S2). Now adding CSF NfL to the model, the best differentiating panel was formed by the combination of CSF NfL, p‐α‐syn/t‐α‐syn ratio, and o‐α‐syn/t‐α‐syn ratio, and the discriminatory potential improved on visual inspection to a sensitivity of 85% and a specificity of 86% (AUC, 0.92; P < 0.001). The inclusion of serum instead of CSF NfL in the panel revealed a best differentiating panel consisting of serum NfL, p‐α‐syn/t‐α‐syn ratio, and o‐α‐syn/t‐α‐syn ratio, which yielded a sensitivity of 91% and a specificity of 81% (AUC, 0.90; P < 0.001; Table 2 and Supplementary Fig. S2). The combination of p‐α‐syn/t‐α‐syn and o‐α‐syn/t‐α‐syn without NfL revealed an AUC of 0.88 with a sensitivity of 84% and a specificity of 80% (Table 2 and Supplementary Fig. S2).
Association Between CSF and Serum NfL and Clinical Measures of Disease Severity in PD
Regression analysis adjusted for age showed an inverse association of serum NfL level with MMSE score (range, 7–30 points; sβ = ‐0.193; P = 0.02). In CSF, NfL level was not associated with MMSE score (sβ = 0.009, P = 0.95). We found no association of CSF or serum NfL level with disease duration, UPDRS‐III, and HY (Table 3).
Table 3.
Discriminatory value of neurofilament light in cerebrospinal fluid and serum as a single biomarker and as part of a panel of CSF biomarkers
| Predictor | AUC (95% CI) | Sensitivity | Specificity | P |
|---|---|---|---|---|
| CSF NfL | 0.73 (0.62–0.84) | 68% | 71% | < 0.001 |
| Serum NfL | 0.64 (0.55–0.73) | 61% | 68% | 0.005 |
| CSF p‐/t‐α‐syn and CSF o‐/t‐α‐syn | 0.88 (0.80–0.95) | 84% | 80% | < 0.001 |
| CSF p‐tau and CSF p‐/t‐α‐syn and CSF o‐/t‐α‐syn | 0.89 (0.82–0.95) | 74% | 85% | < 0.001 |
| CSF NfL and CSF p‐/t‐α‐syn and CSF o‐/t‐α‐syn | 0.92 (0.86–0.98) | 85% | 86% | < 0.001 |
| Serum NfL and CSF p‐/t‐α‐syn and CSF o‐/t‐α‐syn | 0.90 (0.83–0.97) | 91% | 81% | < 0.001 |
AUC, area under the curve; CSF, cerebrospinal fluid; NfL, neurofilament light chain; p‐tau, phosphorylated tau; p‐/t‐α‐syn, phosphorylated α‐synuclein/total α‐synuclein ratio; o‐/t‐α‐syn, oligomeric α‐synuclein/total α‐synuclein ratio.
Logistic regression analysis of CSF and serum neurofilament light chain and other CSF PD biomarkers between Parkinson's disease patients and healthy controls.
Discussion
In this study, we aimed to investigate whether CSF or serum NfL contributes to a combination of CSF PD and AD biomarkers in defining the optimal biomarker panel for discriminating PD patients from healthy controls. By adding CSF NfL to measurements of CSF Aβ42, p‐tau, p‐α‐syn/t‐α‐syn ratio, and o‐α‐syn/t‐α‐syn ratio, the best discriminating panel was formed by combining CSF NfL levels with CSF measurements of α‐syn species. The discriminatory potential of this panel reached a sensitivity of 85% and specificity of 86% (AUC 0.92). When using serum NfL instead of CSF NfL together with α‐syn species, a similar discriminative potential of 90% was obtained. Our results suggest that CSF and serum NfL levels in combination with CSF α‐synuclein species may serve as a biomarker panel for discrimination of PD patients compared with controls.
This study demonstrated that CSF NfL levels are 42% higher in PD patients compared with healthy controls. Because NfL is abundant in axons, increased NfL in CSF may indicate ongoing axonal damage.9 CSF NfL level is increased in a variety of acute and chronic neurological diseases, such as multiple sclerosis, traumatic brain injury, and amyotrophic lateral sclerosis, compared with controls.10, 27, 28, 29 In multiple sclerosis, a human postmortem study related axonal degeneration to neurofilament.30 Previous studies linking CSF NfL to diffusion tensor imaging (DTI) measures of white‐matter microstructure in patients with amyotrophic lateral sclerosis and in older individuals with mild cognitive impairment support the assumption that NfL level reflects axonal injury or loss.31, 32 In PD, human postmortem or DTI studies linking NfL to axonal degeneration are lacking; however, our findings of elevated NfL levels in PD may suggest that CSF NfL reflects the axonal pathology in PD.
We demonstrated a positive correlation between CSF NfL and serum NfL concentrations in both PD patients and controls, which may indicate that serum NfL could replace CSF NfL in the biomarker panel. This correlation was previously described in several other studies on NfL in a variety of neurological diseases14, 25, 28, 33, 34, 35 and suggests that CSF NfL and serum NfL reflect similar pathogenic mechanisms. Nonetheless, one should acknowledge the possibility that serum NfL might also reflect axonal injury in the peripheral nervous system, as suggested by findings from the study of Mariotto et al.36
In both PD patients and healthy controls, we found that CSF and serum NfL levels correlated strongly with age, which suggests that some degree of axonal degeneration is associated with aging or that CSF clearance decreases with aging.10, 29 After adjusting for age, CSF NfL level was significantly higher in PD patients, whereas serum NfL level showed a trend toward higher levels in PD. Results of prior studies comparing CSF NfL levels between PD patients and healthy controls have been inconsistent.16, 37, 38, 39 In 2 previous studies, CSF NfL levels were found increased in PD patients compared with healthy controls,38, 39 whereas multiple other studies did not find a difference.16, 37, 40, 41 Serum NfL was found to be increased in PD patients compared with controls in 1 cohort,16 whereas in 2 other PD cohorts no difference in serum NfL level was observed.15, 16 Potential explanations for lack of differences in the previous studies comparing CSF NfL levels between PD and controls include small sample size and thus a possiblly underpowered study40 and differences in the choice of the control group.41 Whereas in our study healthy controls were included (i.e., controls without a history of neurological disorders or abnormal findings in general neurological examination), inclusion of controls with subjective neurological symptoms in a previous study might have resulted in the observation of no difference in CSF NfL levels compared with PD patients.41 In addition, an increase in CSF NfL level with aging may explain the lack of a difference in CSF NfL levels between PD patients and controls in another study.37
Although we were able to demonstrate higher levels of CSF and serum NfL in PD patients, we observed a large overlap in the range of NfL concentrations between the groups. Thus, our findings confirm that single CSF or serum NfL measurements do not suffice to differentiate PD patients from controls. However, as we hypothesized, by using a panel of biomarkers including CSF NfL, we were able to raise the sensitivity in differentiating between PD patients and controls from 74% to 85% and the specificity from 85% to 86%. Our results of improved discriminatory potential using a biomarker panel confirm previous observations that the combination of CSF NfL with other CSF biomarkers could differentiate PD patients from healthy controls more accurately than the single CSF biomarkers.38
Our results suggest that a higher serum NfL level was associated with lower MMSE score, a clinical measure of global cognitive function in PD. The nonsignificant association of CSF NfL level with MMSE score was most likely because of a lack of power, as the group of included PD patients with CSF NfL was smaller (n = 41) than the group of PD patients with serum NfL (n = 138). We did not observe associations between CSF or serum NfL with UPDRS‐III, HY stage, or disease duration. These results suggest that an increase in NfL level may be more pronounced with abundant pathological changes with axonal degeneration in cortical brain areas, such as occurs in PD dementia.42, 43 The association of NfL with MMSE score is in concordance with previous studies on other dementia disorders including AD, frontotemporal dementia, and vascular dementia.26, 38, 39, 44, 45
A strength of this study is that we investigated the discriminatory potential of serum NfL using an ultrasensitive assay in a well‐characterized cohort of PD patients. By combining multiple fluid biomarkers reflecting different pathological mechanisms in PD, that is, α‐syn aggregation and axonal degeneration, high diagnostic accuracy was achieved. However, a limitation of the panel used is that other CSF biomarkers are still needed to increase sensitivity and specificity, thus still necessitating a lumbar puncture. A panel solely consisting of serum biomarkers would be ideal and could be within reach because several other serum biomarkers such as α‐syn species are currently being investigated.46, 47, 48, 49, 50 Another limitation is the lack of inclusion of patients with APD. As mentioned in the beginning of this article, CSF and serum NfL has been shown to discriminate PD from APD,15, 16 and it would be of clinical benefit to investigate whether the combination of CSF NfL and CSF α‐syn species could improve the accuracy in differentiating PD form APD compared with CSF NfL alone.
In conclusion, our results suggest that CSF NfL contributes to a biomarker panel of CSF α‐syn species in discriminating PD patients from healthy controls. Furthermore, we found a correlation of serum NfL with CSF NfL and with clinical measures of cognitive performance in PD patients. As such, serum NfL may be of interest to test in a blood biomarker panel for differentiating PD patients from controls.
Authors’ Roles
Linda Oosterveld: conception and execution of the research project, design and execution of the statistical analysis, writing of the first draft of the manuscript.
Inge Verberk: execution of the biochemical analyses, review and critique of the manuscript.
Nour Majbour: execution of the biochemical analyses, review and critique of the manuscript.
Omar El‐Agnaf: execution of the biochemical analyses, review and critique of the manuscript.
Henry Weinstein: review and critique of the manuscript.
Henk Berendse: review and critique of the manuscript.
Charlotte Teunissen: supervision of the biochemical analyses, review of the statistical analysis and the manuscript.
Wilma van de Berg: conception and design of the research project, design and review of the statistical analysis, review and editing of the manuscript.
Financial Disclosures of all authors (for the preceding 12 months, unrelated to the current research)
Linda Oosterveld reports no disclosures.
Inge Verberk received funding from Health~Holland for collaboration with Crossbeta Biosciences and received research consumables from Crossbeta Biosciences.
Nour Majbour reports no disclosures.
Omar El‐Agnaf reports no disclosures.
Henry Weinstein reports no disclosures.
Henk Berendse reports no disclosures.
Charlotte Teunissen received grants from the European Commission, the Dutch Research Council (ZonMW), Association of Frontotemporal Dementia/Alzheimer's Drug Discovery Foundation, Alzheimer Netherlands. Dr. Teunissen has functioned in advisory boards of Fujirebio and Roche, received non‐financial support in the form of research consumables from ADxNeurosciences and Euroimmun, performed contract research or received grants from Probiodrug, Janssen prevention center, Boehringer, Brainsonline, AxonNeurosciences, EIP farma, PeopleBio, Roche.
Wilma van de Berg received funding from Alzheimer Netherlands and LECMA (ISAO #14536‐LECMA #14797). Wilma van de Berg was financially supported by grants from Amsterdam Neuroscience, Dutch Research Council (ZonMW), Stichting Parkinson Fonds, Alzheimer association, and Rotary Aalsmeer‐Uithoorn. Wilma van de Berg performed contract research and consultancy for Roche Pharma, Lysosomal Therapeutics, CHDR, Cross beta Sciences and received research consumables from Roche and Prothena.
Supporting information
Figure S1 Scatter plots showing the correlations between (A) age and LN‐transformed cerebrospinal fluid neurofilament light chain (PD patients: r = 0.43, p = 0.005; controls: r = 0.57, p < 0.001) and (B) age and LN‐transformed serum neurofilament light chain (PD r = 0.49, p < 0.0001; HC r = 0.45, p < 0.01). Abbreviations: CSF, cerebrospinal fluid; HC, healthy controls; LN, natural log; PD, Parkinson disease
Figure S2 The discriminatory value of neurofilament light in cerebrospinal fluid (CSF) and serum as a single biomarker and as part of a panel of CSF biomarkers. Receiver operating curve for a panel of CSF biomarkers consisting of α‐synuclein species (blue line, AUC 0.88); receiver operating curve for a panel of CSF p‐tau and α‐synuclein species (red line, AUC 0.89); receiver operating curve for a panel of CSF biomarkers including CSF neurofilament light chain (green line, AUC 0.92); receiver operating curve for a panel of CSF biomarkers in combination with serum neurofilament light chain (orange line, AUC 0.90).
Acknowledgments
We thank all patients and controls for their participation. We also thank dr. Karin van Dijk (Amsterdam UMC) for collecting the clinical data and blood and CSF and biobanking VUmc, Parkinson Vereniging, and Amsterdam Neuroscience for their contributions to this study.
Relevant conflicts of interest/financial disclosures: Charlotte Teunissen leads a working group for NfL in Multiple Sclerosis, cosponsored by Quanterix corporation. No other authors have conflicts of interest or financial disclosures.
Funding agencies: Amsterdam Neuroscience funded this study.
References
- 1. Farotti L, Paciotti S, Tasegian A, et al. Discovery, validation and optimization of cerebrospinal fluid biomarkers for use in Parkinson's disease. Expert Rev Mol Diagn 2017;17(8):771–780. [DOI] [PubMed] [Google Scholar]
- 2. Parnetti L, Castrioto A, Chiasserini D, et al. Cerebrospinal fluid biomarkers in Parkinson disease. Nat Rev Neurol 2013;9(3):131–140. [DOI] [PubMed] [Google Scholar]
- 3. van Dijk KD, Jongbloed W, Heijst JA, et al. Cerebrospinal fluid and plasma clusterin levels in Parkinson's disease. Parkinsonism Relat Disord 2013;19(12):1079–1083. [DOI] [PubMed] [Google Scholar]
- 4. van Dijk KD, Persichetti E, Chiasserini D, et al. Changes in endolysosomal enzyme activities in cerebrospinal fluid of patients with Parkinson's disease. Mov Disord 2013;28(6):747–754. [DOI] [PubMed] [Google Scholar]
- 5. Majbour NK, Vaikath NN, van Dijk KD, et al. Oligomeric and phosphorylated alpha‐synuclein as potential CSF biomarkers for Parkinson's disease. Mol Neurodegener 2016;11:7. [DOI] [PMC free article] [PubMed] [Google Scholar]
- 6. van Dijk KD, Bidinosti M, Weiss A, et al. Reduced alpha‐synuclein levels in cerebrospinal fluid in Parkinson's disease are unrelated to clinical and imaging measures of disease severity. Eur J Neurol 2014;21(3):388–394. [DOI] [PubMed] [Google Scholar]
- 7. Parnetti L, Gaetani L, Eusebi P, et al. CSF and blood biomarkers for Parkinson's disease. Lancet Neurol 2019;18(6):573–586. [DOI] [PubMed] [Google Scholar]
- 8. Parnetti L, Farotti L, Eusebi P, et al. Differential role of CSF alpha‐synuclein species, tau, and Abeta42 in Parkinson's disease. Front Aging Neurosci 2014;6:53. [DOI] [PMC free article] [PubMed] [Google Scholar]
- 9. Petzold A. Neurofilament phosphoforms: surrogate markers for axonal injury, degeneration and loss. J Neurol Sci 2005;233(1–2):183–198. [DOI] [PubMed] [Google Scholar]
- 10. Bridel C, van Wieringen WN, Zetterberg H, et al. Diagnostic value of cerebrospinal fluid neurofilament light protein in neurology: a systematic review and meta‐analysis. JAMA Neurol 2019; doi: 10.1001/jamaneurol.2019.1534. [DOI] [PMC free article] [PubMed] [Google Scholar]
- 11. Chu Y, Morfini GA, Langhamer LB, et al. Alterations in axonal transport motor proteins in sporadic and experimental Parkinson's disease. Brain 2012;135(Pt 7):2058–2073. [DOI] [PMC free article] [PubMed] [Google Scholar]
- 12. Kordower JH, Olanow CW, Dodiya HB, et al. Disease duration and the integrity of the nigrostriatal system in Parkinson's disease. Brain 2013;136(Pt 8):2419–2431. [DOI] [PMC free article] [PubMed] [Google Scholar]
- 13. Moors TE, Maat CA, Niedieker D, et al. The orchestration of subcellular alpha‐synuclein pathology in the Parkinson's disease brain revealed by STED microscopy. BioRxiv 2018; https://www.biorxiv.org/content/10.1101/470476v1.
- 14. Kuhle J, Barro C, Andreasson U, et al. Comparison of three analytical platforms for quantification of the neurofilament light chain in blood samples: ELISA, electrochemiluminescence immunoassay and Simoa. Clin Chem Lab Med 2016;54(10):1655–1661. [DOI] [PubMed] [Google Scholar]
- 15. Marques TM, van Rumund A, Oeckl P, et al. Serum NFL discriminates Parkinson disease from atypical parkinsonisms. Neurology 2019;92(13):e1479–e86. [DOI] [PubMed] [Google Scholar]
- 16. Hansson O, Janelidze S, Hall S, et al. Blood‐based NfL: A biomarker for differential diagnosis of parkinsonian disorder. Neurology 2017;88(10):930–937. [DOI] [PMC free article] [PubMed] [Google Scholar]
- 17. Hughes AJ, Daniel SE, Kilford L, et al. Accuracy of clinical diagnosis of idiopathic Parkinson's disease: a clinico‐pathological study of 100 cases. J Neurol Neurosurg Psychiatry 1992;55(3):181–184. [DOI] [PMC free article] [PubMed] [Google Scholar]
- 18. Roth M, Tym E, Mountjoy CQ, et al. CAMDEX. A standardised instrument for the diagnosis of mental disorder in the elderly with special reference to the early detection of dementia. Br J Psychiatry 1986;149:698–709. [DOI] [PubMed] [Google Scholar]
- 19. Fahn S, Elton R. Unified Rating Scale for Parkinson's Disease. Florham Park, NY: Macmillan; 1987:153–163. [Google Scholar]
- 20. Jankovic J, McDermott M, Carter J, et al. Variable expression of Parkinson's disease: a base‐line analysis of the DATATOP cohort. The Parkinson Study Group. Neurology 1990;40(10):1529–534. [DOI] [PubMed] [Google Scholar]
- 21. Teunissen CE, Petzold A, Bennett JL, et al. A consensus protocol for the standardization of cerebrospinal fluid collection and biobanking. Neurology 2009;73(22):1914–1922. [DOI] [PMC free article] [PubMed] [Google Scholar]
- 22. Andreasson U, Perret‐Liaudet A, Van Waalwijk van Doorn LJ, et al. A practical guide to immunoassay method validation. Front Neurol 2015;6:179. [DOI] [PMC free article] [PubMed] [Google Scholar]
- 23. Petzold A, Altintas A, Andreoni L, et al. Neurofilament ELISA validation. J Immunol Methods 2010;352(1‐2):23–31. [DOI] [PubMed] [Google Scholar]
- 24. Yilmaz A, Blennow K, Hagberg L, et al. Neurofilament light chain protein as a marker of neuronal injury: review of its use in HIV‐1 infection and reference values for HIV‐negative controls. Expert Rev Mol Diagn 2017;17(8):761–770. [DOI] [PubMed] [Google Scholar]
- 25. Disanto G, Barro C, Benkert P, et al. Serum neurofilament light: a biomarker of neuronal damage in multiple sclerosis. Ann Neurol 2017;81(6):857–870. [DOI] [PMC free article] [PubMed] [Google Scholar]
- 26. Mattsson N, Andreasson U, Zetterberg H, et al. Association of plasma neurofilament light with neurodegeneration in patients with Alzheimer disease. JAMA Neurol 2017;74(5):557–566. [DOI] [PMC free article] [PubMed] [Google Scholar]
- 27. Norgren N, Rosengren L, Stigbrand T. Elevated neurofilament levels in neurological diseases. Brain Res 2003;987(1):25–31. [DOI] [PubMed] [Google Scholar]
- 28. Gaiottino J, Norgren N, Dobson R, et al. Increased neurofilament light chain blood levels in neurodegenerative neurological diseases. PLoS One 2013;8(9):e75091. [DOI] [PMC free article] [PubMed] [Google Scholar]
- 29. Khalil M, Teunissen CE, Otto M, et al. Neurofilaments as biomarkers in neurological disorders. Nat Rev Neurol 2018;14(10):577–589. [DOI] [PubMed] [Google Scholar]
- 30. Trapp BD, Peterson J, Ransohoff RM, et al. Axonal transection in the lesions of multiple sclerosis. N Engl J Med 1998;338(5):278–285. [DOI] [PubMed] [Google Scholar]
- 31. Menke RA, Gray E, Lu CH, et al. CSF neurofilament light chain reflects corticospinal tract degeneration in ALS. Ann Clin Transl Neurol 2015;2(7):748–755. [DOI] [PMC free article] [PubMed] [Google Scholar]
- 32. Moore EE, Hohman TJ, Badami FS, et al. Neurofilament relates to white matter microstructure in older adults. Neurobiol Aging 2018;70:233–241. [DOI] [PMC free article] [PubMed] [Google Scholar]
- 33. Kuhle J, Barro C, Disanto G, et al. Serum neurofilament light chain in early relapsing remitting MS is increased and correlates with CSF levels and with MRI measures of disease severity. Mult Scler 2016;22(12):1550–1559. [DOI] [PubMed] [Google Scholar]
- 34. Meeter LH, Dopper EG, Jiskoot LC, et al. Neurofilament light chain: a biomarker for genetic frontotemporal dementia. Ann Clin Transl Neurol 2016;3(8):623–636. [DOI] [PMC free article] [PubMed] [Google Scholar]
- 35. Novakova L, Zetterberg H, Sundstrom P, et al. Monitoring disease activity in multiple sclerosis using serum neurofilament light protein. Neurology 2017;89(22):2230–2237. [DOI] [PMC free article] [PubMed] [Google Scholar]
- 36. Mariotto S, Farinazzo A, Magliozzi R, et al. Serum and cerebrospinal neurofilament light chain levels in patients with acquired peripheral neuropathies. J Periphe Nnerv Syst 2018;23(3):174–177. [DOI] [PubMed] [Google Scholar]
- 37. Hall S, Surova Y, Ohrfelt A, et al. CSF biomarkers and clinical progression of Parkinson disease. Neurology 2015;84(1):57–63. [DOI] [PMC free article] [PubMed] [Google Scholar]
- 38. Backstrom DC, Eriksson Domellof M, Linder J, et al. Cerebrospinal fluid patterns and the risk of future dementia in early, incident Parkinson disease. JAMA Neurol 2015;72(10):1175–1182. [DOI] [PubMed] [Google Scholar]
- 39. Hall S, Ohrfelt A, Constantinescu R, et al. Accuracy of a panel of 5 cerebrospinal fluid biomarkers in the differential diagnosis of patients with dementia and/or parkinsonian disorders. Arch Neurol 2012;69(11):1445–1452. [DOI] [PubMed] [Google Scholar]
- 40. Constantinescu R, Rosengren L, Johnels B, et al. Consecutive analyses of cerebrospinal fluid axonal and glial markers in Parkinson's disease and atypical Parkinsonian disorders. Parkinsonism Relat Disord 2010;16(2):142–145. [DOI] [PubMed] [Google Scholar]
- 41. Herbert MK, Aerts MB, Beenes M, et al. CSF neurofilament light chain but not FLT3 ligand discriminates parkinsonian disorders. Front Neurol 2015;6:91. [DOI] [PMC free article] [PubMed] [Google Scholar]
- 42. Kamagata K, Motoi Y, Abe O, et al. White matter alteration of the cingulum in Parkinson disease with and without dementia: evaluation by diffusion tensor tract‐specific analysis. AJNR Am J Neuroradiol 2012;33(5):890–895. [DOI] [PMC free article] [PubMed] [Google Scholar]
- 43. Minett T, Su L, Mak E, et al. Longitudinal diffusion tensor imaging changes in early Parkinson's disease: ICICLE‐PD study. J Neurol 2018;265(7):1528–1539. [DOI] [PubMed] [Google Scholar]
- 44. Bacioglu M, Maia LF, Preische O, et al. Neurofilament light chain in blood and CSF as marker of disease progression in mouse models and in neurodegenerative diseases. Neuron 2016;91(2):494–496. [DOI] [PubMed] [Google Scholar]
- 45. Skillback T, Farahmand B, Bartlett JW, et al. CSF neurofilament light differs in neurodegenerative diseases and predicts severity and survival. Neurology 2014;83(21):1945–1953. [DOI] [PubMed] [Google Scholar]
- 46. Verberk IMW, Slot RE, Verfaillie SCJ, et al. Plasma amyloid as prescreener for the earliest alzheimer pathological changes. Ann Neurol 2018;84(5):648–658. [DOI] [PMC free article] [PubMed] [Google Scholar]
- 47. Goldman JG, Andrews H, Amara A, et al. Cerebrospinal fluid, plasma, and saliva in the BioFIND study: relationships among biomarkers and Parkinson's disease features. Mov Disord 2018;33(2):282–288. [DOI] [PMC free article] [PubMed] [Google Scholar]
- 48. Lim NS, Swanson CR, Cherng HR, et al. Plasma EGF and cognitive decline in Parkinson's disease and Alzheimer's disease. Ann Clin Transl Neurol 2016;3(5):346–355. [DOI] [PMC free article] [PubMed] [Google Scholar]
- 49. Rocha NP, Teixeira AL, Scalzo PL, et al. Plasma levels of soluble tumor necrosis factor receptors are associated with cognitive performance in Parkinson's disease. Mov Disord 2014;29(4):527–531. [DOI] [PubMed] [Google Scholar]
- 50. Pchelina S, Emelyanov A, Baydakova G, et al. Oligomeric alpha‐synuclein and glucocerebrosidase activity levels in GBA‐associated Parkinson's disease. Neurosci Lett 2017;636:70–76. [DOI] [PubMed] [Google Scholar]
Associated Data
This section collects any data citations, data availability statements, or supplementary materials included in this article.
Supplementary Materials
Figure S1 Scatter plots showing the correlations between (A) age and LN‐transformed cerebrospinal fluid neurofilament light chain (PD patients: r = 0.43, p = 0.005; controls: r = 0.57, p < 0.001) and (B) age and LN‐transformed serum neurofilament light chain (PD r = 0.49, p < 0.0001; HC r = 0.45, p < 0.01). Abbreviations: CSF, cerebrospinal fluid; HC, healthy controls; LN, natural log; PD, Parkinson disease
Figure S2 The discriminatory value of neurofilament light in cerebrospinal fluid (CSF) and serum as a single biomarker and as part of a panel of CSF biomarkers. Receiver operating curve for a panel of CSF biomarkers consisting of α‐synuclein species (blue line, AUC 0.88); receiver operating curve for a panel of CSF p‐tau and α‐synuclein species (red line, AUC 0.89); receiver operating curve for a panel of CSF biomarkers including CSF neurofilament light chain (green line, AUC 0.92); receiver operating curve for a panel of CSF biomarkers in combination with serum neurofilament light chain (orange line, AUC 0.90).