
FIG. 3.
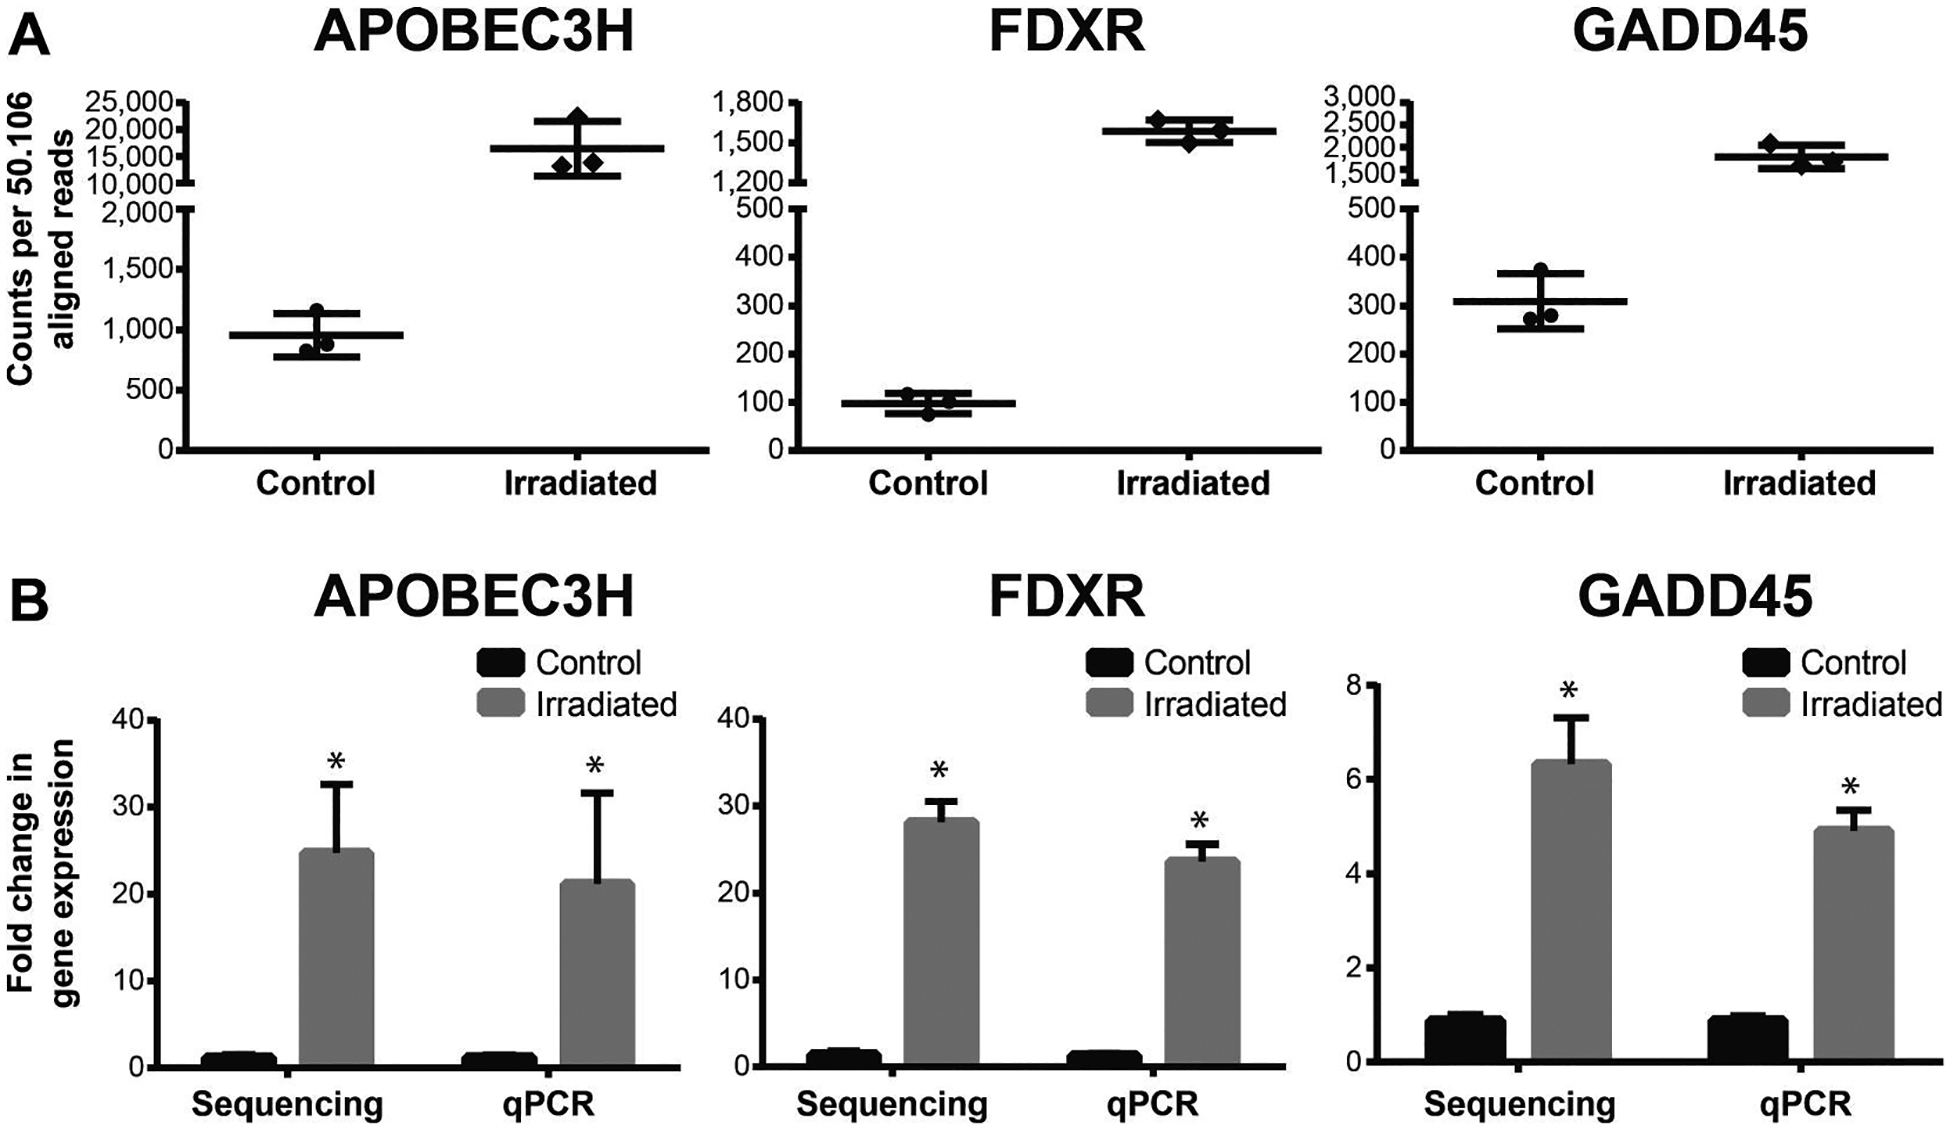
Number of read counts per gene and comparison of the radiation response of APOBEC3H, FDXR and GADD45 by nanopore long-read sequencing analysis versus qPCR. Panel A: The abundance of reads per gene is shown for the control and irradiated samples (counts normalized by library size). Panel B: The fold change between the control and irradiated samples was compared between sequencing and qPCR analyses. Data are shown as mean ± standard deviation. No significant differences were observed (t test, P < 0.05) between sequencing and qPCR analysis. *Significant differences between control and irradiated sample (t test, P ≤ 0.05).