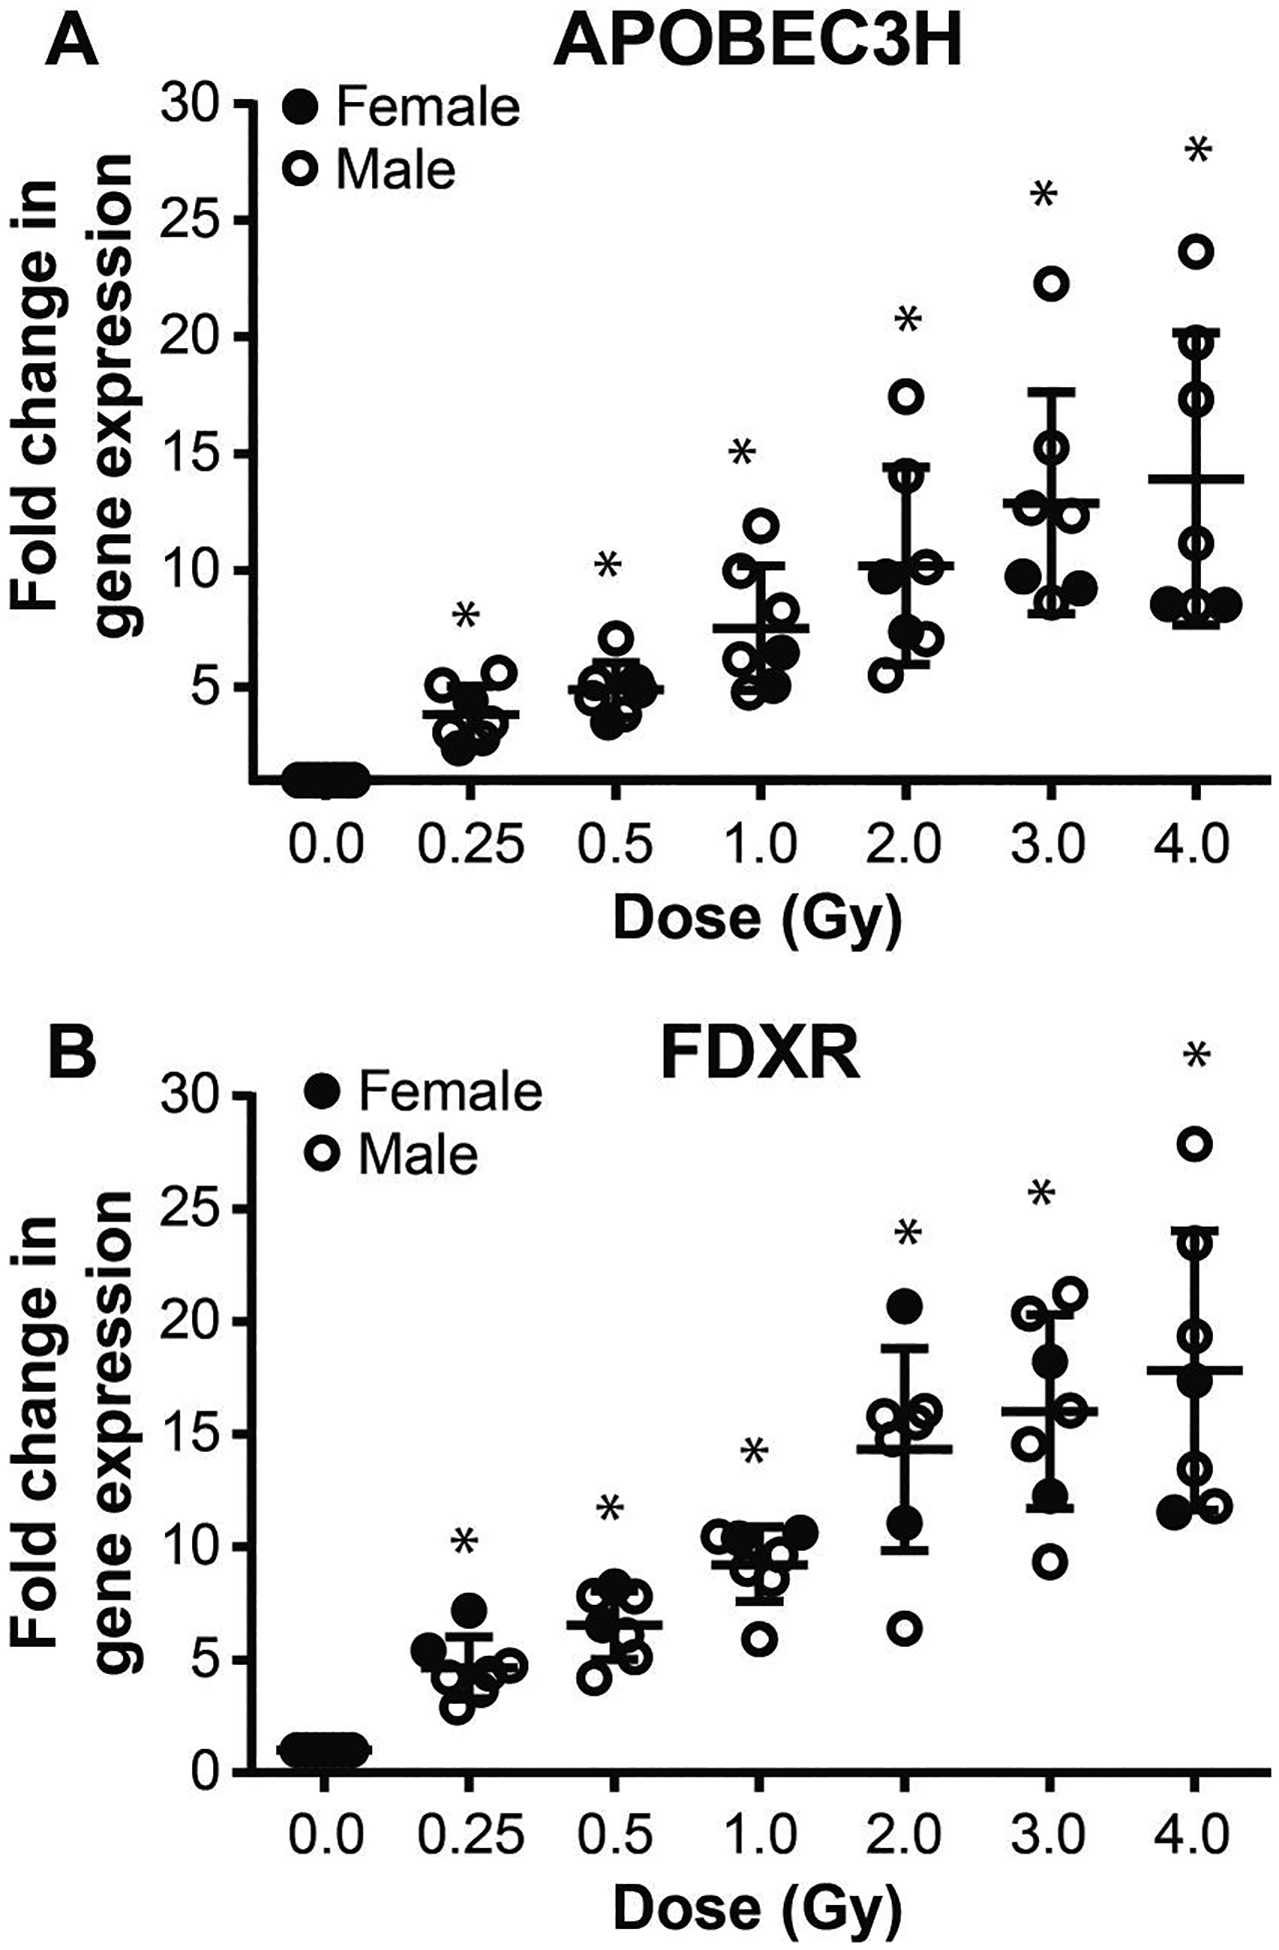
FIG. 5.

Dose-response analyses of APOBEC3H and FDXR. Multiplexed QRT-PCR gene expression fold changes of APOBEC3H and FDXR (panels A and B, respectively) 24 h postirradiation in blood samples from seven healthy donors exposed ex vivo to a range of doses (0.25, 0.5, 1, 2, 3, 4 Gy; 0.5 Gy min−1). *Significantly different from control (paired t test, P ≤ 0.001).
