
Fig. 2.
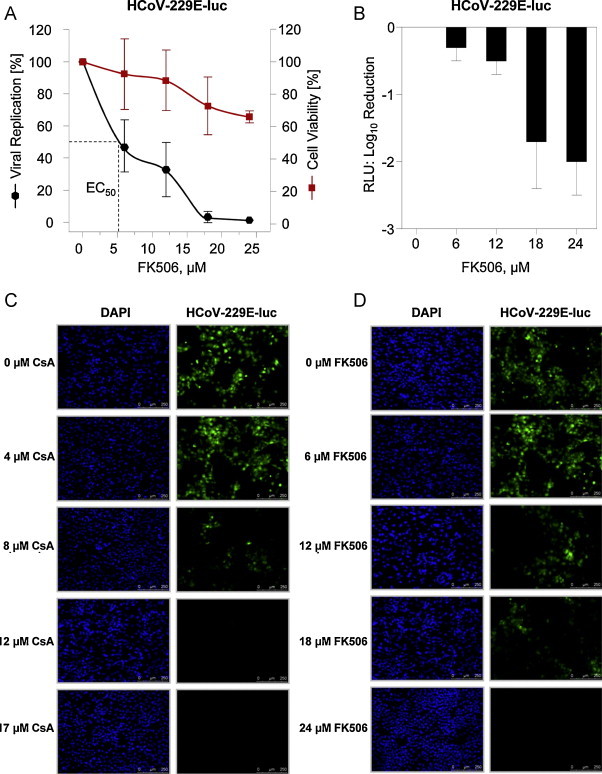
Effect of FK506 on HCoV-229E-LUC replication in HuH7 cells by Renilla activity measurement (A and B) and on HCoV-229E-GFP by quantification of GFP fluorescence (C and D). Data shown are mean values (RLU) of a representative experiment performed in triplicate. The left Y-axis represents the percentage of reduction of virus replication in linear scale (A) and in log scale (B), respectively, at the indicated inhibitor concentrations given on the X-axis. Percentage of cell viability with the mock-treated cells set to 100% are shown on the right Y-axis (A). Virus reduction values in log scale are given on the Y-axis of (B). Quantification of GFP fluorescence was used as a semiquantitative measure of virus reduction at the indicated inhibitor concentrations (C and D).