

Abstract
Clinical trials need to specify which specific gait characteristics to monitor as digital mobility outcomes for each neurological disorder. This study aimed to identify a set of measures from daily-life monitoring that best discriminate mobility between people with Multiple Sclerosis (MS) and age-matched healthy control subjects (MS-Ctl), and between people with Parkinson’s Disease (PD) and age-matched healthy control subjects (PD-Ctl). Further, we investigated how these discriminative measures relate to disease severity of MS or PD. We recruited 13 people with MS, 21 MS-Ctl, 29 people with idiopathic PD, and 20 PD-Ctl. Subjects wore 3 inertial sensors on their feet and the lumbar back for a week. The Area Under Curves (AUC) from receiver operator characteristic (ROC) plots was calculated for each measure to determine the objective measures that best separated the MS and PD groups from their respective control cohorts. Adherence wearing the sensors was similar among groups for 58–66 hours of recording (p=0.14). Quantity of mobility (activity measures, such as median number of strides per gait bout, AUC = 0.93) best discriminated mobility impairments in MS from MS-Ctl. In contrast, quality of mobility (such as turn angle, AUC = 0.90) best discriminated mobility impairments in PD from PD-Ctl. Mobility measures with AUC >.80 were correlated with MS and PD clinical scores of disease severity. Thus, digital outcome measures characterizing mobility impairments differ for MS versus PD during daily life. Hence, digital outcome measures of mobility for clinical trials and clinical practice need to be specific to each neurological disorder.
Keywords: Mobility, Neurological Disorders, Parkinson’s Disease, Multiple Sclerosis
Introduction
Mobility (gait and turning) is crucial for maintaining independence and quality of life. Gait and turning impairments are very common in patients with neurological disorders, leading to increased risk of falls and reduced quality of life [1]–[3]. Specific types of mobility impairments differ depending upon the neurological disorder. For example, weakness, spasticity, and ataxia impairments characterize mobility impairments in people with multiple sclerosis (MS), whereas bradykinesia, shuffling, freezing, and difficulties in turning characterize mobility impairments in people with Parkinson’s Disease (PD). Gait speed slows in individuals with any neurological disorder or aging [4]. However, slow gait is a general, universal characteristic of impaired mobility and may not be the most specific nor discriminative mobility impairment for each neurological disorder.
The standard neurological examination of mobility in the clinic (such as the 25-foot walk test for MS or the ‘postural instability and gait disability’ (PIGD) subscore of four items in the Motor Part III of the Movement Disorder Society-Unified Parkinson’s Disease Rating Scale (MDS-UPDRS)) relies primarily on very short duration gait while being observed by a clinician. The key challenge in the clinic is that mobility impairments may not be observable in a small examination room nor during short walks when all attention is focused on walking [5]. Patients perform better in the clinic, while being observed (the white coat effect [6], [7]), than at home. Also, turning, a complex coupling of balance and gait critical for functional mobility is usually not even evaluated [8]. Further, the clinic observation at one-time point misses the daily fluctuations (variability) of mobility in response to medications, fatigue, and other conditions, and as a result, may not reflect actual, functional performance in the natural environment. Hence, there is an unmet need to determine the specific measures of mobility (gait and turning) that can objectively and continuously monitor mobility during daily life that are representative of different disorders.
Recently, the use of wearable sensors has made it possible to quantify digital mobility outside the clinic and during real-life [8]–[27]. Various researchers have shown that wearable sensors can be used to augment the standard clinical assessment based on active monitoring, such as performing prescribed/predefined tests at home or based on passive monitoring, during routine, daily life tasks in the community [28]. In this study, we derived digital outcome measures of mobility from passive monitoring from natural walking and turning during unrestricted daily activities over one week.
Clinical trials or clinical practices evaluating response to interventions need to specify which particular characteristics of mobility to monitor as digital-mobility outcome measures for each neurological disorder. Key challenges in using wearable sensors to monitor mobility in daily life are an excessive number of gait and turning measures and a lack of consensus on the most useful measures for each neurological disorder [11]. Mobility measures from passive continuous monitoring during daily living can capture both quantity characteristics (e.g. number of strides per hour, number of turns per hour, number of gait bouts, etc.) as well as quality characteristics (e.g., spatio-temporal gait or turning characteristics such as stride length, stride time variability, turning velocity, etc.) [29].
To reduce mobility characteristics, previous studies have used factor analysis or principle component analysis to identify separate domains of mobility. For example, lower body, upper body, and turning have been previously shown to be relatively independent during clinical gait testing [30]. In addition, activity and variability domains have been used to characterize mobility in the laboratory and during daily life [11], [19], [31], [32]. In this paper, we grouped our mobility measures into five domains: Upper Body, Lower Body, Turning, Activity and Variability. The measures incorporating all the domains of mobility, except activity, are referred as “quality of mobility”, and measures within the activity domain is referred to as “quantity of mobility”. Determining which mobility measures best discriminate mobility impairments related to severity of MS and PD compared to corresponding age-matched healthy control cohorts is needed to monitor the response to therapy [11], [13], [33]–[35].
The objective of the present study was to investigate which specific measures best discriminate mobility, during real-life monitoring, in people with MS and PD from their age-matched control cohorts and the extent to which these measures show face validity by relating to clinical evaluation of disease severity. We hypothesized that the most discriminative domains of mobility will differ for MS and PD, and the worse these mobility measures, the more severe the disease.
Methods
Participants:
Thirteen people with MS, 21 MS-Ctl healthy controls, 29 people with PD and 20 PD-Ctl healthy controls participated in the study. Inclusion criteria for PD were a diagnosis of idiopathic Parkinson’s disease treated with levodopa by a movement disorders specialist, Hoehn & Yahr scores of II-IV, and complaints about mobility. Inclusion criteria for MS were a confirmed diagnosis of relapsing-remitting or progressive MS, a mild-to-moderate MS-associated disability (EDSS score ≤ 6.0) confirmed by a neurologist specialist, and complaints about mobility. Exclusion criteria for all subjects, included inability to follow protocol instructions, other factors affecting gait such as musculoskeletal disorders, uncorrected vision or vestibular problems, or inability to stand or walk in the home without an assistive device. The experimental protocol was approved by the Institutional Review Board of the Oregon Health & Science University. All the participants provided informed written consent.
Data collection:
Subjects were asked to wear 3 inertial sensors (Opals by APDM, Inc., Portland, OR, USA), one on top of each foot and one over the lumbar area for a week of continuous monitoring for at least 8 hours/day. Each Opal sensor contains a tri-axial accelerometer, gyroscope, and magnetometer sampling at 128 Hz. The Opals are lightweight (<25 g), have a battery life of more than 12 h, and includes 8 GB of storage, that can record over 30 days of data. Subjects removed the sensors at night and recharged the batteries. Data were stored in the internal memory of the Opals. Subjects mailed back the sensors using a pre-paid box after completion of one week of data collection. Data were uploaded to a secure cloud-based database upon return of the devices and downloaded to a local computer for further processing.
In the laboratory, clinical scores provided estimates of severity of MS or PD. Subjects with MS walked 25 feet as quickly, but safely, as possible from one marked line on the floor to another, similar to a Timed 25- Foot Walk test [36], [37]. Further, we collected patient-reported outcomes: Patient-Reported Expanded Disability Statue Scale (PREDSS) [38], [39], Multiple Sclerosis Walking Scale (MSWS-12) [40], and the Modified Fatigue Index Scale (MFIS) [41]. Subjects with PD were tested in the ON levodopa state with the MDS-UPDRS Part III Motor Signs, including the postural instability and gait disability (PIGD) subscore.
Measures of mobility:
The algorithms used for detecting gait bouts and extracting spatial and temporal measures of gait and turning were detailed previously (Shah et al. 2019, under review). In summary, the algorithm first searches for possible bouts of walking using a time-domain approach to inertial sensor data from the feet and for turns based on yaw rotational orientation of the pelvis. Second, individual steps are combined into potential bouts of walking, as long as the duration from one step to the next step is no longer than 2.5 seconds. Finally, each possible bout that contains at least 3 steps and is at least 3 seconds in duration is processed with the commercial gait analysis algorithms included in Mobility Lab (APDM, Inc., Portland, Oregon). Our gait analysis algorithm uses the Unscented Kalman Filter to fuse information from the accelerometers, gyroscopes, and magnetometers to precisely estimate the orientation and position trajectory of each foot between quiet stance periods [42], [43]. This approach reduces the problem of tracking over a long period of time. For the results reported in this paper, we only included stride pairs during periods of straight walking, and we excluded walking during turns, which were characterized independently. For turning measures, we used a previously published algorithm to detect and characterize each turn [8].
In total, we extracted 46 digital outcome measures of mobility and grouped them into five domains similar to previous factor analysis: 10 Lower Body, 3 Upper Body, 7 Turning, 6 Activity, and 20 Variability [30]–[32]. We evaluated the variability of each measure from all the gait strides and turns across the 7 days as the coefficient of variation (standard deviation divided by the mean, CV). The detailed description of the definition of mobility measure is given in Appendix 1.
Statistical analysis:
Normality of data was determined with Shapiro-Wilk tests and parametric analysis was used, unless otherwise stated. Independent t-tests or Mann-Whitney U tests (if not normally distributed) were used to compare demographics between groups. One-way Analysis of Variance or Kruskal-Wallis rank sum test (if not normally distributed) was used to compare total time duration of recording across all groups.
To investigate which measures discriminate mobility in MS from MS-Ctl group, and PD from PD-Ctl group we used Receiver Operating Characteristic (ROC) curves [44] and computed the Area Under Curve (AUC) [45]. Since, MS-Ctl are expected to be younger than PD-Ctl, we also computed AUC to observe the effect of age. All statistical analysis was performed using R Version 1.1.456 software.
Face validity of the top mobility measures discriminating MS and PD groups was determined by relating the weekly average mobility measures to measures of severity of neurological disease. Specifically, Spearman’s correlation was used to assess the relation between mobility measures and severity of MS (PREDSS, MFIS, MSWS, and gait speed from timed 25-foot walk test) and severity of PD (such as UDPRS Part III, and PIGD sub-score of the UPDRS Part III).
Results
Group characteristics and adherence
Age, height and weight were similar between the MS and MS-Ctl and between the PD and PD-Ctl groups. Table 1 shows demographics and clinical characteristics of subjects who participated in this study. The weekly recordings for each subject group averaged 65.23 ± 7.34 (mean ± SD) hours in MS, 66.34 ± 16.06 hours in MS-Ctl, 66.35 ± 13.60 hours in PD, and 58.34 ± 14.89 hours in PD-Ctl of continuous data. The Kruskal-Wallis rank sum test on groups showed no significant differences in total hours of mobility recording per week (p = 0.14) supporting feasibility of the approach.
Table 1.
Demographics and clinical characteristics of each group.
| MS-Ctl (N = 21) |
MS (N = 13) |
p | PD-Ctl (N = 20) |
PD (N = 29) |
p | |||||
|---|---|---|---|---|---|---|---|---|---|---|
| Mean | SD | Mean | SD | Mean | SD | Mean | SD | |||
| Age (yrs) | 46.43 | 11.06 | 48.69 | 11.10 | 0.57 | 66.85 | 7.16 | 67.66 | 5.27 | 0.65 |
| Height (m) | 1.68 | 0.08 | 1.70 | 0.10 | 0.85a | 1.70 | 0.18 | 1.71 | 0.13 | 0.65 |
| Weight (kg) | 65.84 | 11.07 | 75.92 | 20.80 | 0.13 | 74.61 | 9.38 | 75.95 | 12.73 | 0.69 |
| Male/Female | 5/16 | 3/10 | 12/8 | 17/12 | ||||||
| PREDSS | 4.27 | 0.61 | ||||||||
| MSWS | 28.69 | 9.53 | ||||||||
| MFIS | 37.92 | 17.01 | ||||||||
| UPDRS-III | 34.66 | 11.02 | ||||||||
| H & Y stage | 2.07 | 0.45 | ||||||||
Mann-Whitney U test
Mobility measures discriminating MS-Ctl from PD-Ctl
MS-Ctl group was younger than PD-Ctl group, specifically, the mean age for MS-Ctl was 46.43 ± 11.06 years, and for PD-Ctl was 64.44 ± 7.52 years. Out of the total 46 mobility measures, five individual mobility measures (variability in number of steps in a turn, turn duration, cadence, step duration and stride duration) best differentiated mobility of the MS-Ctl group from the PD-Ctl group, with an AUC ≥ 0.80 (Figure S1). Gait speed AUC was 0.78. These measures characterize slowness of walking and turning due to aging. Therefore, to minimize the contribution from the aging, we used age-matched control subjects for each neurological disorder.
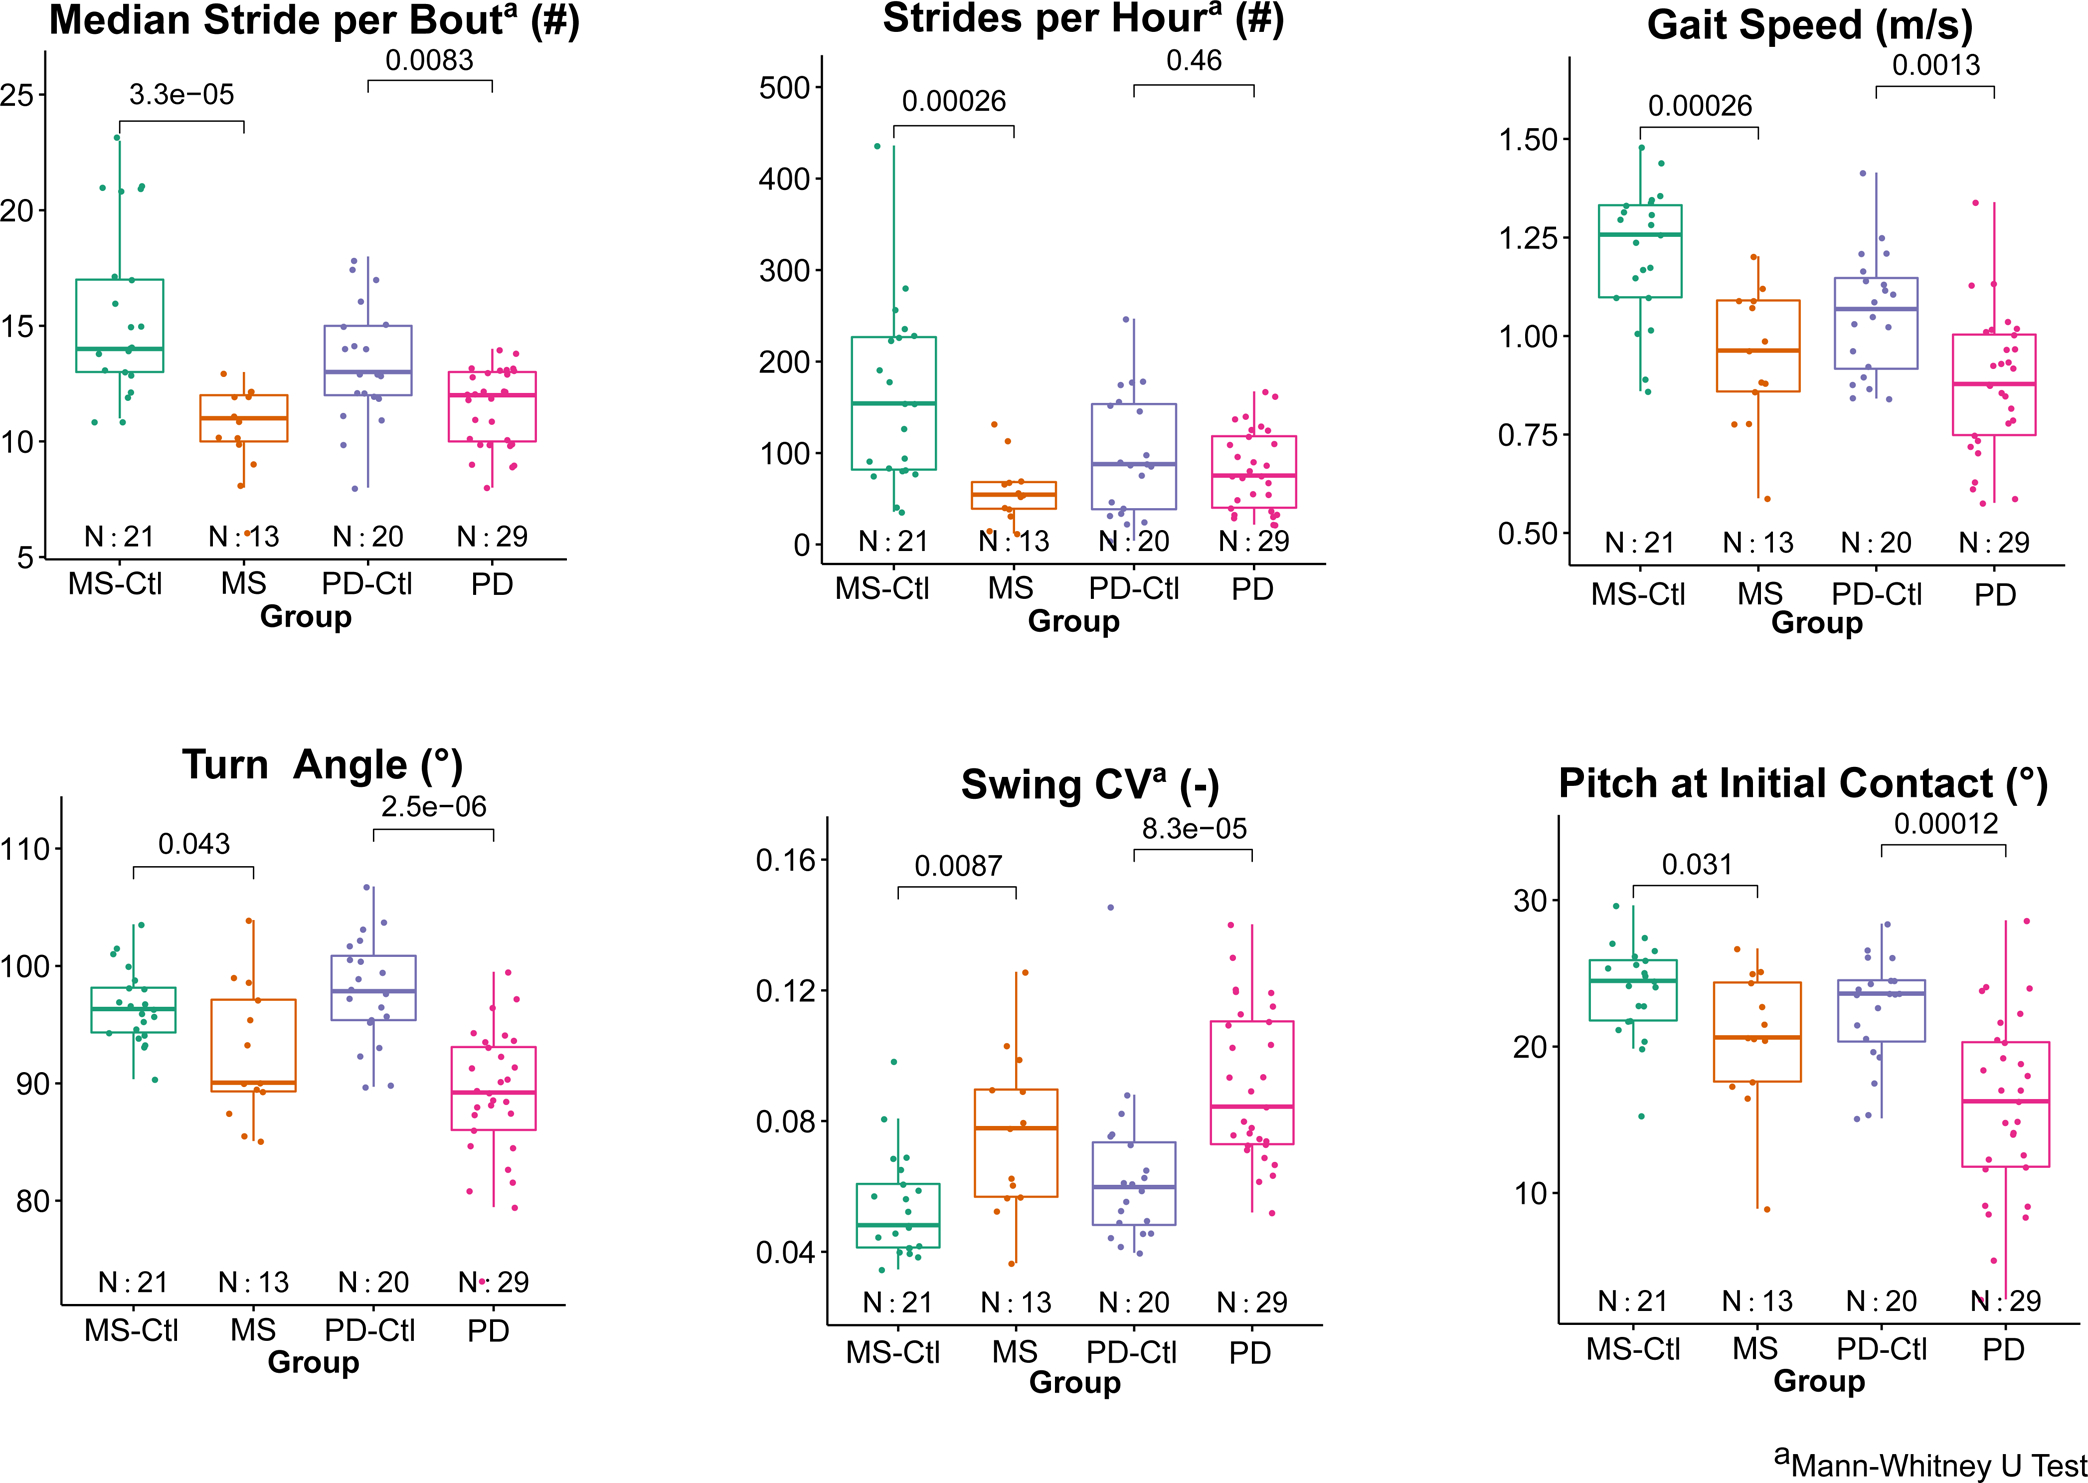
Figure 1 shows scatter plots comparing the most discriminative measures of mobility in groups with MS or PD with their corresponding age-matched control group measures.
Figure 1.
Comparison of group differences between people with MS verus MS-Ctl and between PD versus PD-Ctl for top three mobility measures discriminating MS and PD, respectively. P-values from t-tests between each neurological group and its control group are shown.
Measures of mobility discriminating people with MS from MS-Ctl
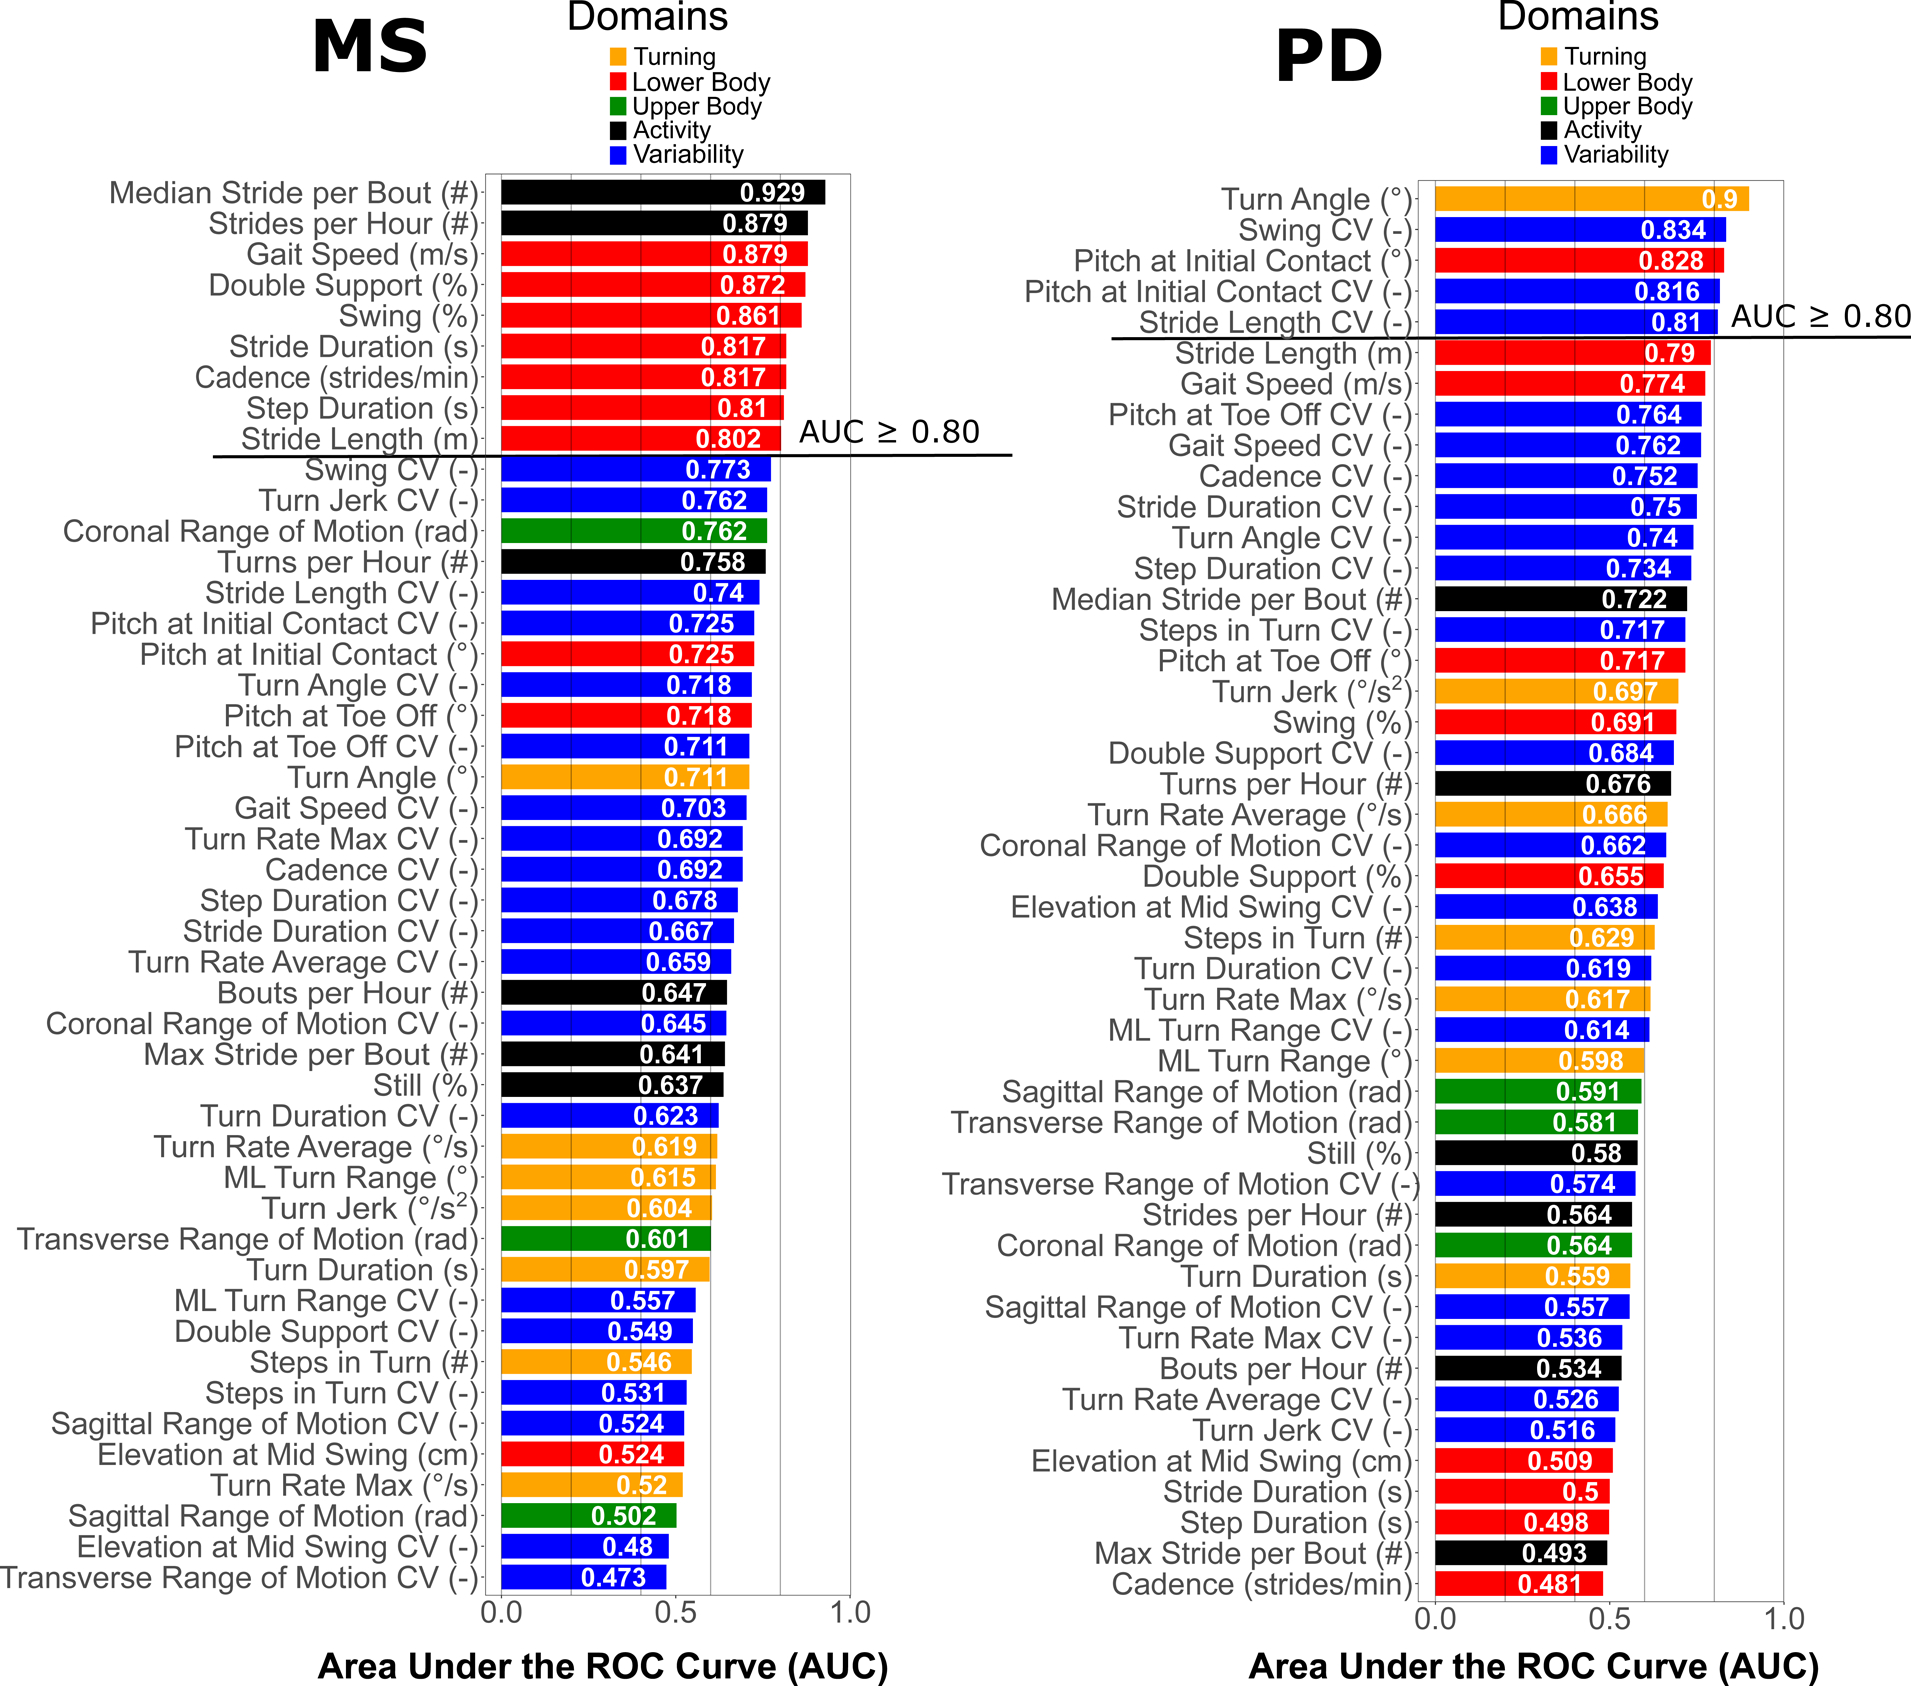
Nine Mobility measures were most discriminative in differentiating mobility of the MS group from the MS-Ctl group, each with an AUC ≥ 0.80 (Figure 2). Gait quantity measures summarizing activity (median number of strides per bout and number of strides per hour) were most discriminative in MS. In addition, gait quality measures related to speed and temporal components (such as percent of gait cycle in single limb, swing phase and percent of the gait cycle in double support) also showed AUC > 0.80.
Figure 2.
AUC (in descending order) for each mobility measure discriminating people with MS and PD groups compared to their healthy control groups. The color-coding scheme is based on domains of mobility as shown in legend.
Mobility measures discriminating people with PD from PD-Ctl
Five mobility measures were most discriminative in differentiating mobility of the PD group from the PD-Ctl group, with an AUC ≥ 0.80 (Figure 2). Figure 2 shows that various gait quality measures related to bradykinesia, shuffling gait (such as smaller turn angles and increased variability of swing phase, and decreased pitch of the foot at initial contact) performed better than the quantity measures of mobility that discriminated gait in people with MS, such as the number of strides/hour or per gait bout.
Face validity of mobility measures
Figure 3 shows correlation of top mobility measures discriminating each neurological disorder with clinical scores. For people with MS, the PREDSS only ranged from 3.5–6 in our cohort but significant correlations (p<.05) were found for percentage cycle in double support (Figure 3), percentage cycle in swing (p=0.022), pitch of the foot at initial contact (p=0.031), and variability of the foot at toe off (p=0.028) (not shown in Figure). Further, the MFIS showed a moderate negative correlation (r=−0.53) with the median number of strides per bout consistent with shorter gait bout lengths in those with complaints of fatigue; this correlation, however, not statistically significant (p=0.063). Gait speed from the 25-foot walk time in the laboratory was also correlated with gait speed over 7 days of daily monitoring. However, none of the top mobility measures showed a significant correlation with MSWS-12 score.
Figure 3.
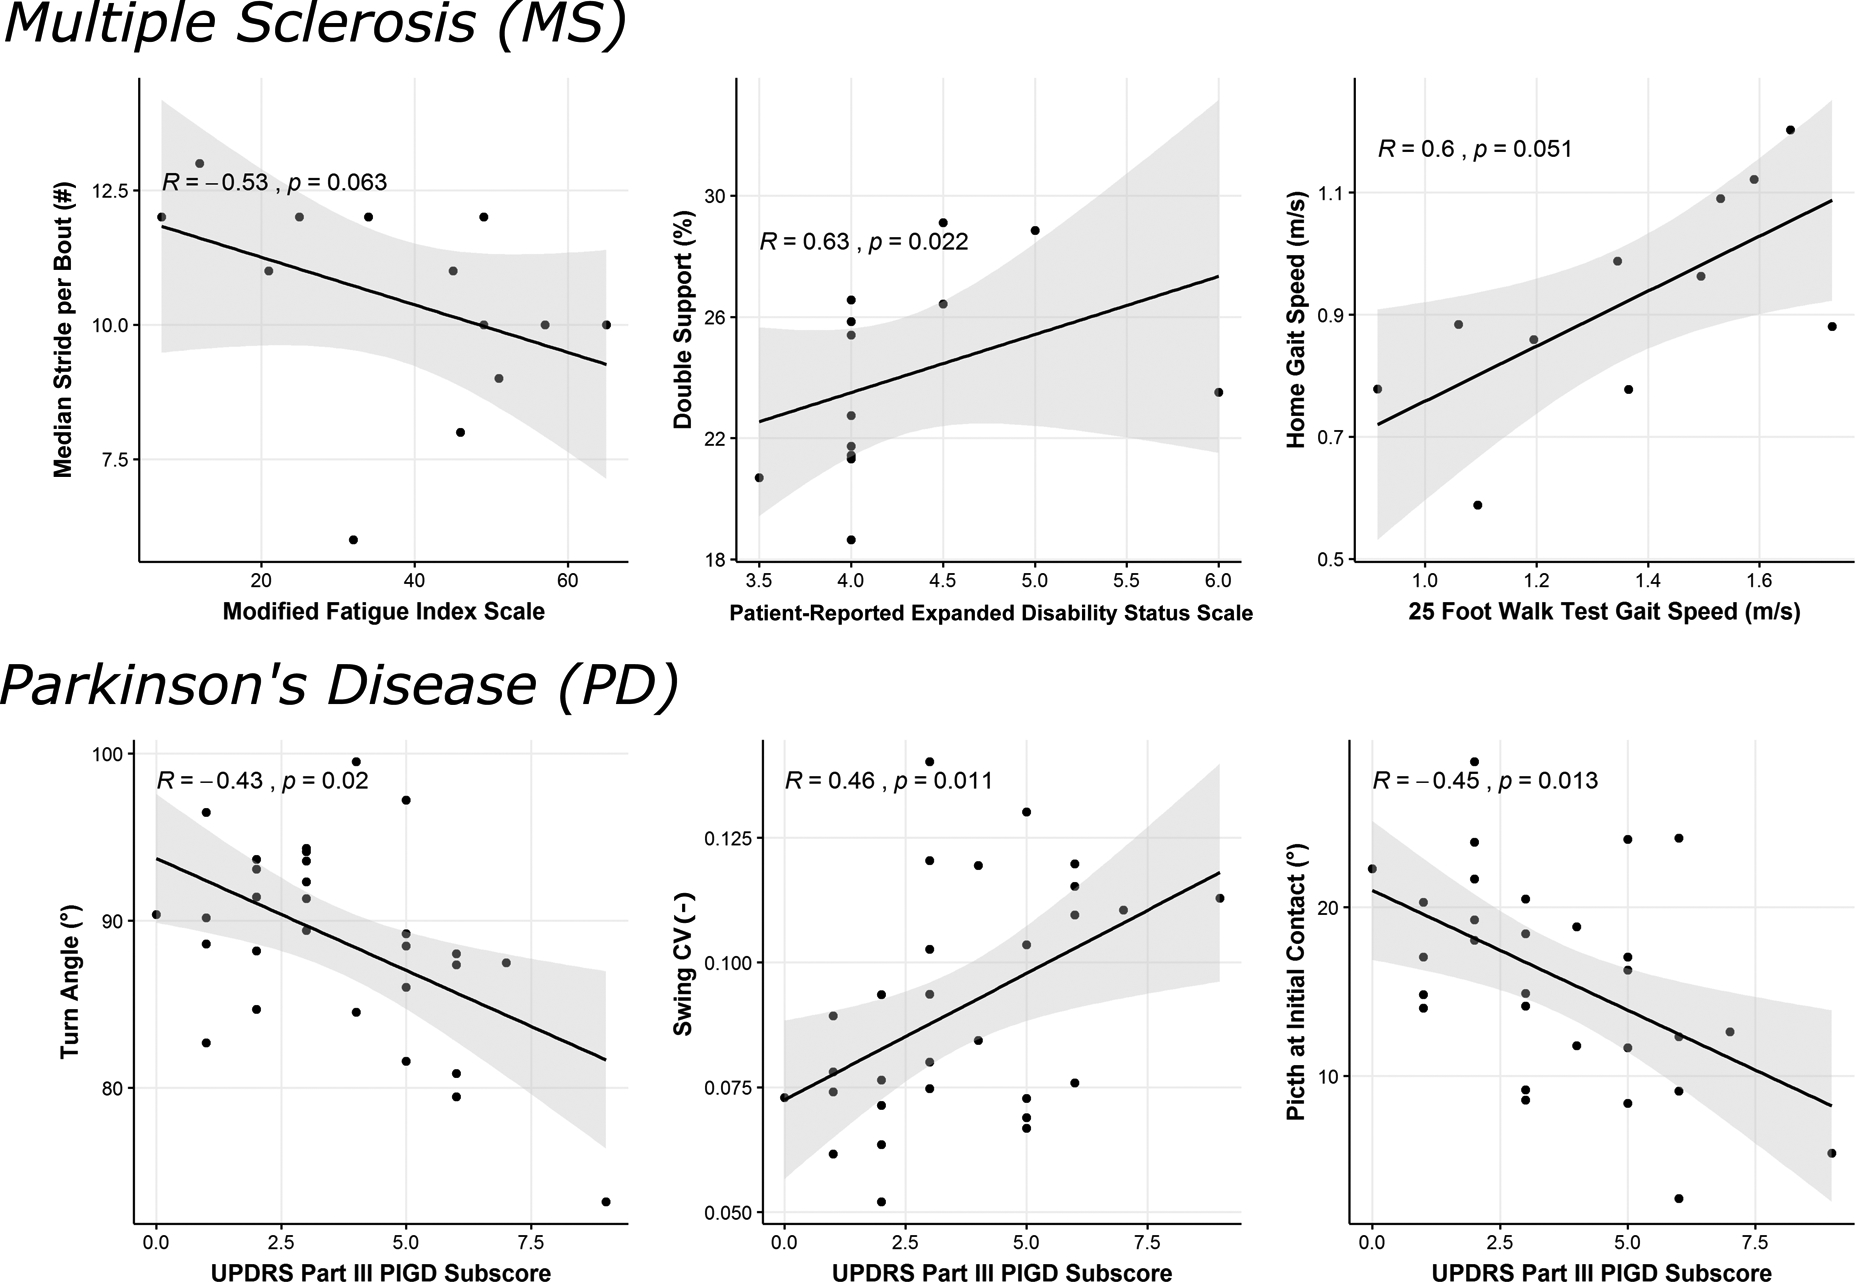
Correlation of discriminative measures of daily mobility with clinical scores related to severity of MS and PD.
For people with PD, the top three discriminative mobility measures (turn angle, swing variability and pitch of the foot at initial contact) were significantly correlated with the PIGD subscore of the MDS-UPDRS Part III (p<.05) as seen in Figure 3. In addition, pitch of the foot at initial contact variability (p=0.018), and stride length (p=0.018) were also significantly correlated with the PIGD subscore. However, none of the top mobility measures were significantly correlated with UPDRS Parts III total score.
Discussion
Our findings demonstrate that different digital measures over a week of daily monitoring discriminated mobility in people with MS than mobility in people with PD. Specifically, smaller median number of strides in the bout was the most discriminative measure in people with MS whereas smaller turn angle was the most discriminative in people with PD. Both quantity and quality of the mobility discriminated well mobility of people with MS from MS-Ctl, however, only quality of mobility discriminated well people with PD from PD-Ctl, and not quantity.
We found that measures of mobility discriminating the older (PD-Ctl) from the younger (MS-Ctl) groups (see supplementary Figure S1), specifically, slow turns, slow cadence and slow gait speed with accompanying changes in gait temporal characteristics) may be related to slowness due to aging and/or various comorbidities (such as arthritis, heart disease) [46], [47]. The mobility measures distinguishing the MS-Ctl versus PD-Ctl control groups were distinct from the top mobility measures characterizing the mobility impairments in MS and PD. Hence, we used age-matched, control cohorts for the two different neurological disorders.
Activity measures, and specifically median number of valid strides in a bout and number of valid strides per hour were smaller in MS, and were the most discriminative measures characterizing mobility impairment in MS. In fact, lower levels of physical activity, and fewer daily step counts have previously been observed in individuals with MS compared to healthy control subjects (see refs. in Block et al. 2016; Giggins, Clay, and Walsh 2017). Furthermore, lower physical activity levels, specifically, fewer steps per day have been shown to be strongly related to EDSS, MSWS-12,Timed 25-Foot Walk test, and 6- Minute Walk test [49], [50]. Thus, it is not surprising that gait speed during passive monitoring in daily life and temporal measures of gait associated with gait speed (double support and swing time as percent of the gait cycle, cadence, step duration and stride length) were also very discriminative measures characterizing gait impairments in MS.
In contrast to people with MS, turning, and specifically smaller turn angles, best characterized mobility disability in people with PD during unsupervised daily mobility. In fact, turning performance has been observed to be greatly compromised in people with PD leading to a reduced quality of life and injurious falls [12], [51]. Specifically, turning characteristics are even more sensitive to early, unmedicated PD than are characteristics of straight-ahead, linear gait in a clinical Timed Up and Go Test [30]. Turning in individuals with PD is characterized by long turning durations, more steps to complete the turn, and slower peak and average speed compared to age-matched, healthy controls in daily life [8], [10]. Turning, specially turning in place 360 degrees is also a trigger for freezing of gait so it is possible that people with PD avoid large turns to avoid freezing. Indeed, a significantly smaller turn angle in freezers was observed in a study of 94 non-freezer and freezer PD subjects passively observed during 3 days of daily life [19]. Also, a recent longitudinal study in community dwelling old adults found that fewer turns in daily life differentiates future recurrent fallers from non-fallers [51]. After turn angle, the swing (percentage of gait cycle) variability measure was the most discriminative to PD. Specifically, higher swing variability was observed in people with PD compared to PD-Ctl. In fact, higher variability in various gait measures was observed previously in patients with PD compared to healthy control subjects in the laboratory [52] and in free living conditions [10], [11], [22]. Further, variability of mobility measures (such as stride-time variability) have been shown to be related to fall risk in PD [26]. Thus, it is not surprising that turn angle, swing CV during passive monitoring in daily life and measures characterizing freezing or shuffling (such as pitch angle of foot at initial contact) were also very discriminative measures characterizing mobility impairments in PD.
Although previous studies have found that people with PD had fewer steps/day than age-matched controls [24], [53], we did not find a significant difference (p=0.35) in number of strides/hour between PD (82.11 ± 43.75) and PD-Ctl groups (98.25 ± 66.83). Further, our total number of steps per day is far less than what has been reported in the literature. Several possibilities may explain this discrepancy: 1) Our number of steps/day did not include turns while turns were included in previous studies. Considering an average ~ 80–100 turns/hour and ~ 3–5 steps per turn, if we add turning, our total number of steps will increase drastically. 2) Lord et al. [24] considered at least one step to qualify as a stepping bout, whereas we considered at least 3 steps to qualify as a bout. 3) We only considered valid strides in each bout for our analysis to avoid the effects due to potential false positive steps, 4) Algorithm differences defining a valid bout and a valid step could result in very different number of steps (or strides) per day. Hence, for activity measures, we recommend caution while comparing our results with consumer grade activity trackers (such as activPAL™, Fitbit).
Mobility measures may be useful to track progression of neurological disease severity. We used the relationship between mobility measures with patient-reported outcomes and clinician-reported outcomes representing disease severity as a type of face (clinical) validity or meaningfulness of the measures. The median number of strides per bout over the week was correlated with the self-reported fatigue scale, MFIS for people with MS. The turning and gait shuffling mobility measures over the week were correlated with the UPDRS PIGD sub score that represents clinician’s evaluation of balance and gait for PD. However, future studies need to determine the test-retest reliability and sensitivity to disease progression of passive mobility monitoring in daily life compared to prescribed tests of gait and turning in the clinic.
There are several limitations of the current study. First, the turn algorithm used in this study was defined by a threshold on vertical rotational rate of the pelvis (15 degree/s) [8]. This can be challenging when turns are nearly as slow and small as the angular velocities and angles of trunk motion during gait. Too high a threshold to detect onset and offset of turns could result in smaller turn angles rather than longer turn durations with the initial and final rate of change of trunk rotation is very slow. Second, we performed all mobility analysis by taking the mean of each measure for all the strides over a week for each subject and thus gave equal weight to each stride. But in reality, gait speed and other measures vary for gait bouts of different lengths [11] and people with MS might have fewer long gait bouts because of the fatigue. Hence, future work will focus on analyzing the effect of bout length on each mobility measure and how gait bout length affects the discriminatory power of each mobility measure. Thirdly, we ranked mobility measures characterizing mobility impairments in MS and PD based on AUC, but we cannot assume this ranking would be identical across all cohorts. Future work with larger cohorts are needed to investigate if these findings would generalize to other individuals. Lastly, in this paper, we report the most discriminative measures of mobility for a specific group of people with MS and a group with PD, but to apply this knowledge in clinical practice, each individual’s gait characteristics are needed to tailor interventions specific for each individual’s specific mobility disability. Future studies need to develop age-related normative values for passive monitoring of mobility. Future work would also explore how to characterize diurnal fluctuations of mobility throughout the day.
Conclusion
Quantity and quality of the mobility both discriminated well people with MS from MS-Ctl, however, only quality of mobility discriminated well people with PD from PD-Ctl, and not quantity. Several of these mobility measures from a week of passive monitoring in daily life were also related to clinical and patient-reported outcomes of neurological severity, providing face (clinical) validity. The most sensitive objective measures of daily life mobility for clinical trials and clinical practice need to be specific for each neurological disease.
Supplementary Material
Acknowledgment:
We thank our participants for generously donating their time to participate and Graham Harker for helping with data collection. This study was supported by the National Multiple Sclerosis Society Mentor Fellowship (MB0027), and National Institutes of Health grants from National Institute of Aging (#R44AG055388 & #R43AG044863).
References:
- [1].Nutt JG, Marsden CD, and Thompson PD, “Human walking and higher-level gait disorders, particularly in the elderly,” no. February, pp. 268–279, 1993. [DOI] [PubMed] [Google Scholar]
- [2].Snijders AH, Van De Warrenburg BP, Giladi N, and Bloem BR, “Neurological gait disorders in elderly people : clinical approach and classifi cation,” vol. 6, no. January, pp. 63–74, 2007. [DOI] [PubMed] [Google Scholar]
- [3].Baker JM, “Gait Disorders,” Am. J. Med, vol. 131, no. 6, pp. 602–607, 2018. [DOI] [PubMed] [Google Scholar]
- [4].Studenski S et al. , “Gait Speed and Survival in Older Adults,” JAMA, vol. 305, no. 1, pp. 50–58, 2011. [DOI] [PMC free article] [PubMed] [Google Scholar]
- [5].Nonnekes J, Goselink RJM, Růzicka E, Fasano A, Nutt JG, and Bloem BR, “Neurological disorders of gait, balance and posture: A sign-based approach,” Nat. Rev. Neurol, vol. 14, no. 3, pp. 183–189, 2018. [DOI] [PubMed] [Google Scholar]
- [6].Larkin KT, Schauss SL, Elnicki DM, and Goodie JL, “Detecting white coat and reverse white coat effects in clinic settings using measures of blood pressure habituation in the clinic and patient self-monitoring of blood pressure,” pp. 516–524, 2007. [DOI] [PubMed] [Google Scholar]
- [7].Hillel I et al. , “Is every-day walking in older adults more analogous to dual-task walking or to usual walking ? Elucidating the gaps between gait performance in the lab and during 24 / 7 monitoring,” vol. 5, pp. 1–12, 2019. [DOI] [PMC free article] [PubMed] [Google Scholar]
- [8].El-Gohary M et al. , “Continuous monitoring of turning in patients with movement disability,” Sensors (Switzerland), vol. 14, no. 1, pp. 356–369, 2014. [DOI] [PMC free article] [PubMed] [Google Scholar]
- [9].Block VAJ, Pitsch E, Tahir P, Cree BAC, Allen DD, and Gelfand JM, “Remote Physical Activity Monitoring in Neurological Disease: A Systematic Review,” PLoS One, vol. 11, no. 4, p. e0154335, 2016. [DOI] [PMC free article] [PubMed] [Google Scholar]
- [10].Mancini M et al. , “Continuous monitoring of turning in Parkinson’s disease: Rehabilitation potential,” NeuroRehabilitation, vol. 37, no. 1, pp. 3–10, 2015. [DOI] [PMC free article] [PubMed] [Google Scholar]
- [11].Del Din S, Godfrey A, Galna B, Lord S, and Rochester L, “Free-living gait characteristics in ageing and Parkinson’s disease: Impact of environment and ambulatory bout length,” J. Neuroeng. Rehabil, vol. 13, no. 1, pp. 1–12, 2016. [DOI] [PMC free article] [PubMed] [Google Scholar]
- [12].Mancini M et al. , “Continuous Monitoring of Turning Mobility and Its Association to Falls and Cognitive Function: A Pilot Study,” Journals Gerontol. - Ser. A Biol. Sci. Med. Sci, vol. 71, no. 8, pp. 1102–1108, 2016. [DOI] [PMC free article] [PubMed] [Google Scholar]
- [13].Bernad-Elazari H, Herman T, Mirelman A, Gazit E, Giladi N, and Hausdorff JM, “Objective characterization of daily living transitions in patients with Parkinson’s disease using a single body-fixed sensor,” J. Neurol, vol. 263, no. 8, pp. 1544–1551, 2016. [DOI] [PubMed] [Google Scholar]
- [14].De Lima ALS et al. , “Feasibility of large-scale deployment of multiple wearable sensors in Parkinson’s disease,” PLoS One, vol. 12, no. 12, pp. 1–15, 2017. [DOI] [PMC free article] [PubMed] [Google Scholar]
- [15].Adams JL et al. , “Multiple Wearable Sensors in Parkinson and Huntington Disease Individuals: A Pilot Study in Clinic and at Home,” Digit. Biomarkers, vol. 1, no. 1, pp. 52–63, 2017. [DOI] [PMC free article] [PubMed] [Google Scholar]
- [16].Lipsmeier F et al. , “Evaluation of smartphone-based testing to generate exploratory outcome measures in a phase 1 Parkinson’s disease clinical trial,” Mov. Disord, vol. 33, no. 8, pp. 1287–1297, 2018. [DOI] [PMC free article] [PubMed] [Google Scholar]
- [17].Arora S et al. , “Smartphone motor testing to distinguish idiopathic REM sleep behavior disorder, controls, and PD,” Neurology, vol. 91, no. 16, pp. e1528–e1538, 2018. [DOI] [PMC free article] [PubMed] [Google Scholar]
- [18].Zhan A et al. , “Using smartphones and machine learning to quantify Parkinson disease severity the mobile Parkinson disease score,” JAMA Neurol, vol. 75, no. 7, pp. 876–880, 2018. [DOI] [PMC free article] [PubMed] [Google Scholar]
- [19].Mancini M, Weiss A, Herman T, and Hausdorff JM, “Turn around freezing: Community-living turning behavior in people with Parkinson’s disease,” Front. Neurol, vol. 9, no. January, pp. 1–9, 2018. [DOI] [PMC free article] [PubMed] [Google Scholar]
- [20].Hale LA, Pal J, and Becker I, “Measuring Free-Living Physical Activity in Adults With and Without Neurologic Dysfunction With a Triaxial Accelerometer,” Arch. Phys. Med. Rehabil, vol. 89, no. 9, pp. 1765–1771, 2008. [DOI] [PubMed] [Google Scholar]
- [21].Chastin SFM, Baker K, Jones D, Burn D, Granat MH, and Rochester L, “The pattern of habitual sedentary behavior is different in advanced Parkinson’s disease,” Mov. Disord, vol. 25, no. 13, pp. 2114–2120, 2010. [DOI] [PubMed] [Google Scholar]
- [22].Weiss A, Sharifi S, Plotnik M, Van Vugt JPP, Giladi N, and Hausdorff JM, “Toward automated, at-home assessment of mobility among patients with Parkinson disease, using a body-worn accelerometer,” Neurorehabil. Neural Repair, vol. 25, no. 9, pp. 810–818, 2011. [DOI] [PubMed] [Google Scholar]
- [23].Cavanaugh JT, Ellis TD, Earhart GM, Ford MP, Foreman KB, and Dibble LE, “Capturing ambulatory activity decline in parkinson’s disease,” J. Neurol. Phys. Ther, vol. 36, no. 2, pp. 51–57, 2012. [DOI] [PMC free article] [PubMed] [Google Scholar]
- [24].Lord S, Godfrey A, Galna B, Mhiripiri D, Burn D, and Rochester L, “Ambulatory activity in incident Parkinson’s: More than meets the eye?,” J. Neurol, vol. 260, no. 12, pp. 2964–2972, 2013. [DOI] [PubMed] [Google Scholar]
- [25].Weiss A et al. , “Does the evaluation of gait quality during daily life provide insight into fall risk? A novel approach using 3-Day accelerometer recordings,” Neurorehabil. Neural Repair, vol. 27, no. 8, pp. 742–752, 2013. [DOI] [PubMed] [Google Scholar]
- [26].Weiss A, Herman T, Giladi N, and Hausdorff JM, “Objective assessment of fall risk in Parkinson’s disease using a body-fixed sensor worn for 3 days,” PLoS One, vol. 9, no. 5, 2014. [DOI] [PMC free article] [PubMed] [Google Scholar]
- [27].Benka Wallen M, Franzen E, Nero H, and Hagstromer M, “Levels and Patterns of Physical Activity and Sedentary Behavior in Elderly People With Mild to Moderate Parkinson Disease,” Phys. Ther, vol. 95, no. 8, pp. 1135–1141, 2015. [DOI] [PubMed] [Google Scholar]
- [28].Del Din S, Godfrey A, Mazzà C, Lord S, and Rochester L, “Free-living monitoring of Parkinson’s disease: Lessons from the field,” Mov. Disord, vol. 31, no. 9, pp. 1293–1313, 2016. [DOI] [PubMed] [Google Scholar]
- [29].Din D et al. , “Analysis of Free-Living Gait in Older Adults With and Without Parkinson ‘ s Disease and With and Without a History of Falls : Identifying Generic and Disease-Specific Characteristics,” vol. 74, no. 4, pp. 500–506, 2017. [DOI] [PMC free article] [PubMed] [Google Scholar]
- [30].Zampieri C, Salarian A, Carlson-Kuhta P, Aminian K, Nutt JG, and Horak FB, “The instrumented timed up and go test: Potential outcome measure for disease modifying therapies in Parkinson’s disease,” J. Neurol. Neurosurg. Psychiatry, vol. 81, no. 2, pp. 171–176, 2010. [DOI] [PMC free article] [PubMed] [Google Scholar]
- [31].Lord S, Galna B, Verghese J, Coleman S, Burn D, and Rochester L, “Independent Domains of Gait in Older Adults and Associated Motor and Nonmotor Attributes : Validation of a Factor Analysis Approach,” vol. 68, no. 7, pp. 820–827, 2013. [DOI] [PubMed] [Google Scholar]
- [32].Morris R, Hickey A, Del Din S, Godfrey A, Lord S, and Rochester L, “A model of free-living gait: A factor analysis in Parkinson’s disease,” Gait Posture, vol. 52, pp. 68–71, 2017. [DOI] [PubMed] [Google Scholar]
- [33].Maetzler W, Domingos J, Srulijes K, Ferreira JJ, and Bloem BR, “Quantitative wearable sensors for objective assessment of Parkinson’s disease,” Mov. Disord, vol. 28, no. 12, pp. 1628–1637, 2013. [DOI] [PubMed] [Google Scholar]
- [34].Kowal SL, Dall TM, Chakrabarti R, Storm MV, and Jain A, “Digital health revolution: is it time for affordable remote monitoring for Parkinson’s disease?,” Front. Neurol, vol. 6, no. 34, pp. 1–3, 2015. [DOI] [PMC free article] [PubMed] [Google Scholar]
- [35].Espay AJ et al. , “A Roadmap for Implementation of Patient-Centered Digital Outcome Measures in Parkinson’s disease Obtained Using Mobile Health Technologies,” Mov. Disord. Clin. Pract. (in Press, pp. 1–7, 2019. [DOI] [PMC free article] [PubMed] [Google Scholar]
- [36].Fischer JS, Rudick RA, Cutter GR, Reingold SC, Ms N, and Clinical S, “The Multiple Sclerosis Functional Composite measure (MSFC): an integrated approach to MS clinical outcome assessment,” pp. 244–250, 1999. [DOI] [PubMed] [Google Scholar]
- [37].Motl RW, Cohen JA, Benedict R, Phillips G, and Larocca N, “Validity of the timed 25-foot walk as an ambulatory performance outcome measure for multiple sclerosis,” pp. 704–710, 2017. [DOI] [PMC free article] [PubMed] [Google Scholar]
- [38].Kurtzke JF, “Rating neurologic impairment in multiple sclerosis : An expanded disability status scale (EDSS),” vol. 0, no. November, pp. 1444–1453, 1983. [DOI] [PubMed] [Google Scholar]
- [39].Collins CDE et al. , “A comparative analysis of Patient-Reported Expanded Disability Status Scale tools,” pp. 1349–1358, 2016. [DOI] [PMC free article] [PubMed] [Google Scholar]
- [40].Hobart JC, Riazi A, Lamping DL, Fitzpatrick R, and Thompson AJ, “Measuring the impact of MS on walking ability The 12-Item MS Walking Scale (MSWS-12),” 2003. [DOI] [PubMed] [Google Scholar]
- [41].Flachenecker P, Ku T, Kallmann B, Gottschalk M, Grauer O, and Rieckmann P, “Fatigue in multiple sclerosis : a comparison of different rating scales and correlation to clinical parameters,” no. February, pp. 523–526, 2002. [DOI] [PubMed] [Google Scholar]
- [42].Wan EA, Van Der Merwe R, and Rd NWW, “The Unscented Kalman Filter for Nonlinear Estimation,” Proc. IEEE 2000 Adapt. Syst. Signal Process. Commun. Control Symp. (Cat. No. 00EX373), pp. 153–158., 2000. [Google Scholar]
- [43].Van Der Merwe R and Wan E, “Sigma-Point Kalman Filters for Probabilistic Inference in Dynamic State-Space Models,” Oregon Health and Science University, 2004. [Google Scholar]
- [44].Fawcett T, “An introduction to ROC analysis,” Pattern Recognit. Lett, vol. 27, no. 8, pp. 861–874, 2006. [Google Scholar]
- [45].Turck N et al. , “pROC: an open-source package for R and S+ to analyze and compare ROC curves,” BMC Bioinformatics, vol. 8, pp. 12–77, 2011. [DOI] [PMC free article] [PubMed] [Google Scholar]
- [46].Prince F, Hkbert R, and Winter A, “Gait in the elderly,” Gait Posture, vol. 5, pp. 128–135, 1997. [Google Scholar]
- [47].Pirker W and Katzenschlager R, “Gait disorders in adults and the elderly,” pp. 81–95, 2017. [DOI] [PMC free article] [PubMed] [Google Scholar]
- [48].Giggins OM, Clay I, and Walsh L, “Physical Activity Monitoring in Patients with Neurological Disorders: A Review of Novel Body-Worn Devices,” Digit. Biomarkers, vol. 4, pp. 14–42, 2017. [DOI] [PMC free article] [PubMed] [Google Scholar]
- [49].Cavanaugh JT, Gappmaier VO, Dibble LE, and Gappmaier E, “Ambulatory Activity in Individuals With Multiple Sclerosis,” vol. 04103, pp. 26–33, 2011. [DOI] [PubMed] [Google Scholar]
- [50].Erin SM, Motl RW, and Gliottoni RC, “The effect of walking mobility on the measurement of physical activity using accelerometry in multiple sclerosis,” pp. 248–258, 2009. [DOI] [PubMed] [Google Scholar]
- [51].Leach JM, Mellone S, Palumbo P, Bandinelli S, and Chiari L, “Natural turn measures predict recurrent falls in community-dwelling older adults: A longitudinal cohort study,” Sci. Rep, vol. 8, no. 1, pp. 1–9, 2018. [DOI] [PMC free article] [PubMed] [Google Scholar]
- [52].Hausdorff JM, Cudkowicz ME, and Firtion R, “Gait Variability and Basal Ganglia Disorders : Stride-to-S tride Variations of Gait Cycle Timing in Parkinson ‘ s Disease and Huntington ‘ s Disease,” vol. 13, no. 3, pp. 428–437, 1998. [DOI] [PubMed] [Google Scholar]
- [53].Busse ME, Pearson OR, Van Deursen R, and Wiles CM, “Quantified measurement of activity provides insight into motor function and recovery in neurological disease,” pp. 884–888, 2004. [DOI] [PMC free article] [PubMed] [Google Scholar]
Associated Data
This section collects any data citations, data availability statements, or supplementary materials included in this article.