

Abstract
C - C chemokine receptor type 5 (CCR5) is thought to play a central role in orchestrating migration of cells in response to inflammation. CCR5 antagonists can reduce inflammatory disease processes which has led to an increased interest in using CCR5 antagonists in a wide range of inflammation-driven diseases. Paradoxically, these antagonists appear to function without negatively affecting host immunity at barrier sites. We reasoned that the resolution to this paradox may lie in the CCR5+ T cell populations that permanently reside in tissues. We used a single-cell analysis approach to examine the human CCR5+ T cell compartment in blood, healthy, and inflamed mucosal tissues to resolve these seemingly contradictory observations. We found that 65% of the tissue-resident (TRM) CD4 T cell compartment expressed CCR5. These CCR5+ TRM cells were enriched in and near the epithelial layer and not limited to TH1 type cells but also contained a large TH17-producing and a stable regulatory T (Treg) cell population. Importantly, the CCR5+ TRM compartment was stably maintained even in inflamed tissues including the preservation of TH17 and regulatory T cell populations. Further, using tissues from the CHARM-03 clinical trial we found that CCR5+ TRM are preserved in human mucosal tissue during treatment with the CCR5 antagonist Maraviroc. Our data suggest that the human CCR5+ TRM compartment is functionally and spatially equipped to maintain barrier immunity even in the absence of CCR5-mediated, de novo T cell recruitment from the periphery.
One sentence summary
Human CD69+CCR5+ T cells in mucosal tissues are poised to maintain barrier immunity in healthy and inflamed tissues.
Introduction
Tissue inflammation is associated with an influx of leukocytes (1) and CCR5-expressing cells are recruited to sites of inflammation by responding to the ligands CCL3, CCL4 and RANTES (2). CCR5 antagonists are of great therapeutic interest to interrupt immune cell trafficking. Clinical trials that have used CCR5 antagonists include studies to prevent graft versus host disease (GvHD) (3) and cancer metastasis (4), but clinical applications could extend to other inflammation-mediated diseases (5). The outcome of phase I/II clinical trials targeting GvHD appear promising (6, 7) and indicate that CCR5 antagonist treatment is an effective therapeutic intervention to prevent immune cell trafficking to sites of inflammation. The most frequently used CCR5 antagonist is Maraviroc, which is an FDA-approved drug to treat patients infected with CCR5-tropic HIV-1 in combination with other antiretroviral agents (8). Importantly, Maraviroc has seemingly little to no negative effects on host immunity in patients with HIV and is relatively well tolerated compared to other CCR5 antagonists whose use has been associated with hepatotoxicity (9). However, taken together these observations seem paradoxical since they suggest that CCR5 is on the one hand a critical mediator of immune cell trafficking to sites of inflammation and on the other hand dispensable for host barrier immunity. An additional layer of complexity is revealed from mouse model studies demonstrating that a lack of CCR5 expression could also lead to impaired resolution of inflammatory events (10). This is due to CCR5 guiding regulatory T cells (Treg) to sites of inflammation and subsequently controlling proximity to their CD4 and CD8 target cells in a CCR5-dependent manner by Treg secretion of CCL3 and CCL4 (10).
To provide an explanation for the surprising maintenance of barrier immunity in CCR5 antagonist-treated patients (11) we characterized the CCR5+ T cell compartment in human mucosal barrier tissue. We reasoned that a CCR5+ T cell population in human barrier tissue may be sufficient to maintain barrier immunity in the absence of incoming (CCR5 ligand-responding) T cells if this population is abundant in tissues and encompasses more functional breadth than the well-established TH1-driven responses (12, 13). Importantly, some T cells form a population of tissue-resident memory T cells (TRM) that remain in the tissue either permanently or for prolonged periods of time (1, 14–18). TRM in barrier tissues are considered to be important for maintaining the health of the tissue, including sustaining tolerance to commensals, while also mediating rapid responses to invading pathogens (18–21).
Given the promising yet seemingly paradoxical clinical results of CCR5 antagonist therapy, it is critical to understand the distribution and functional properties of CCR5+ T cells in barrier tissues. We developed an analysis pipeline that allowed us to define the phenotype, function, and location of CD4 T cell populations in healthy and inflamed human mucosal tissue. Our study was also designed to assess changes across a spectrum of inflammation, reflecting the typical processes of human mucosal tissues where inflammation is rarely an on/off switch. To define the function of the CCR5+ T cell compartment in healthy and inflamed tissues we focused on examining oral mucosal tissues, which offered the unique opportunity to examine how human T cell subsets, especially those with prolonged tissue longevity, were affected by gradations of inflammation (in the absence of drug treatment) since inflammatory processes in the oral mucosa are regularly induced (22–25). We also examined tissue-resident T cells following CCR5 antagonism.
Results
CD4 and CD8 CD69+ cells are abundant in healthy oral mucosal tissue
We first broadly characterized CD8 and CD4 T cells in blood and healthy mucosal tissue of humans obtained from routine periodontic surgeries (Fig. 1A). We chose to use oral mucosal tissue, because this mucosal barrier tissue is readily available in both healthy and inflamed states in the absence of drug treatment that would interfere with inflammatory processes from patients undergoing routine oral surgery. To assess the health status of the samples, blinded scoring was performed on H&E slides by a pathologist (score of 1 to 5) and scores 1–2 were included in healthy analysis (fig. S1 and table S1). In contrast to the donor-matched blood, almost all T cells in the mucosa had an effector memory (TEM) cell phenotype (CD45RA−CCR7−) (Fig. 1A). We next examined markers indicative of transient versus tissue-resident T cell (TRM) subsets. TRM are often defined by expression of the biomarkers CD69 and/or CD103, each thought to have a unique contribution towards establishing residency and displaying different expression patterns in human non-lymphoid tissues (16). Similarly to what has been reported for other human non-lymphoid tissues (15), CD8 T cells expressed CD69 and CD103 in the oral mucosa (Fig. 1A and 1B). Using matched blood as a gating reference, we found that half of the CD4 T cells in healthy oral mucosa were CD69+ and a portion were CD103+, with very few of either population in the blood (Fig. 1A and 1C). The CD103+CD69+ population for both CD4 and CD8 T cells was exclusively found in the mucosa, but not blood (Fig. 1B and 1C). We found that PD-1 was highly expressed on mucosal CD69+ cells (Fig. S2A) and all CD4 T cells in the tissue had higher expression of CTLA4 than those in the blood (Fig. S2B). Further, in 89% of patients, CTLA4 expression was higher on the CD69+ population compared to the CD69− population (mucosal Treg shown for comparison). We also determined the tissue localization of the CD103 (Fig. S2C and S2E) and CD69 (Fig. S2D and S2E) CD4 T cell subsets by immunofluorescence (IF) and found that neither were associated with preferred localization in the tissue. To determine spatial localization and assess cell subset recovery from the tissue digestion process (26), we combined IF staining with a digital pathology (IFDP, indicated by blue graphs in figures) analysis approach to increase the number of cells that can be analyzed and remove any subjective bias when enumerating cells. Specifically, we quantified cells in three relevant compartments: epithelium, sub-epithelium (300μm area below the epithelium) and stroma (Fig. 1D). The sub-epithelial layer was defined after initial analysis indicated an enrichment of T cells in this area. For each donor, 176–14,734 CD4 T cells (mean = 2,102) and 23,379–210,390 nucleated cells (mean = 70,926) were quantified.
Figure 1. CD4 and CD8 TRM are abundant in healthy oral mucosal tissue.

Human gingival tissue was obtained from routine oral surgeries. A piece of each tissue was saved for histology, including evaluation by a pathologist (scoring criteria are listed in the Material and Methods). The remaining tissue was processed for flow cytometry (A) Gating strategy for CD8 and CD4 T cells (center) in blood (top panel) and mucosa (bottom panel). Memory (CCR7 and CD45RA) and tissue resident (CD69 and CD103) phenotype of CD8 T cells (left) and CD4 Tconv cells (right). Numbers indicate percentages of the parent population. Percent of CD69+CD103− (orange), CD69+CD103+ (blue), CD69−CD103+ (pink) and CD69−CD103− (green) on (B) CD8 T cells and (C) CD4 T cells across n=healthy tissues from 14 donors. Error bars show standard deviation from the mean. (D) Mucosal tissue with DAPI (white) staining depicting how epithelium (Epi), sub-epithelium (SE) and stroma compartments were drawn in HALO. (E) Representative healthy tissue stained with CD4 (red), CD8 (green) and DAPI (blue). Dotted line indicates the epithelial boundary. (F) IFDP analysis ratio of CD4 to CD8 T cells across the tissue compartments, n=healthy tissues from 10 donors. **p≤0.01 generated by repeated measures one-way ANOVA with Tukey’s post-test
We next examined the overall distribution of CD4 and CD8 T cells (Fig. 1E). In healthy oral mucosa we found a 1:1 ratio of CD4 and CD8 T cells in the epithelium whereas this ratio averaged 3:1 and 2:1 in the sub-epithelium and stroma, respectively (Fig. 1F). We also assessed CD4 and CD8 T cells as a percent of nucleated cells, a measurement indicative of the density of cells they would be surveying. By this metric, CD4 and CD8 T cells made up 6% and 2.7%, respectively, of nucleated cells in the sub-epithelium compared to the epithelium where they averaged 0.98% and 0.77% (Fig. S3). It is noteworthy that the nuclei per mm2 density is higher in the epithelial compartment (Fig. S3). Thus, CD4 T cells are most abundant in a 300μm area below the epithelium.
CCR5 is expressed on resident and transient CD4 Tconv and Treg populations in healthy oral mucosa
We next wanted to specifically focus on defining the CCR5+ CD4 T cell population given the critical role of CD4 T cells in maintaining barrier immunity (21). In healthy tissues, CCR5 was expressed by ~65% of the CD4 TRM cells (Fig. 2A and 2B). The CCR5+CD69+ population made up about a third of the total CD4 T cell population (Fig. 2C) and could be readily identified by IF (Fig. 2D). Given that Treg are necessary to maintain tissue homeostasis and orchestrate effector function (27), we next defined their abundance and phenotype. Identification of Treg in humans is confounded by the fact that Foxp3 and other identifying markers can also be expressed by activated effector T cells (28). We chose a stringent previously described gating method (28) to minimize the possibility of misclassifying recently activated CD4 T cells as Treg in tissues. This strategy isolated the most suppressive and highest CD25-expressing cells using CD45RA expression as a reference after first gating out CD127+ cells (Fig. 2E). The conservative gating strategy yielded a lower frequency of Treg (as a % of CD4 T cells, Fig. 2E and 2G) in the blood compared to the typically used gating schemes. Mucosal Treg had increased Foxp3 and CTLA4 expression compared to those in the circulation (Fig. 2F). Of note, both of these markers were also higher on the Tconv population in the tissue compared to blood. Treg cells were more prevalent in the tissue compared to the blood (Fig. 2G) and expressed TRM markers CD69 and to a lesser extent CD103 (Fig. 2H). Importantly, Treg also displayed a pattern of CCR5 expression (Fig. 2I) similar to the Tconv population (Fig. 2B) across blood and tissue subsets.
Figure 2. CCR5 is highly expressed by CD4 Tconv and Treg in healthy oral mucosa.

(A) Representative flow plots of CCR5 and CD69 expression on CD4 Tconv cells from the blood and healthy mucosa. (B) Quantification of CCR5 expression on CD69+ and CD69− populations, numbers indicate the mean percent for each population (n=17 donors). (C) CCR5+CD69+ percent of CD4 Tconv cells in healthy mucosa (n=17). (D) Representative image from a healthy tissue showing CD4 (red), CD69 (blue) and CCR5 (green) staining. Detailed set of four images show combined and individual staining of cells from white box with DAPI (gray). Arrows indicate all triple positive cells. (E) Gating strategy for Treg in blood (top) and mucosa (bottom). Numbers indicate percentage of the parent population. (F) Representative histograms depicting Foxp3 (top) and CTLA4 (bottom) expression on CD25neg/lo (blue) and CD25hi Treg (red) in the blood (filled) and mucosa (open). (G) Percent Treg of CD4 T cells in blood and mucosa (n=9 donors). (H) Proportion of CD69+CD103− (orange), CD69+CD103+ (blue), CD69−CD103+ (pink) and CD69−CD103− (green) in Treg cells from blood and mucosa, n=9 donors. Error bars show standard deviation from the mean. (I) Expression of CCR5 on Treg from the blood and healthy mucosa. Numbers indicate the mean percent for each population (n=9 donors). *p<0.05, **p≤0.01, ***p≤0.001, ****p≤0.0001 generated with paired t test.
Inflammation drives spatially-dependent changes in T cell subsets
We next wanted to determine the effect of inflammation on the CCR5+ CD4 T cell compartment to understand if functionality and subset distribution are altered. Inflammation involves changes in vasculature, secretion of inflammatory mediators and cellular infiltrate (29) that together alter tissue architecture and the local immune network (30). As expected, large T cell clusters were readily apparent in the stroma of inflamed tissues (score 3–5, Fig. 3A). IFDP analysis revealed that overall CD4 T cell numbers (as a proportion of nucleated cells) were not markedly changed in the epithelium with worsening inflammation while increasing significantly in the sub-epithelium (p=0.005) and stroma (p=0.001, Fig. 3B). The proportion of CD69+ CD4 T cells was preserved with increasing inflammation by both flow and IFDP analysis (Fig. 3C and 3D). We found a significant decrease in the proportion of CD103+ CD4 cells by flow cytometry (p=0.012, Fig. S4A) and IFDP analysis revealed that this was occurring in the sub-epithelium (p=0.040); there were no statistically significant differences in the stroma (Fig. S4B). The same results were found for CD8 T cells to an even greater degree (Fig. S4C and S4D).
Figure 3. Inflammation is associated with an increase in CD69+ and CD69− CD4 T cells in distinct tissue compartments.
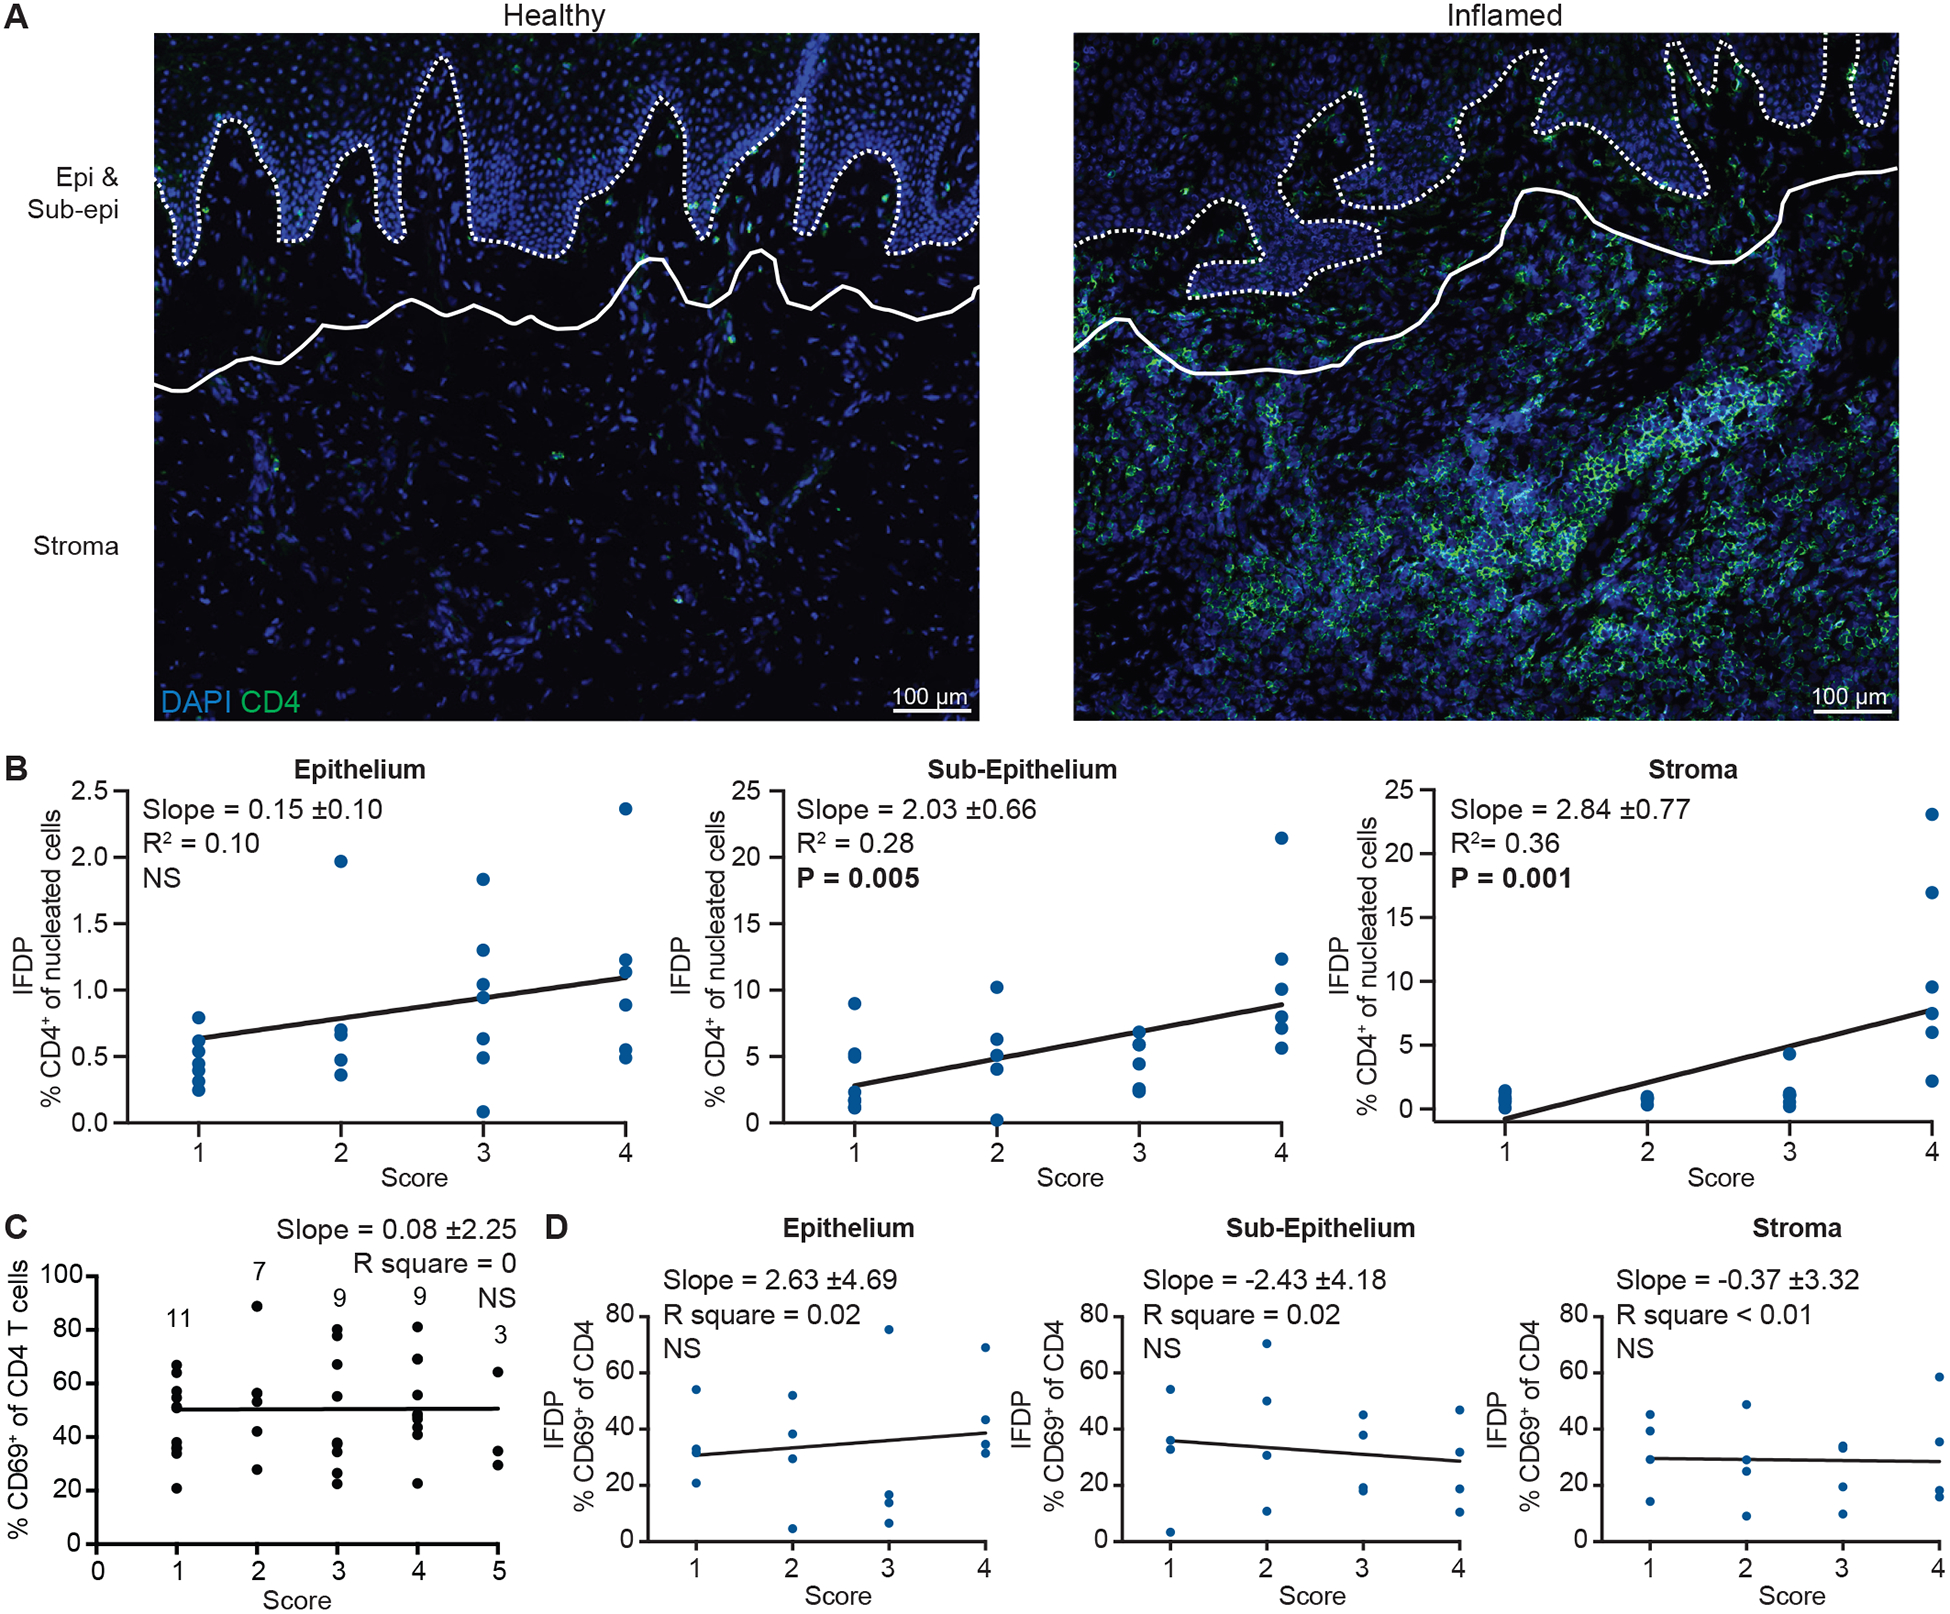
(A) CD4 (green) T cells in healthy (left) and inflamed (right) representative oral mucosa tissues with DAPI (blue). Dotted line indicates the base of the epithelium and solid line marks the divide between sub-epithelium and stroma compartments. (B) IFDP quantification of CD4 T cells in the epithelium (left), sub-epithelium (middle) and stroma (right) stratified by inflammation score. n=5–7 donors/score (total n=23 donors analyzed). (C) Flow data of CD69+ percent of CD4 T cells stratified by inflammation. Numbers indicate how many tissues were analyzed for each score. (D) IFDP quantification of CD69+ percent of CD4 T cells stratified by inflammation for each compartment, n=4 donors/score. Slope, R2 and P value for slope indicated on each graph generated with linear regression. Black graph indicates flow cytometry and blue graphs indicate IFDP analysis.
In inflamed tissues, the pattern of CCR5 expression across blood and tissue compartments was maintained on CD4 T cells (Fig. 4A) and we observed no changes in the overall proportion of CCR5-expressing CD4 T cells with increasing inflammation by flow cytometry (Fig. 4B). However, IFDP analysis revealed that the proportion of CCR5+ CD4 T cells increased with worsening inflammation, specifically in the sub-epithelium (and considerably in the stroma) (Fig. 4C and 4D), which is also where the majority of the increase in CD4 T cell numbers occurred. Of note, the proportion of CCR5+ CD4 T cells detected by IF was uniformly lower compared to flow cytometry (Fig. 4A and 4B versus 4D), which most likely can be attributed to the fact that flow cytometry captures the full range of CCR5 expression and parameters set for HALO analysis exclude the lower range of expression (to distinguish from background signal). Finally, we wanted to determine if inflammation status affected the frequency of the CCR5+CD69+ population. Inflammation did not significantly increase in the proportion of CCR5+CD69+ CD4 T cells below the epithelium (sub-epithelium p=0.07 and stroma p=0.20, Fig. S4E). Importantly, we observed that the proportion of Treg cells was maintained regardless of inflammation status (Fig. 4E). Treg cells reflected the same patterns as the CD4 Tconv cells in regard to CCR5 expression across blood and tissue subsets (Fig. 4F) as well as the CD103 and CD69 populations (Fig. S4F and S4G).
Figure 4. CCR5 is expressed on resident and transient CD4 Tconv and Treg populations in inflamed oral mucosa.
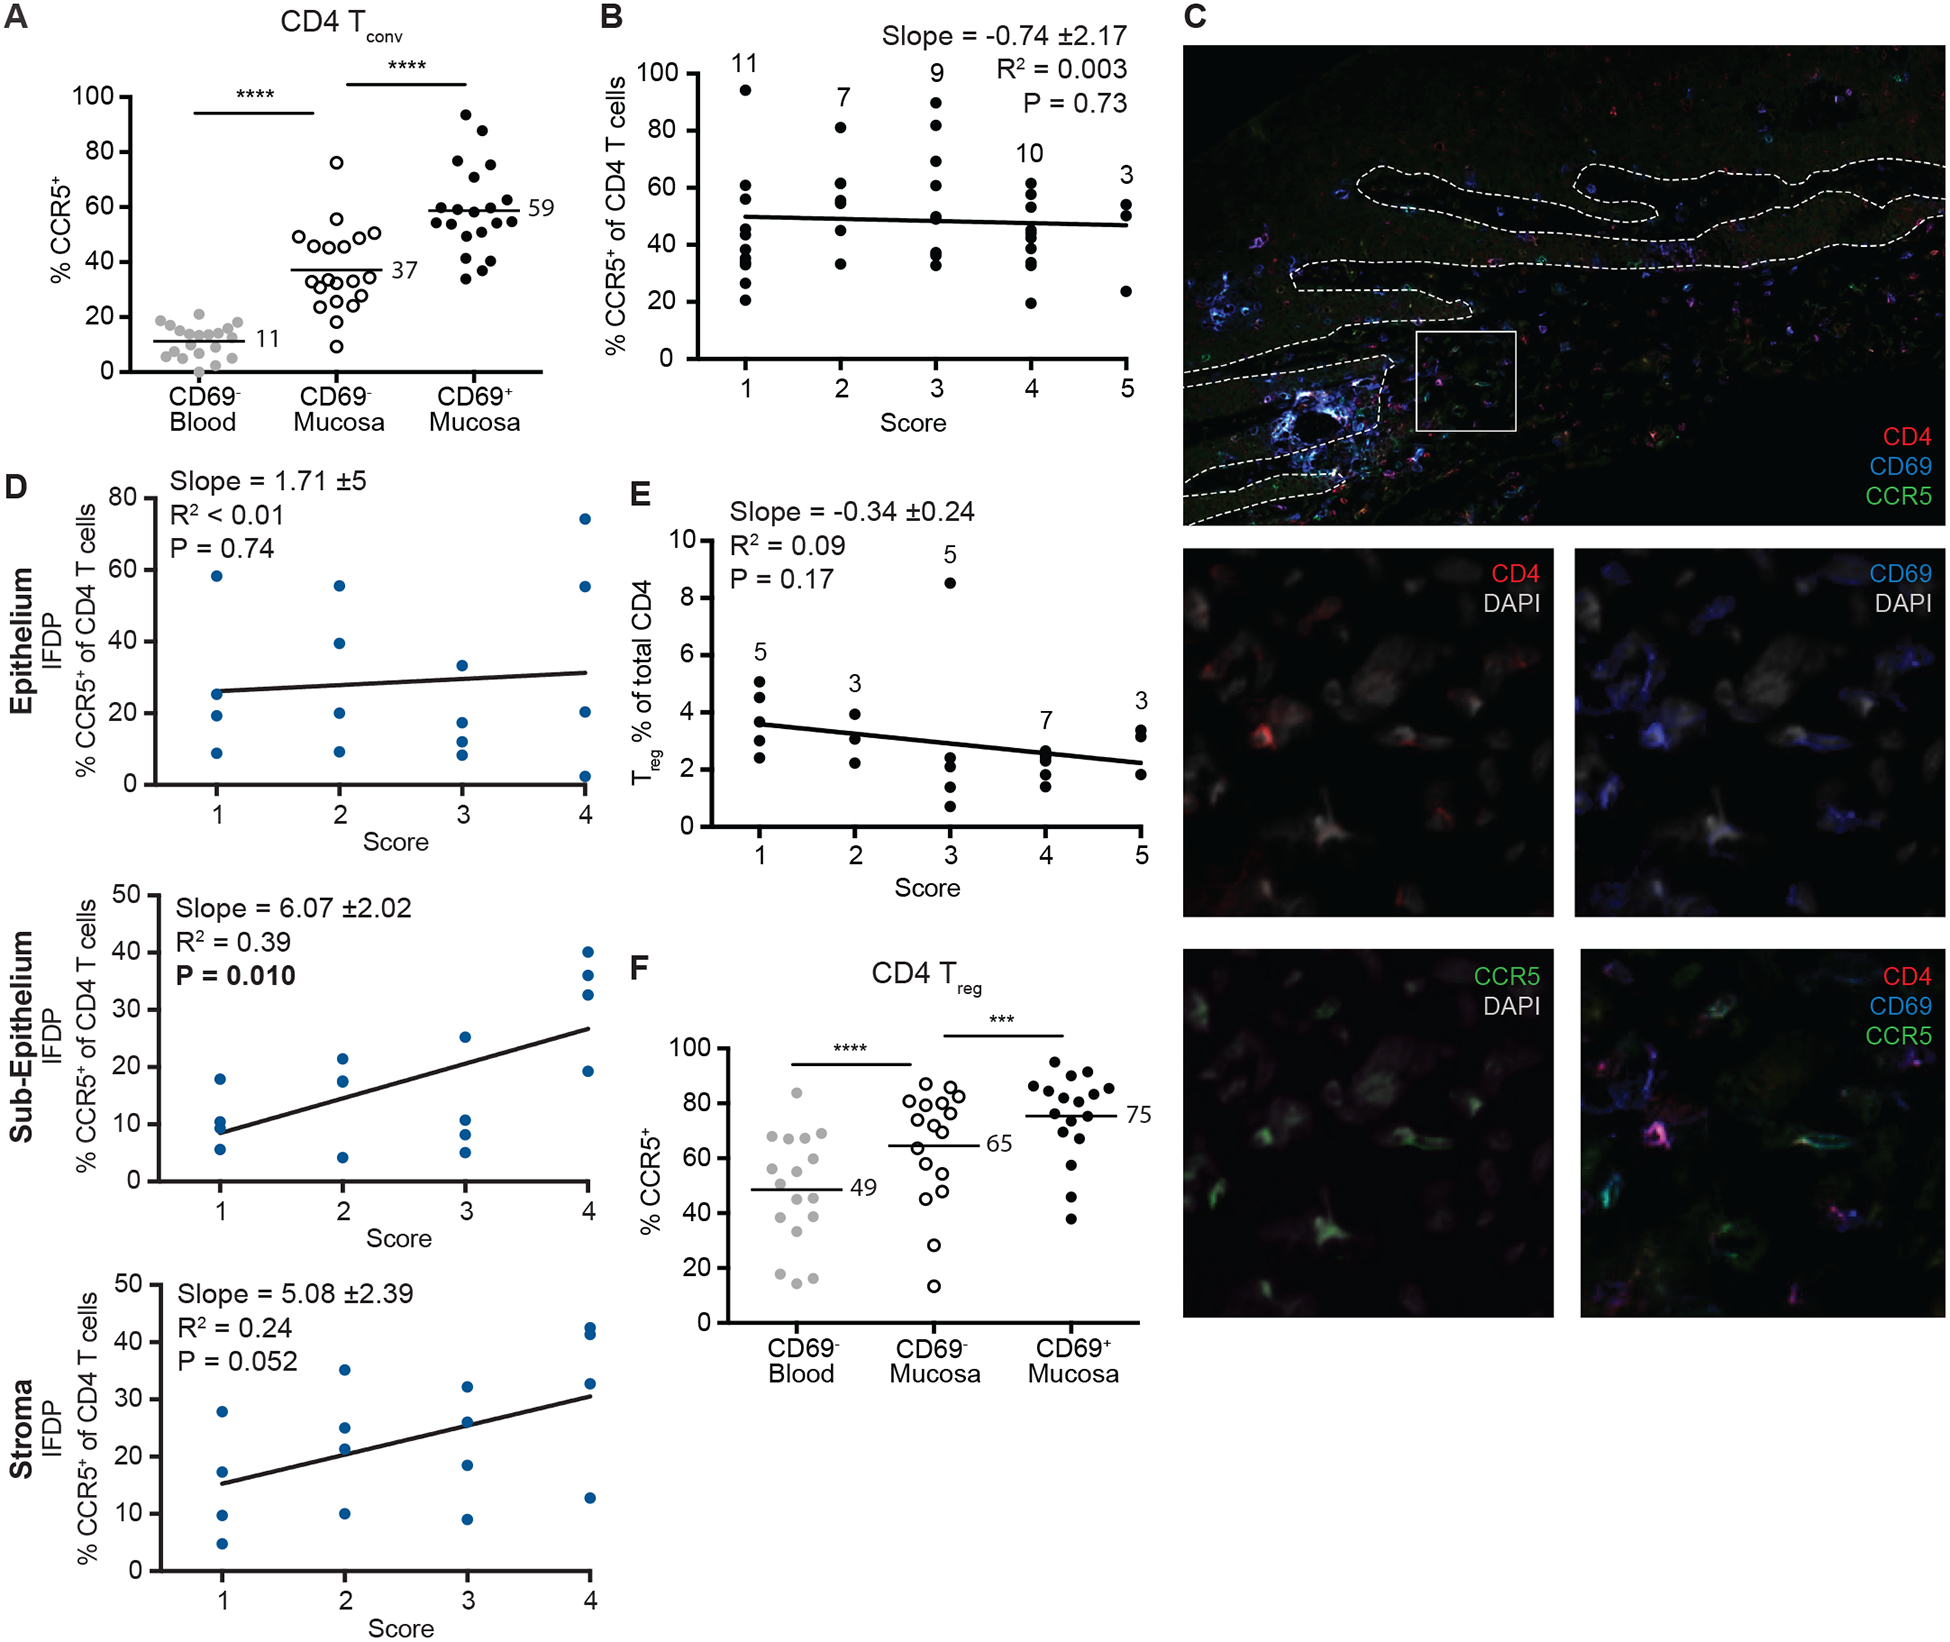
(A) Expression of CCR5 on CD4 Tconv cells from the blood and inflamed mucosa determined by flow cytometry. Numbers indicate the mean percent for each population (n=20). (B) Flow cytometry data depicting CCR5+ percent of CD4 T cells stratified by inflammation score. Numbers indicate how many tissues were analyzed for each score. (C) Representative image from a healthy tissue showing CD4 (red), CD69 (blue) and CCR5 (green) staining. Detailed set of four images show combined and individual staining of cells from white box with DAPI (gray). Arrows indicate all triple positive cells. Dotted line indicates the epithelial boundary. (D) IFDP quantification of CD4 T cells expressing CCR5 in the epithelium (left), sub-epithelium (middle) and stroma (right) stratified by inflammation with n=4 per score. (E) Treg percent of CD4 T cells stratified by inflammation. Numbers indicate how many tissues were analyzed for each score. (F) Expression of CCR5 on CD4 Treg cells from the blood and inflamed mucosa determined by flow cytometry. Numbers indicate the mean percent for each population (n=17). (A) & (F) ***p≤0.001, ****p≤0.0001 generated with paired t test. (B), (D) & (E) Slope, R2 and P value for slope indicated on each graph generated with linear regression. Black graphs indicate flow cytometry and blue graphs indicate IFDP analysis.
CCR5+CD69+ CD4 T cells in the mucosa share a universal TRM transcriptome signature and have a TH17 profile
To define the transcriptional breadth of CCR5-expressing CD4 T cells, we examined several CD4 T cell subsets by bulk RNA sequencing (RNA-seq). From 10 individuals (with varying degrees of tissue inflammation) three CD4 T cell populations were sorted: blood CCR5+CD69−, mucosa CCR5+CD69+ and mucosa CCR5+CD69− (Fig. 5A). We first stratified all mucosa samples by inflammation score, treating it as a continuous variable, and found that inflammation had a very modest effect on CCR5+ T cell transcriptomes. Even with a non-stringent false discovery rate (FDR) of 0.25, only 14 genes were differentially expressed (DE) (Fig. 5B). Therefore, although a clear pattern of transcriptional changes is apparent, the functional potential of CD4 T cells in the tissue is remarkably stable in the presence of increasing inflammation. In contrast, a large number of DE genes were found between cells in the circulation compared to both CD69− and CD69+ cells in the oral mucosa (913 DE genes with FDR < 0.05, expression fold-change ≥ 2) (Fig. 5C and Table S2). A Search Tool for Retrieval of Interacting Genes/Proteins (STRING) network analysis (31) within these differentially expressed genes revealed that tissue occupancy was associated with an increased functional specialization that included both effector and regulatory genes (Fig. S5A). Our findings indicate that entry into the tissue, independent of CD69 expression, has a more profound impact on the transcriptional profile of CD4 T cells than inflammation status.
Figure 5. Tissue localization imparts a distinct gene expression profile on CCR5-expressing CD4 T cells.

(A) Sorting scheme for CD4 T cells from blood (CCR5+CD69− red) and oral mucosa (CCR5+CD69+ orange, CCR5+CD69− teal) for RNAseq experiments. (B) Gene expression heatmap of genes differentially expressed with inflammation score (FDR < 0.25). Grayscale and numbers indicate inflammation score. (C) Gene expression heatmap genes differentially expressed between blood and oral mucosa (FDR < 0.05 and expression fold-change ≥ 2). Letters designate individual donors; colors for sample origin correspond to those in (A). (D) Gene set enrichment analysis (GSEA) for the “TRM Core Signature” gene set in our oral mucosa CD69+ samples vs. CD69− samples. The Y-axis is the enrichment score and the X-axis is genes ranked according to the absolute value of log fold change between the mucosa CD69+ and CD69− samples. p < 0.001 for TRM Core Signature enrichment. (E) Volcano plot showing genes upregulated in CD69− (teal) and CD69+ (orange) CD4 T cells from the oral mucosa. Highly significant genes associated with a TH17 signature denoted. Dotted lines show FDR=0.05 (horizontal) and fold change = +/−2 (vertical).
We next performed gene set enrichment analysis (GSEA) (32) to compare our CCR5+CD69+ population with previously defined TRM populations (33). For this analysis, we ranked genes according to the absolute values of expression log fold changes between the tissue CCR5+CD69+ and tissue CCR5+CD69− samples. Sample label permutations were used to assess significance. GSEA revealed enrichment of the TRM Core Signature in the genes differentially expressed in mucosa CCR5+CD69+ CD4 T cells (p <0.001; Fig. 5D), indicating strong similarity to other human Trm populations. To extend the generality of this comparison beyond human CD4 T cells, we also performed GSEA with a well-defined murine CD8 T cell gene signature (34) and obtained a p value of 0.04 (Fig. S5B). This suggests a trend towards enrichment even in the context of a different species and cell type. Therefore, in line with recent literature (35–38) and since the mucosal CCR5+CD69+ CD4 T cell population maintains a signature indicative of tissue residency, we will refer to these CD69+ simply as TRM cells, although it is important to note that CD69 expression requires careful interpretation due to its transient expression on the cell surface of recently activated T cells. Given their divergent transcriptional profiles, we wanted to define potential functional differences between these tissue-resident and tissue-transient populations. Comparing the TRM with the CD69− tissue population, there were 19 DE genes (FDR <0.05, fold-change in expression ≥ 2) (Fig. 5E). A striking difference between the transcriptional profile of the two oral mucosal populations was the expression of IL17F, IL17A, IL26, and aryl hydrocarbon receptor (AhR), which suggest an enhanced TH17 signature in the TRM population (Fig. 5E). We did not detect differentially expressed genes indicative of recent activation or exhaustion/dysfunction, indicating that CD69 protein expression is mainly due to tissue residence and likely not driven by other events.
TH17 CD4 T cells with a TRM signature are a distinct subset within the mucosa CCR5+CD69+ population
To address whether TH17 and TRM transcriptional profiles could be simultaneously detected in individual cells we used 10X Genomics for single-cell RNA sequencing (scRNA-seq). We sorted six defined populations from the blood and mucosa of a single donor (pathology score 4 with some healthy as well as markedly inflamed areas). This nested sort approach retained marker information ensuring that we could link the transcriptional signatures back to previously defined subsets. Three of the populations matched those sorted for bulk RNA-seq (denoted with a *), with the other populations providing reference datasets: Blood Total CD4+, *Blood CCR5+CD69−, Mucosa CCR5+, Mucosa CCR5−, *Mucosa CCR5+CD69+ and *Mucosa CCR5+CD69− (sort strategy and sorted cell numbers are listed in Fig. S6A).
Visualization of the single-cell transcriptome data using t-distributed stochastic neighbor embedding (tSNE) plots (Fig. 6A) and differential expression between the nonoverlapping populations (Blood CCR5+CD69−, Mucosa CCR5−, Mucosa CCR5+CD69+, and Mucosa CCR5+CD69−) confirmed that localization to the tissue had a profound impact on CD4 T cell transcriptional profiles (Fig. 6B). Importantly, CCR5 expression imparted a distinct transcriptional profile in the tissue (Table S5), as CCR5+ T cells had higher expression of genes related to effector function and migration reflecting the diverse functional potential in this population (TH1, TH17 and Treg). This further illustrates the importance of focusing on a specific inflammatory-responsive CD4 T cell subset when comparing blood and tissue.
Figure 6. TH17 CD4 T cells with a TRM signature are a distinct subset within the tissue CCR5+CD69+ tissue population.

(A) tSNE plot of the single-cell RNA-seq data from 6 blood and oral mucosa subsets, each assigned a unique color: Blood Total CD4 (purple), Blood CD4 CCR5+CD69− (red), Mucosa CD4 CCR5− (green), Mucosa CD4 CCR5+ (blue), Mucosa CD4 CCR5+CD69− (teal) and Mucosa CD4 CCR5+CD69+ (orange). Asterisks indicate samples that correspond to bulk sorted populations from previous experiments. (B) Heatmap of the differentially expressed genes defining each population (FDR < 0.01). (C) Mean expression of TH17 and TRM Core Signature (only using genes up in CD69+ cells in the “TRM Core Signature”) gene sets in individual CD4 T cells from blood CCR5+CD69− (left) and mucosa CCR5+CD69− (middle) and CCR5+CD69+ (right). Cells were sorted from a single donor.
We next asked whether blood CCR5+CD69−, Mucosa CCR5+CD69− and Mucosa CCR5+CD69+ cells co-expressed genes from the TRM Core Signature, indicative of TRM, and a TH17 signature (gene signature list is in Table S3). The mean gene set expression of each signature revealed individual cells expressing both signatures specifically within the CCR5+CD69+ population, but not in the CCR5+CD69− populations (blood or mucosa) expressing both signatures (Fig. 6C). We confirmed that these signatures are not a transcript abundance-related artifact due to capture of multiple cells, as across the three samples, the cells co-expressing these signatures do not show an unusually high number of unique molecular identifiers (UMIs) per cell (UMIs) per cell (Fig. S6B).
CD4 TRM in inflamed tissue respond rapidly to TCR stimulation ex vivo to produce cytokines
Since we had seen by both bulk and single-cell RNA-seq a strong TH17 signature in the CCR5+ CD4 TRM population, we wanted to determine whether this actually resulted in enhanced IL-17 protein production. We therefore chose short re-stimulation assays (minimizing possible indirect effects from longer culture(39)) to determine the direct ex vivo TCR-responsiveness of blood and mucosal CD4 T cells. Activating cells for 6 hours was brief enough to avoid substantially changing the percent of CD69+ cells, however, it altered CCR5 expression as previously reported (40). The stimulation experiments echoed the transcriptional data as a higher percent of the oral mucosa CD69+ population (that typically consists of ~65% CCR5+ T cells, Fig. 2B) produced IL-17A/F than the CD69− population (Fig. 7A and 7B). In contrast, IFNg expression was increased in both oral mucosa populations compared to blood, regardless of CD69 expression (Fig. 7A and 7C), also mirroring the transcriptional data (Fig. S7A). Similar results were obtained following PMA/Ionomycin re-stimulation, with overall increased cytokine production (Fig. S7B). Thus, the data strongly suggest the existence of a CCR5+CD69+ CD4 T cell population with TH17 properties that is found predominantly in this tissue-resident population.
Figure 7. CD4 TRM in human oral mucosa rapidly produce inflammatory cytokines.

(A) Blood and mucosa CD4 T cell production of IL-17A/F and IFNγ following 6 hours without stimulation or TCR stimulation (anti-CD3/CD28 beads) from a single donor. Mucosa stimulation data shown for CD69− (left) and CD69+ (right) populations. (B) IL-17A/F and (C) IFNγ production from n=12 donors. *p<0.05 **p≤0.01 generated with paired t test.
CCR5+ CD4 TRM are stably maintained during treatment with the CCR5 antagonist Maraviroc
We next wanted to directly test if the CCR5+ CD4 T cell population is maintained in mucosal tissue during treatment with Maraviroc, a CCR5 antagonist. To address this question a healthy study cohort is needed with available tissue biopsies pre- and post-treatment in a well-defined time-span. The CHARM-03 clinical trial met all these criteria and included an elegant cross-over study design that even allowed us to compare effects of oral versus topical Maraviroc treatment for one week (with a washout period between the treatment arms) (Fig. 8A and Materials and Methods). To determine if the CD4 T cell compartment changes following oral (systemic) or topical (rectal) Maraviroc treatment, we examined rectal biopsies taken pre- and post-treatment by flow cytometry and IF.
Figure 8. CCR5+ CD4 TRM are stably maintained in human rectal mucosa during treatment with the CCR5 antagonist Maraviroc.

(A) Diagram of sample collection for rectal biopsies used from the CHARM-03 study. (B) Representative flow plots showing CD69 and CCR5 expression on Live, CD3+CD4+ T cells. Numbers indicate percent of parent population. (C) Proportions of CCR5+CD69+ (dark orange), CCR5−CD69+ (light orange), CCR5+CD69− (teal) and CCR5−CD69− (gray) as a percent of CD4 T cells. (D) Representative immunofluorescence images of CD4 (red) and CCR5 (green) from a male donor at pre-treatment (left), after oral Maraviroc (center) and after topical Maraviroc (right). N=5 male and N=5 female participants.
The frequency of the CCR5+CD69+ population among CD4 T cells was comparable between oral and rectal mucosa (Fig. 2A, C and Fig. 8B, C), however CCR5 expression is minimal in the rectal mucosal CD69− population (Fig. 8B). Importantly, the CCR5+ TRM population remained stable with either oral or topical treatment (Fig. 8C). To help interpret these data, we also assessed the frequency of CD3+ cells (% of total lymphocytes) and the frequency of CD4+ cells (% of total CD3+ cells) and did not observe significant changes with treatment (Control vs. Oral Tx p=0.78, Control vs. Topical Tx p=0.90, Fig. S8A). We did however find alterations in the frequency of CCR5 expression on the CD69− population that resulted in a significant increase in the proportion of CD69−CCR5+ (Control vs. Oral Tx p=0.0008, Control vs. Topical Tx p=0.0035, Fig. S8B), which has been observed previously (41) and further confirmed that the treatment was working as expected. To complement the flow cytometry data, we examined whether Maraviroc treatment caused changes in the spatial distribution of CD4 T cells in the tissue. These tissue biopsies were taken with large-cup biopsy forceps and thus the orientation of these sections was different compared to our other IF images (Fig. S8C). In the acquired epithelial layer, we observed heterogeneity in the overall CD4 T cell distribution regardless of treatment status and readily detected clusters of CD4 T cells expressing CCR5 pre- and post-treatment (Fig. 8D). Likely due to the different initial processing of these tissues we were unable to simultaneously stain for CD69, CCR5, and CD4. We therefore decided to stain for CCR5 and CD4, since CCR5+ CD4 T cells were almost all found within the CD69+ fraction by flow cytometry. Together, the flow cytometry and IF data suggest that a stable population of CCR5+ CD4 TRM is maintained in human mucosal tissue capable in the absence of CCR5-directed recruitment.
Discussion
[]CCR5 is largely accepted as a unique biomarker of TH1 in the literature since a 1998 landmark study by Loetscher and colleagues (12). Here we report that CCR5 expression is not exclusive to the TH1 population in human mucosal tissue but is in fact also expressed by TH17 and Treg cells with a TRM phenotype (CD69+). Our data also demonstrate that the CCR5+CD69+ CD4 T cell population does not undergo substantial transcriptome changes in healthy compared to inflamed tissues, while the population increases in size. Further, CCR5+ T cells have classically been characterized as responding to inflammation, whereas we demonstrate that this population is in fact part of the immune network in healthy barrier tissues. Together, these data suggest that CCR5+ CD4 TRM cells are stably maintained as a population across healthy and inflamed tissues and also maintain their functional properties.
Here we discuss the main conceptual advances from our study in context of their implications for CCR5 antagonist treatment strategies. Overall, we found that the CCR5+ CD4 TRM population was abundant and distributed throughout the tissue. Specifically, we found that there are areas of the tissue where (combining CD4 and CD8 T cells) on average 9% of all nucleated cells are T cells. CCR5 was expressed by ~65% of CD4 T cells with a TRM (CD69+) and about 35% of CD4 T cells with a transient (CD69−) phenotype in healthy human oral mucosal tissues. If the half-life of the human TRM cells is comparable to that of circulating human memory T cells (estimated half-life of 8–15 years (42)), then barrier immunity and homeostasis could be maintained for decades without impairment during treatment. Although the maintenance of barrier immunity is encouraging in this clinical context, it also suggests that it is most likely futile to use a CCR5 antagonist treatment strategy in an effort to interfere with inflammatory responses in tissues with an intact, functional TRM compartment, as has been suggested for some inflammatory diseases (5).
Our data also demonstrate that the CCR5+ CD4 TRM compartment displayed previously unappreciated functional breadth encompassing TH1, TH17, and Treg subsets. Specifically, when we compared (CD69+) TRM and (CD69−) migratory CCR5+ CD4 T cell populations to elucidate potential functional differences (extrapolated from transcriptional data), we found that the TRM population had a striking TH17 transcriptional signature. Further, the CD4 TRM population as a whole displayed rapid IL-17 production in response to TCR re-stimulation. We used a scRNA-seq approach to determine whether there was a mixed population or if an individual cell can have both a TRM and a TH17 signature within the CCR5+CD69+ CD4 T cell compartment. Importantly, our scRNA-seq data demonstrate that TRM and TH17 signatures were expressed by the same cells, which were almost exclusively found within the CCR5+CD69+ population, indicating that TH17 TRM cells exist within the CCR5+ compartment. Of note, given that this scRNA-seq method may not capture scarcely expressed transcripts, it might underestimate the prevalence of this population and is thus not suitable to quantify the exact abundance of TRM TH17 cells. However, these data demonstrate that such a TH17 population exists in the CCR5+ tissue-resident population and is at best scarce in the transient population. These data reveal that the typical association of CCR5+ CD4 T cells solely promoting TH1 responses (12, 13) does not hold true for human barrier tissues.
Data presented here from the CHARM-03 clinical trial indicated that the CCR5+ CD4 TRM compartment was stably maintained in the tissue even during treatment with the CCR5 antagonist Maraviroc. We reasoned that a treatment period of 1 week would be sufficient to detect changes in the CCR5+ population given that migrating memory T cells are able to rapidly enter tissues and affect local memory composition (43). In support of this, we did observe an increase in the CCR5+CD69− population. It has been reported that oral treatment with Maraviroc increases the % of CCR5+ CD4 T cells in the blood(41). This effect is likely the result of Maraviroc stabilizing expression of CCR5 rather than it being internalized following signaling with its ligands. We observed the same phenotypical changes following oral Maraviroc and the topical Maraviroc treatment, indicating that the topical Maraviroc treatment is functional.
These data suggest that Maraviroc treatment may have different effects depending on whether patients have an established TRM compartment or lack a TRM compartment. For example, the CHARM-03 study also included a topical treatment phase to evaluate Maraviroc as an inhibitor of a primary HIV infection. The maintenance of the CCR5+ TRM compartment suggest that Maraviroc does not attenuate CCR5+ CD4 TRM-mediated barrier immunity. This notion of maintaining barrier immunity in the absence of a CCR5-mediated T cell influx into tissue is in line with clinical data from HIV patients that were treated with Maraviroc for 5 years without signs of declining immunity (44).
In contrast, it is possible that CCR5 antagonist treatment in transplant patients lacking an intact TRM compartment due to myeloablative treatment may have long-term negative effects on barrier immunity and tissue homeostasis. Our scRNA-seq data indicate that CCR5+ T cells in the tissue have a distinct transcriptome signature compared to the CCR5− population and suggest that a reseeding of the TRM compartment with CCR5+ T cells is necessary for a balanced composition of TH1 and TH17 cells. Furthermore, the risks of CMV reactivation need to be critically assessed in CCR5 antagonist-treated transplant patients. Other chemotactic cues may be able to compensate for missing CCR5 signals allowing for intact antiviral immunity, but longer-term studies are needed since interfering with CCR5 chemotaxis may delay proper TRM reconstitution thereby increasing the timeframe needed to reach immunocompetence
Finally, we observed remarkable functional stability in the CCR5+ CD4 T cell population with increased inflammation status, as few DE genes were found when samples were stratified by pathology score. Further, CCR5+ T cells have classically been characterized as responding to inflammation, whereas we report that this population is in fact part of the immune network in healthy barrier tissues. One may conclude that inflammation has a limited effect on T cells, which does not seem likely. We prefer the interpretation that T cells in this barrier tissue are exposed to inflammatory cues, even in healthy tissues, and thus amplification of those cues during regular inflammatory processes does not further dramatically alter their transcriptional program. However, we observed an inflammation-associated increase in the total number of CD4 T cells below but not in the epithelial layer, indicating that inflammation-driven changes occur in a spatially-dependent manner and are predominantly quantitative and not qualitative in nature. Of the expanding cells (recruited or proliferating), CCR5+ CD4 T cells made up an increasing proportion, confirming their important contribution to the inflammatory response in peripheral tissue. In contrast, the proportion of CD69+ cells was maintained. An increase of the CD69+ population (containing CCR5+ TRM phenotype cells) along with the CD69− population could ensure that sufficient numbers of Treg and TH17 cells (contained in the CCR5+CD69+ population) are maintained in relation to incoming or proliferating effector CD4 T cells, which may be needed to eventually resolve inflammation. Notably, we observed that the CCR5+ Treg population increased along with the conventional CCR5+ TRM compartment in inflamed tissues. We think this is a critical finding, since a disconnect between the conventional and regulatory T cell populations could lead to pathogenesis. It will be critical to not only examine the effects of CCR5 antagonist treatment, but also the cessation of this treatment on Treg abundance and location in immunocompromised patients, which could lead to an unbalanced restoration of the T cell tissue compartment in regard to the Tconv/Treg ratio.
A limitation to studies - including our data presented here - that are focused on T cells in human tissues is the reliance on biomarkers to extrapolate certain characteristics. In particular, expression of CD69 needs to be interpreted with caution as it is expressed by recently activated T cells and is also used as a biomarker indicating tissue residence. Mouse studies have revealed an antagonistic relationship and inverse cell surface expression of CD69 and the sphingosine 1-phosphate receptor (S1P1) (45–47). Expression of S1P1 by memory T cells leads to re-entry into circulation (48) and thus, expression of CD69 has been used an indicator that T cells are tissue resident. New single-cell technologies such as CITE-seq or Ab-seq that provide a combination of protein and transcript expression data could prove useful in distinguishing between recently activated and tissue resident cells in inflamed tissues.
In summary, our data resolve the seemingly paradoxical observation that CCR5 antagonists can interfere with pathogenic disease processes without affecting barrier immunity. Our study reveals that CCR5+ CD4 T cells are the most abundant cell type in the mucosal TRM compartment and not limited to TH1 responses but feature all key CD4 T cell functions including TH17 and Treg responses. Importantly, we found that in the context of preventing recruitment of T cells via CCR5 in vivo, human mucosa retained a CCR5+ CD4 TRM population. Our data therefore suggest that CCR5 antagonist treatment may have more severe and delayed side effects in regard to susceptibility to infections in patients who lack a TRM compartment as it would interfere with the formation of diverse tissue-transient and -resident T cell populations.
Materials and Methods
Study design
This study was exploratory with the purpose of understanding CD4 T cell dynamics in human oral mucosal tissues. Human oral mucosa was obtained from patients undergoing oral surgery where gingival tissue was removed as a normal part of the procedure. All participants providing oral mucosal samples signed a written informed consent prior to inclusion in the study and the protocols were approved by the institutional review board (IRB) at the Fred Hutchinson Cancer Research Center (8335). Surgical procedures included gingivectomy/gingivoplasty, osseous surgery, implant uncovering and tooth extractions. Samples were collected between 11am and 4pm. Participants were between 14–83 years old (mean = 52), in line with previously published donor populations (49). See Table S1 for more information. Samples sizes were based on availability and because there was no intervention, no blinding or randomization were used. The number of patients included or represented is indicated for each figure. Human rectal tissue was obtained from healthy, HIV-uninfected participants (n=5 male and n=5 female) as part of the CHARM-03 study (ClinicalTrials.gov; NCT02346084). All CHARM-03 participants signed a written informed consent prior to inclusion in the study and the protocol was approved by the IRB (REN18050213) at the University of Pittsburgh. At the time of enrollment, pre-treatment biopsies were collected with large-cup biopsy forceps. Participants then took oral Maraviroc (300mg) for 8 days. 24 hours after the last dose, rectal biopsies were taken. Participants then had a 14–21-day recovery period before beginning 8 days of topical rectal Maraviroc (1% gel) and 24 hours after the last dose rectal biopsies were taken. For n=3 of the female participants, the rectal topical treatment followed a washout period after vaginal topical use – these samples are indicated in the figures. Primary data are reported in data file S1.
Human oral mucosa processing
Fresh tissue was placed immediately into a 50ml conical tube with complete media (RPMI 1640 supplemented with penicillin at 100 U/ml, streptomycin sulfate at 100 μg/ml, and fetal bovine serum (FBS) at 10%). Blood was collected by flushing the exposed surgical site after elevation of the gingiva with sterile saline. Two sterile 5ml syringes with 10-gauge blunt tips were used to collect approximately 10ml of saliva and blood from the oral cavity. Both tissue and blood were kept on wet ice or at 4°C until being processed within 2–4 hours. Cells from mucosal tissue were extracted using an adapted version of a previously published method (50). Briefly, tissues underwent two rounds of enzymatic digestion with collagenase II (Sigma-Aldrich) at 37°C, each followed by mechanical digestion with 30cc syringe and blunt 16-gauge needle. Oral blood was treated with ACK lysing buffer (Gibco) to remove red blood cells.
Human rectal biopsy processing
At each timepoint from each subject, n=6 rectal biopsies were taken and immediately processed for flow cytometry. N=2 biopsies were flash frozen and archived. For the purposed of this study, one of those flash frozen biopsies for each participant at 3 timepoints (pre-treatment, post-oral treatment, and post-topical treatment) was embedded in Tissue-Tek optimal cutting temperature O.C.T.) compound (Sakura Finetek, Thermo Fisher).
Bulk RNA-seq library generation
We performed RNA-seq on 250–1000 sorted CD4+CCR5+ cells from blood or tissue samples as previously described (51). In total, 28 samples were sequenced: 9 from CD69− blood samples, 9 from CD69− tissue samples and 10 from CD69+ tissue samples from a total of 10 subjects. Briefly, cells were sorted directly into SMARTer v4 lysis reagents (Clontech). Cells were lysed and cDNA was synthesized. After amplification, sequencing libraries were prepared using the Nextera XT DNA Library Preparation Kit (Illumina). Barcoded single-cell libraries were pooled and quantified using a Qubit Fluorometer (Life Technologies).
Bulk RNA-seq statistical analysis
A quality filter was applied to retain libraries in which the fraction of aligned reads examined compared to total FASTQ reads was >75%, the median coefficient of variation of coverage was less than 0.8, and the library had at least 1 million reads. All sequenced samples passed these quality filters. Non-protein coding genes, mitochondrial genes, and genes expressed at less than 1 count per million in fewer than 10% of samples were filtered out. Expression counts were normalized using the TMM algorithm (52). For differential gene expression analysis, we used the linear models for microarray data (Limma) R package (53, 54) after Voom transformation (55); this approach either outperforms or is highly concordant with other published methods(56, 57). Linear models comparing blood and tissue sample gene expression and comparing CD69+ and CD69− cells from tissue samples were used. In both models, donor identity was included as a random effect. Genes with a false discovery rate (FDR) of less than 0.05 and expression fold-change of greater than 2 between two blood and tissue samples were considered differentially expressed. STRING was used to identify protein-protein interactions in differentially expressed genes. STRING connects genes according to known or predicted interactions to form a network and can be used to perform enrichment analysis to identify biological processes associated with these networks (31).
Single-cell RNA-seq library generation and sequencing
Freshly isolated cells from blood and tissue were sorted into complete media and processed using the 10X Genomics Platform with the Single-Cell 3’ Reagent (v2) as described previously (58). Sorted populations and total cell numbers loaded into the Chromium Controller: Blood CD4 T cells (4000), Blood CCR5+CD69− CD4 T cells (3000), Blood CD4 Treg (1000), Tissue CCR5+ CD4 T cells (4000), Tissue CCR5− CD4 T cells (4000), Tissue CCR5+CD69− CD4 T cells (4000), Tissue CCR5+CD69+ CD4 T cells (4000) and Tissue CD4 Treg (2000). According to the manufacturer’s instructions, the target cell number for each population was calculated as half the number loaded.
Single-cell RNA-seq data analysis
Sequencing data were processed to read and unique molecular identifier (UMI) counts per cell using the 10X Cell Ranger software, v. 2.1, using default parameters. Reads were converted from BCL to FASTQ format, demultiplexed, filtered, aligned to the genome, collapsed to UMIs, and assigned to barcodes. Barcodes were called as cells vs. background using default settings in Cell Ranger, with target cell numbers as described above. Data from each sample were aggregated without normalizing, as normalization was conducted during downstream analysis.
Count data were analyzed using the Seurat toolset (59). We removed genes detected in < 3 cells, and removed cells with < 200 or > 1800 genes detected, total UMI counts > 6500, or > 10% mitochondrial reads, based on observed breaks in the cell distributions. We log-transformed the UMI counts and regressed out total UMIs and percent mitochondrial reads per cell. We projected the samples using t-distributed stochastic neighbor embedding (tSNE) on the first 10 principal component (PC) axes from 1030 highly variable genes identified using default cuts. To summarize each cell’s expression of defined gene sets, we calculated the mean normalized expression across the set in each cell; to remove noise around 0 introduced by normalization, we restored 0 values for each gene in each cell with a raw UMI count of 0. We quantified differential expression among populations using the hurdle model implemented in MAST(60), with total UMIs per cell as a covariate; MAST has high precision and low false positive rates, and generally identifies DE genes that overlap with those found by other methods (61).
Pathology assessment and scoring
Tissue was processed as described for IF staining (frozen in O.C.T. and 8μm sections were cut) and slides were stained with hematoxylin and eosin (H&E). Histologic sections of oral mucosa (sampled from each patient) were assessed for quality and orientation and excluded if the majority of the epithelium or a representative portion of the lamina propria were not present. All sections were evaluated blinded and scored according to the following criteria (Fig. S1): severity of inflammation (1–5), location of inflammation (lamina propria; diffuse or perivascular; intraepithelial), type of inflammatory infiltrate (mononuclear; neutrophilic), presence of lamina proprial edema and epithelial lesions (degeneration/necrosis, erosion, or ulceration). From these criteria, each sample of oral mucosa was deemed as healthy (inflammation score of 1 and 2) and unhealthy (inflammation score of 3–5). In cases of more than one section representing the sample/patient, the scores were based on the most severely affected regions of all sections.
Statistical analyses
For flow cytometry and IFDP data, a paired t test, linear regression or repeated measures one-way ANOVA with Tukey’s post-test was performed as described in figure legends. Two-sided P-values >0.05 were considered not significant (ns), and values denoted with (*) symbols reflect significance levels as follows: P ≤ 0.05 (*), P ≤ 0.01 (**), P ≤ 0.001 (***), and P ≤ .0001 (****).
Supplementary Material
Supplementary Materials
Fig. S1. Oral mucosa pathology assessment.
Fig. S2. CD4 TRM phenotype and localization in human oral mucosa.
Fig. S3. T cells as a percent of total nucleated cells in healthy oral mucosal tissue.
Fig. S4. CD8 T cell and CD4 T cell changes with inflammation in human oral mucosa.
Fig. S5. Network analysis and GSEA for bulk RNA-seq of CD4 T cells from blood and oral mucosa samples.
Fig. S6. Single-cell RNA-seq.
Fig. S7. CD4 T cell functional potential.
Fig. S8. Impact of the CCR5 antagonist Maraviroc on CD4 T cell subsets in human rectal mucosa.
Table S1. List of donors used in this study.
Table S2. DE gene list comparing CCR5+ CD4 T cells from human blood and oral mucosa from bulk RNA-seq.
Table S3. List of TH17-associated genes used for scRNAseq analysis.
Table S4. List of commercially available antibodies used for IF experiments.
Table S5. List of differentially expressed genes between CCR5+ (fold change up) and CCR5− (fold change down) cells from scRNAseq in human oral mucosa.
Supplemental Material and Methods
Acknowledgements
We thank Veronica Davé for her input on statistical analysis, Dietmar Zehn for his thoughtful feedback on the manuscript, and Yu-Wen Chiu and Jessica Hsu for assistance collecting oral mucosa samples.
Funding
This work was supported by National Institutes of Health (NIH) grants DP2 DE023321 (MP), R01 AI23323 (MP), R21 DE026565 (MP, DRD), T32AI07140 (ASWD), T32 AI007509-16 (CKS) and T32 GM007270 (JDB). ASWD is a Doug and Maggie Walker Fellow. FM is an ISAC scholar. The CHARM-03 study was funded by a U19 grant under the Integrated Preclinical-Clinical Program for HIV Topical Microbicides (IPCP-HTM), Division of AIDS, National Institute of Allergy and Infectious Diseases, NIH (AI082637).
Footnotes
Competing interests
IM is the Chief Medical Officer at and has shares in Orion Biotechnology Canada, he also receives consulting income from Aelix Therapeutics, BTM Products Inc., and Abivax. PSL is a consultant for Bristol-Myers Squibb. All other authors declare no competing interests.
Data and materials availability
All data associated with this study are present in the paper and Supplementary Materials. All sequencing data has been deposited to the GEO (accession #GSE116141). Code files can be found at https://doi.org/10.5281/zenodo.3491122 and on Github https://github.com/BenaroyaResearch/OralMucosa_Woodward_Davis_and_Prlic_Analy sis. Data and tissues from the CHARM03 clinical trial were covered by an MTA between the University of Pittsburgh and the Fred Hutchinson Cancer Research Center.
References and Notes
- 1.Turner DL, Farber DL, Mucosal resident memory CD4 T cells in protection and immunopathology. Front. Immunol 5, 331 (2014)papers3://publication/doi/10.3389/fimmu.2014.00331). [DOI] [PMC free article] [PubMed] [Google Scholar]
- 2.Griffith JW, Sokol CL, Luster AD, Chemokines and chemokine receptors: positioning cells for host defense and immunity. Annu Rev Immunol 32, 659–702 (2014) 10.1146/annurev-immunol-032713-120145). [DOI] [PubMed] [Google Scholar]
- 3.Moy RH, Huffman AP, Richman LP, Crisalli L, Wang XK, Hoxie JA, Mick R, Emerson SG, Zhang Y, Vonderheide RH, Porter DL, Reshef R, Clinical and immunologic impact of CCR5 blockade in graft-versus-host disease prophylaxis. Blood 129, 906–916 (2017); published online EpubFeb 16 ( 10.1182/blood-2016-08-735076). [DOI] [PMC free article] [PubMed] [Google Scholar]
- 4.Halama N, Zoernig I, Berthel A, Kahlert C, Klupp F, Suarez-Carmona M, Suetterlin T, Brand K, Krauss J, Lasitschka F, Lerchl T, Luckner-Minden C, Ulrich A, Koch M, Weitz J, Schneider M, Buechler MW, Zitvogel L, Herrmann T, Benner A, Kunz C, Luecke S, Springfeld C, Grabe N, Falk CS, Jaeger D, Tumoral Immune Cell Exploitation in Colorectal Cancer Metastases Can Be Targeted Effectively by Anti-CCR5 Therapy in Cancer Patients. Cancer Cell 29, 587–601 (2016); published online EpubApr 11 ( 10.1016/j.ccell.2016.03.005). [DOI] [PubMed] [Google Scholar]
- 5.Martin-Blondel G, Brassat D, Bauer J, Lassmann H, Liblau RS, CCR5 blockade for neuroinflammatory diseases--beyond control of HIV. Nat Rev Neurol 12, 95–105 (2016); published online EpubFeb ( 10.1038/nrneurol.2015.248). [DOI] [PubMed] [Google Scholar]
- 6.Reshef R, Luger SM, Hexner EO, Loren AW, Frey NV, Nasta SD, Goldstein SC, Stadtmauer EA, Smith J, Bailey S, Mick R, Heitjan DF, Emerson SG, Hoxie JA, Vonderheide RH, Porter DL, Blockade of lymphocyte chemotaxis in visceral graft-versus-host disease. N Engl J Med 367, 135–145 (2012); published online EpubJul 12 ( 10.1056/NEJMoa1201248). [DOI] [PMC free article] [PubMed] [Google Scholar]
- 7.Reshef R, Ganetsky A, Acosta EP, Blauser R, Crisalli L, McGraw J, Frey NV, Hexner EO, Hoxie JA, Loren AW, Luger SM, Mangan J, Stadtmauer EA, Mick R, Vonderheide RH, Porter DL, Extended CCR5 Blockade for Graft-versus-Host Disease Prophylaxis Improves Outcomes of Reduced-Intensity Unrelated Donor Hematopoietic Cell Transplantation: A Phase II Clinical Trial. Biol Blood Marrow Transplant, (2018); published online EpubOct 10 ( 10.1016/j.bbmt.2018.09.034). [DOI] [PMC free article] [PubMed] [Google Scholar]
- 8.Fatkenheuer G, Pozniak AL, Johnson MA, Plettenberg A, Staszewski S, Hoepelman AI, Saag MS, Goebel FD, Rockstroh JK, Dezube BJ, Jenkins TM, Medhurst C, Sullivan JF, Ridgway C, Abel S, James IT, Youle M, van der Ryst E, Efficacy of short-term monotherapy with maraviroc, a new CCR5 antagonist, in patients infected with HIV-1. Nat Med 11, 1170–1172 (2005); published online EpubNov ( 10.1038/nm1319). [DOI] [PubMed] [Google Scholar]
- 9.Kim MB, Giesler KE, Tahirovic YA, Truax VM, Liotta DC, Wilson LJ, CCR5 receptor antagonists in preclinical to phase II clinical development for treatment of HIV. Expert Opin Investig Drugs 25, 1377–1392 (2016); published online EpubDec ( 10.1080/13543784.2016.1254615). [DOI] [PMC free article] [PubMed] [Google Scholar]
- 10.Patterson SJ, Pesenacker AM, Wang AY, Gillies J, Mojibian M, Morishita K, Tan R, Kieffer TJ, Verchere CB, Panagiotopoulos C, Levings MK, T regulatory cell chemokine production mediates pathogenic T cell attraction and suppression. J Clin Invest 126, 1039–1051 (2016); published online EpubMar 1 ( 10.1172/JCI83987). [DOI] [PMC free article] [PubMed] [Google Scholar]
- 11.Weehuizen JM, Wensing AMJ, Mudrikova T, Wit FWNM, Hoepelman AIM, Efficacy and safety of long-term maraviroc use in a heterogeneous group of HIV-infected patients: A retrospective cohort study. Int. J. Antimicrob. Agents 54, 215–222 (2019)papers3://publication/doi/10.1016/j.ijantimicag.2019.02.018). [DOI] [PubMed] [Google Scholar]
- 12.Loetscher P, Uguccioni M, Bordoli L, Baggiolini M, Moser B, Chizzolini C, Dayer JM, CCR5 is characteristic of Th1 lymphocytes. Nature 391, 344–345 (1998); published online EpubJan 22 ( 10.1038/34812). [DOI] [PubMed] [Google Scholar]
- 13.Murphy K, Weaver C, Janeway’s Immunobiology. (CRC Press, Boca Raton, FL: ed. 9, 2016). [Google Scholar]
- 14.Clark RA, Watanabe R, Teague JE, Schlapbach C, Tawa MC, Adams N, Dorosario AA, Chaney KS, Cutler CS, LeBoeuf NR, Carter JB, Fisher DC, Kupper TS, Skin effector memory T cells do not recirculate and provide immune protection in alemtuzumab-treated CTCL patients. Science Translational Medicine 4, 1–10 (2012)papers3://publication/doi/10.1126/scitranslmed.3003008). [DOI] [PMC free article] [PubMed] [Google Scholar]
- 15.Sathaliyawala T, Kubota M, Yudanin N, Turner D, Camp P, Thome JJC, Bickham KL, Lerner H, Goldstein M, Sykes M, Kato T, Farber DL, Distribution and compartmentalization of human circulating and tissue-resident memory T cell subsets. Immunity 38, 187–197 (2013)papers3://publication/doi/10.1016/j.immuni.2012.09.020). [DOI] [PMC free article] [PubMed] [Google Scholar]
- 16.Kumar BV, Connors TJ, Farber DL, Human T cell development, localization, and function throughout life. Immunity 48, 202–213 (2018)papers3://publication/doi/10.1016/j.immuni.2018.01.007). [DOI] [PMC free article] [PubMed] [Google Scholar]
- 17.Carbone FR, Tissue-resident memory T cells and fixed immune surveillance in nonlymphoid organs. J. Immunol 195, 17–22 (2015)papers3://publication/doi/10.4049/jimmunol.1500515). [DOI] [PubMed] [Google Scholar]
- 18.Wakim LM, Waithman J, van Rooijen N, Heath WR, Carbone FR, Dendritic cell-induced memory T cell activation in nonlymphoid tissues. Science 319, 198–202 (2008)papers3://publication/doi/10.1016/S1074-7613(03)00112-2). [DOI] [PubMed] [Google Scholar]
- 19.Zhu J, Hladik F, Woodward A, Klock A, Peng T, Johnston C, Remington M, Magaret A, Koelle DM, Wald A, Corey L, Persistence of HIV-1 receptor–positive cells after HSV-2 reactivation is a potential mechanism for increased HIV-1 acquisition. Nature Medicine 15, 886–892 (2009)papers3://publication/doi/10.1038/nm.2006). [DOI] [PMC free article] [PubMed] [Google Scholar]
- 20.Belkaid Y, Tamoutounour S, The influence of skin microorganisms on cutaneous immunity. Nat Rev Immunol 16, 353–366 (2016)papers3://publication/doi/10.1038/nri.2016.48). [DOI] [PubMed] [Google Scholar]
- 21.Turner DL, Farber DL, Mucosal resident memory CD4 T cells in protection and immunopathology. Front Immunol 5, 331 (2014) 10.3389/fimmu.2014.00331). [DOI] [PMC free article] [PubMed] [Google Scholar]
- 22.Dutzan N, Konkel JE, Greenwell-Wild T, Moutsopoulos NM, Characterization of the human immune cell network at the gingival barrier. Mucosal Immunol 9, 1163–1172 (2016)papers3://publication/doi/10.1038/mi.2015.136). [DOI] [PMC free article] [PubMed] [Google Scholar]
- 23.Darveau RP, Periodontitis: a polymicrobial disruption of host homeostasis. Nature Reviews Microbiology 2010 8, 481–490 (2010)papers3://publication/doi/10.1038/nrmicro2337). [DOI] [PubMed] [Google Scholar]
- 24.Moutsopoulos NM, Moutsopoulos HM, The oral mucosa: A barrier site participating in tissue-specific and systemic immunity. Oral Diseases 24, 22–25 (2018)papers3://publication/doi/10.1111/odi.12729). [DOI] [PubMed] [Google Scholar]
- 25.Nowarski R, Jackson R, Flavell RA, The stromal intervention: Regulation of immunity and inflammation at the epithelial-mesenchymal barrier. Cell 168, 362–375 (2017)papers3://publication/doi/10.1016/j.cell.2016.11.040). [DOI] [PubMed] [Google Scholar]
- 26.Steinert E, Schenkel JM, Fraser KA, Beura LK, Manlove LS, Igyarto BZ, Southern PJ, Masopust D, Quantifying memory CD8 T cells reveals regionalization of immunosurveillance. Cell 161, 737–749 (2015)papers3://publication/doi/10.1016/j.cell.2015.03.031). [DOI] [PMC free article] [PubMed] [Google Scholar]
- 27.Lund JM, Hsing L, Pham TT, Rudensky AY, Coordination of early protective immunity to viral infection by regulatory T cells. Science 320, 1220–1224 (2008); published online EpubMay 30 ( 10.1126/science.1155209). [DOI] [PMC free article] [PubMed] [Google Scholar]
- 28.Miyara M, Yoshioka Y, Kitoh A, Shima T, Wing K, Niwa A, Parizot C, Taflin C, Heike T, Valeyre D, Mathian A, Nakahata T, Yamaguchi T, Nomura T, Ono M, Amoura Z, Gorochov G, Sakaguchi S, Functional Delineation and Differentiation Dynamics of Human CD4+ T Cells Expressing the FoxP3 Transcription Factor. Immunity 30, 899–911 (2009)papers3://publication/doi/10.1016/j.immuni.2009.03.019). [DOI] [PubMed] [Google Scholar]
- 29.Kumar V, Abbas AK, Aster JC, Robbins & Cotran Pathologic Basis of Disease. Chapter 3 (Elsevier/Saunders, Philadelphia, 2015). [Google Scholar]
- 30.Wu R-Q, Zhang D-F, Tu E, Chen Q-M, Chen W, The mucosal immune system in the oral cavity—an orchestra of T cell diversity. International Journal of Oral Science 2014 6:3 6, 125–132 (2014)papers3://publication/doi/10.1038/ijos.2014.48). [DOI] [PMC free article] [PubMed] [Google Scholar]
- 31.Szklarczyk D, Gable AL, Lyon D, Junge A, Wyder S, Huerta-Cepas J, Simonovic M, Doncheva NT, Morris JH, Bork P, Jensen LJ, von Mering C, STRING v11: protein–protein association networks with increased coverage, supporting functional discovery in genome-wide experimental datasets. Nucleic Acids Research 47, D607–D613 (2019)papers3://publication/doi/10.1093/nar/gky1131). [DOI] [PMC free article] [PubMed] [Google Scholar]
- 32.Subramanian A, Tamayo P, Mootha VK, Mukherjee S, Ebert BL, Gillette MA, Paulovich A, Pomeroy SL, Golub TR, Lander ES, Mesirov JP, Gene set enrichment analysis: A knowledge-based approach for interpreting genome-wide expression profiles. Proc. Natl. Acad. Sci. U.S.A 102, 15545–15550 (2005)papers3://publication/doi/10.1093/bioinformatics/btg363). [DOI] [PMC free article] [PubMed] [Google Scholar]
- 33.Kumar BV, Ma W, Miron M, Granot T, Guyer RS, Carpenter DJ, Senda T, Sun X, Ho S-H, Lerner H, Friedman AL, Shen Y, Farber DL, Human tissue-resident memory T cells are defined by core transcriptional and functional signatures in lymphoid and mucosal sites. Cell Reports 20, 2921–2934 (2017)papers3://publication/doi/10.1016/j.celrep.2017.08.078). [DOI] [PMC free article] [PubMed] [Google Scholar]
- 34.Milner JJ, Toma C, Yu B, Zhang K, Omilusik K, Phan AT, Wang D, Getzler AJ, Nguyen T, Crotty S, Wang W, Pipkin ME, Goldrath AW, Runx3 programs CD8+ T cell residency in non-lymphoid tissues and tumours. Nature 552, 253–257 (2017)papers3://publication/doi/10.1038/nature24993). [DOI] [PMC free article] [PubMed] [Google Scholar]
- 35.Watanabe R, Gehad A, Yang C, Scott LL, Teague JE, Schlapbach C, Elco CP, Huang V, Matos TR, Kupper TS, Clark RA, Human skin is protected by four functionally and phenotypically discrete populations of resident and recirculating memory T cells. Science Translational Medicine 7, 1–13 (2015)papers3://publication/doi/10.1126/scitranslmed.3010302). [DOI] [PMC free article] [PubMed] [Google Scholar]
- 36.Park CO, Fu X, Jiang X, Pan Y, Teague JE, Collins N, Tian T, O’Malley JT, Emerson RO, Kim JH, Jung Y, Watanabe R, Fuhlbrigge RC, Carbone FR, Gebhardt T, Clark RA, Lin CP, Kupper TS, Staged development of long-lived T-cell receptor αβ TH17 resident memory T-cell population to Candida albicans after skin infection. Journal of Allergy and Clinical Immunology 142, 647–662 (2018)papers3://publication/doi/10.1016/j.jaci.2017.09.042). [DOI] [PMC free article] [PubMed] [Google Scholar]
- 37.Oja AE, Piet B, Helbig C, Stark R, van der Zwan D, Blaauwgeers H, Remmerswaal EBM, Amsen D, Jonkers RE, Moerland PD, Nolte MA, van Lier RAW, Hombrink P, Trigger-happy resident memory CD4+ T cells inhabit the human lungs. Mucosal Immunol 11, 654–667 (2018)papers3://publication/doi/10.1038/mi.2017.94). [DOI] [PubMed] [Google Scholar]
- 38.Mackay LK, Kallies A, Transcriptional Regulation of Tissue-Resident Lymphocytes. Trends Immunol 38, 94–103 (2017); published online EpubFeb ( 10.1016/j.it.2016.11.004). [DOI] [PubMed] [Google Scholar]
- 39.Martin MD, Jensen IJ, Ishizuka AS, Lefebvre M, Shan Q, Xue HH, Harty JT, Seder RA, Badovinac VP, Bystander responses impact accurate detection of murine and human antigen-specific CD8 T cells. J Clin Invest 130, 3894–3908 (2019); published online EpubJun 20 ( 10.1172/JCI124443). [DOI] [PMC free article] [PubMed] [Google Scholar]
- 40.Secchiero P, Zella D, Curreli S, Mirandola P, Capitani S, Gallo RC, Zauli G, Engagement of CD28 modulates CXC chemokine receptor 4 surface expression in both resting and CD3-stimulated CD4+ T cells. J Immunol 164, 4018–4024 (2000); published online EpubApr 15 ( 10.4049/jimmunol.164.8.4018). [DOI] [PubMed] [Google Scholar]
- 41.Hunt PW, Shulman NS, Hayes TL, Dahl V, Somsouk M, Funderburg NT, McLaughlin B, Landay AL, Adeyemi O, Gilman LE, Clagett B, Rodriguez B, Martin JN, Schacker TW, Shacklett BL, Palmer S, Lederman MM, Deeks SG, The immunologic effects of maraviroc intensification in treated HIVinfected individuals with incomplete CD4+ T-cell recovery: a randomized trial. Blood 121, 4635–4646 (2013)papers3://publication/doi/10.1182/blood-2012-06-436345). [DOI] [PMC free article] [PubMed] [Google Scholar]
- 42.Hammarlund E, Lewis MW, Hansen SG, Strelow LI, Nelson JA, Sexton GJ, Hanifin JM, Slifka MK, Duration of antiviral immunity after smallpox vaccination. Nat Med 9, 1131–1137 (2003); published online EpubSep ( 10.1038/nm917). [DOI] [PubMed] [Google Scholar]
- 43.Klonowski KD, Williams KJ, Marzo AL, Blair DA, Lingenheld EG, Lefrancois L, Dynamics of Blood-Borne CD8 Memory T Cell Migration In Vivo. Immunity 20, 551–562 (2004)papers3://publication/doi/10.1016/S1074-7613(04)00103-7). [DOI] [PubMed] [Google Scholar]
- 44.Cooper DA, Heera J, Ive P, Botes M, Dejesus E, Burnside R, Clumeck N, Walmsley S, Lazzarin A, Mukwaya G, Saag M, van Der Ryst E, Efficacy and safety of maraviroc vs. efavirenz in treatment-naive patients with HIV-1: 5-year findings. AIDS 28, 717–725 (2014); published online EpubMar 13 ( 10.1097/QAD.0000000000000131). [DOI] [PMC free article] [PubMed] [Google Scholar]
- 45.Bankovich AJ, Shiow LR, Cyster JG, CD69 suppresses sphingosine 1-phosophate receptor-1 (S1P1) function through interaction with membrane helix 4. J Biol Chem 285, 22328–22337 (2010); published online EpubJul 16 ( 10.1074/jbc.M110.123299). [DOI] [PMC free article] [PubMed] [Google Scholar]
- 46.Shiow LR, Rosen DB, Brdickova N, Xu Y, An J, Lanier LL, Cyster JG, Matloubian M, CD69 acts downstream of interferon-alpha/beta to inhibit S1P1 and lymphocyte egress from lymphoid organs. Nature 440, 540–544 (2006); published online EpubMar 23 ( 10.1038/nature04606). [DOI] [PubMed] [Google Scholar]
- 47.Mackay LK, Braun A, Macleod BL, Collins N, Tebartz C, Bedoui S, Carbone FR, Gebhardt T, Cutting edge: CD69 interference with sphingosine-1-phosphate receptor function regulates peripheral T cell retention. J Immunol 194, 2059–2063 (2015); published online EpubMar 1 ( 10.4049/jimmunol.1402256). [DOI] [PubMed] [Google Scholar]
- 48.Skon CN, Lee JY, Anderson KG, Masopust D, Hogquist KA, Jameson SC, Transcriptional downregulation of S1pr1 is required for the establishment of resident memory CD8+ T cells. Nat Immunol 14, 1285–1293 (2013); published online EpubDec ( 10.1038/ni.2745). [DOI] [PMC free article] [PubMed] [Google Scholar]
- 49.Thome JJC, Yudanin N, Ohmura Y, Kubota M, Grinshpun B, Sathaliyawala T, Kato T, Lerner H, Shen Y, Farber DL, Spatial Map of Human T Cell Compartmentalization and Maintenance over Decades of Life. Cell 159, 814–828 (2014)papers3://publication/doi/10.1016/j.cell.2014.10.026). [DOI] [PMC free article] [PubMed] [Google Scholar]
- 50.McKinnon LR, Hughes SM, De Rosa SC, Martinson JA, Plants J, Brady KE, Gumbi PP, Adams DJ, Vojtech L, Galloway CG, Fialkow M, Lentz G, Gao D, Shu Z, Nyanga B, Izulla P, Kimani J, Kimwaki S, Bere A, Moodie Z, Landay AL, Passmore J-AS, Kaul R, Novak RM, McElrath MJ, Hladik F, Optimizing viable leukocyte sampling from the female genital tract for clinical trials: an international multi-site study. PLOS ONE 9, 1–11 (2014)papers3://publication/doi/10.1371/journal.pone.0085675). [DOI] [PMC free article] [PubMed] [Google Scholar]
- 51.Voillet V, Buggert M, Slichter CK, Berkson JD, Mair F, Addison MM, Dori Y, Nadolski G, Itkin MG, Gottardo R, Betts MR, Prlic M, Human MAIT cells exit peripheral tissues and recirculate via lymph in steady state conditions. The Journal of Clinical Investigation 3, (2018)papers3://publication/doi/10.1172/jci.insight.98487). [DOI] [PMC free article] [PubMed] [Google Scholar]
- 52.Robinson MD, Oshlack A, A scaling normalization method for differential expression analysis of RNA-seq data. Genome Biology 11, R25 (2010) 10.1186/gb-2010-11-3-r25). [DOI] [PMC free article] [PubMed] [Google Scholar]
- 53.Liu R, Holik AZ, Su S, Jansz N, Chen K, Leong HS, Blewitt ME, Asselin-Labat M-L, Smyth GK, Ritchie ME, Why weight? Modelling sample and observational level variability improves power in RNA-seq analyses. Nucleic Acids Research 43, e97–e97 (2015); published online EpubAug 27 ( 10.1093/nar/gkv412). [DOI] [PMC free article] [PubMed] [Google Scholar]
- 54.Ritchie ME, Phipson B, Wu D, Hu Y, Law CW, Shi W, Smyth GK, limma powers differential expression analyses for RNA-sequencing and microarray studies. Nucleic Acids Research 43, e47–e47 (2015); published online EpubJan 20 ( 10.1093/nar/gkv007). [DOI] [PMC free article] [PubMed] [Google Scholar]
- 55.Law CW, Chen Y, Shi W, Smyth GK, voom: precision weights unlock linear model analysis tools for RNA-seq read counts. Genome Biology 15, 1–17 (2014)papers3://publication/doi/10.1186/gb-2014-15-2-r29). [DOI] [PMC free article] [PubMed] [Google Scholar]
- 56.Costa-Silva J, Domingues D, Martins Lopes F, RNA-Seq differential expression analysis: An extended review and a software tool. PLOS ONE 12, e0190152–e0190152 (2017)papers3://publication/doi/10.1371/journal.pone.0190152). [DOI] [PMC free article] [PubMed] [Google Scholar]
- 57.Soneson C, Delorenzi M, A comparison of methods for differential expression analysis of RNA-seq data. BMC Bioinformatics 14, 621 (2013)papers3://publication/doi/10.1186/1471-2105-14-91). [DOI] [PMC free article] [PubMed] [Google Scholar]
- 58.Zheng GXY, Terry JM, Belgrader P, Ryvkin P, Bent ZW, Wilson R, Ziraldo SB, Wheeler TD, McDermott GP, Zhu J, Gregory MT, Shuga J, Montesclaros L, Underwood JG, Masquelier DA, Nishimura SY, Schnall-Levin M, Wyatt PW, Hindson CM, Bharadwaj R, Wong A, Ness KD, Beppu LW, Deeg HJ, McFarland C, Loeb KR, Valente WJ, Ericson NG, Stevens EA, Radich JP, Mikkelsen TS, Hindson BJ, Bielas JH, Massively parallel digital transcriptional profiling of single cells. Nat Comms 8, 14049 (2017)papers3://publication/doi/10.1182/blood-2015-01-621631). [DOI] [PMC free article] [PubMed] [Google Scholar]
- 59.Butler A, Hoffman P, Smibert P, Papalexi E, Satija R, Integrating single-cell transcriptomic data across different conditions, technologies, and species. Nat Biotechnol 36, 411–420 (2018)papers3://publication/doi/10.1038/nbt.4096). [DOI] [PMC free article] [PubMed] [Google Scholar]
- 60.Finak G, McDavid A, Yajima M, Deng J, Gersuk V, Shalek AK, Slichter CK, Miller HW, McElrath MJ, Prlic M, Linsley PS, Gottardo R, MAST: a flexible statistical framework for assessing transcriptional changes and characterizing heterogeneity in single-cell RNA sequencing data. Genome Biology 16, 278 (2015)papers3://publication/doi/10.1186/s13059-015-0844-5). [DOI] [PMC free article] [PubMed] [Google Scholar]
- 61.Wang T, Li B, Nelson CE, Nabavi S, Comparative analysis of differential gene expression analysis tools for single-cell RNA sequencing data. BMC Bioinformatics 20, 31 (2019)papers3://publication/doi/10.1186/s12859-019-2599-6). [DOI] [PMC free article] [PubMed] [Google Scholar]
- 62.Mack M, Luckow B, Nelson PJ, Cihak J, Simmons G, Clapham PR, Signoret N, Marsh M, Stangassinger M, Borlat F, Wells TN, Schlöndorff D, Proudfoot AE, Aminooxypentane-RANTES induces CCR5 internalization but inhibits recycling: a novel inhibitory mechanism of HIV infectivity. Journal of Experimental Medicine 187, 1215–1224 (1998)papers3://publication/doi/10.1084/jem.187.8.1215). [DOI] [PMC free article] [PubMed] [Google Scholar]
- 63.Langmead B, Trapnell C, Pop M, Salzberg SL, Ultrafast and memory-efficient alignment of short DNA sequences to the human genome. Genome Biology 10, 1–10 (2009)papers3://publication/doi/10.1186/gb-2009-10-3-r25). [DOI] [PMC free article] [PubMed] [Google Scholar]
- 64.Giardine B, Galaxy: A platform for interactive large-scale genome analysis. Genome Research 15, 1451–1455 (2005)papers3://publication/doi/10.1101/gr.4086505). [DOI] [PMC free article] [PubMed] [Google Scholar]
- 65.Trapnell C, Schatz MC, Optimizing Data Intensive GPGPU Computations for DNA Sequence Alignment. Parallel Computing 35, 429–440 (2009); published online EpubAug ( 10.1016/j.parco.2009.05.002). [DOI] [PMC free article] [PubMed] [Google Scholar]
- 66.Anders S, Pyl PT, Huber W, HTSeq--a Python framework to work with high-throughput sequencing data. Bioinformatics 31, 166–169 (2015); published online EpubJan 08 ( 10.1093/bioinformatics/btu638). [DOI] [PMC free article] [PubMed] [Google Scholar]
Associated Data
This section collects any data citations, data availability statements, or supplementary materials included in this article.
Supplementary Materials
Supplementary Materials
Fig. S1. Oral mucosa pathology assessment.
Fig. S2. CD4 TRM phenotype and localization in human oral mucosa.
Fig. S3. T cells as a percent of total nucleated cells in healthy oral mucosal tissue.
Fig. S4. CD8 T cell and CD4 T cell changes with inflammation in human oral mucosa.
Fig. S5. Network analysis and GSEA for bulk RNA-seq of CD4 T cells from blood and oral mucosa samples.
Fig. S6. Single-cell RNA-seq.
Fig. S7. CD4 T cell functional potential.
Fig. S8. Impact of the CCR5 antagonist Maraviroc on CD4 T cell subsets in human rectal mucosa.
Table S1. List of donors used in this study.
Table S2. DE gene list comparing CCR5+ CD4 T cells from human blood and oral mucosa from bulk RNA-seq.
Table S3. List of TH17-associated genes used for scRNAseq analysis.
Table S4. List of commercially available antibodies used for IF experiments.
Table S5. List of differentially expressed genes between CCR5+ (fold change up) and CCR5− (fold change down) cells from scRNAseq in human oral mucosa.
Supplemental Material and Methods