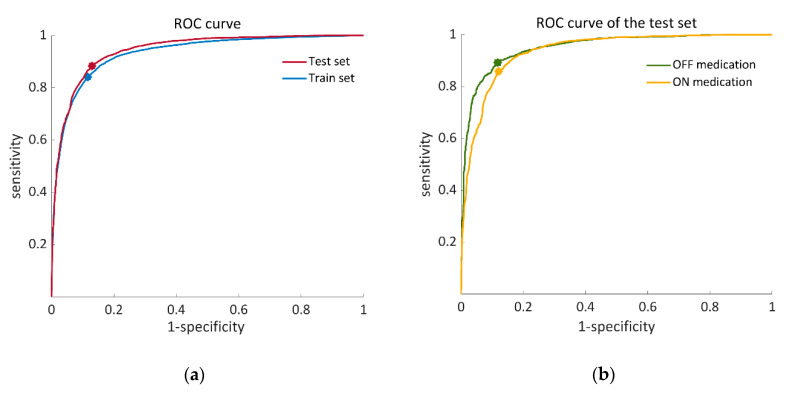
Figure 4.
ROC (receiver operating characteristic) curves that illustrate the performance of the proposed SVM classifier. (a) Training set (blue) calculated from 57 iterations of a leave-one-patient-out validation process, AUC = 0.93, OOP: (0.12, 0.84). Test set (red), AUC = 0.94, OOP: (0.13, 0.88); (b) ROC curves of the OFF–ON states in the test set. OFF state (green), AUC = 0.95 OOP: (0.12, 0.89). ON state (yellow), AUC = 0.94: OOP: (0.12, 0.86). AUC, area under the curve; OOP, optimal operation point.

