Fig. 3.
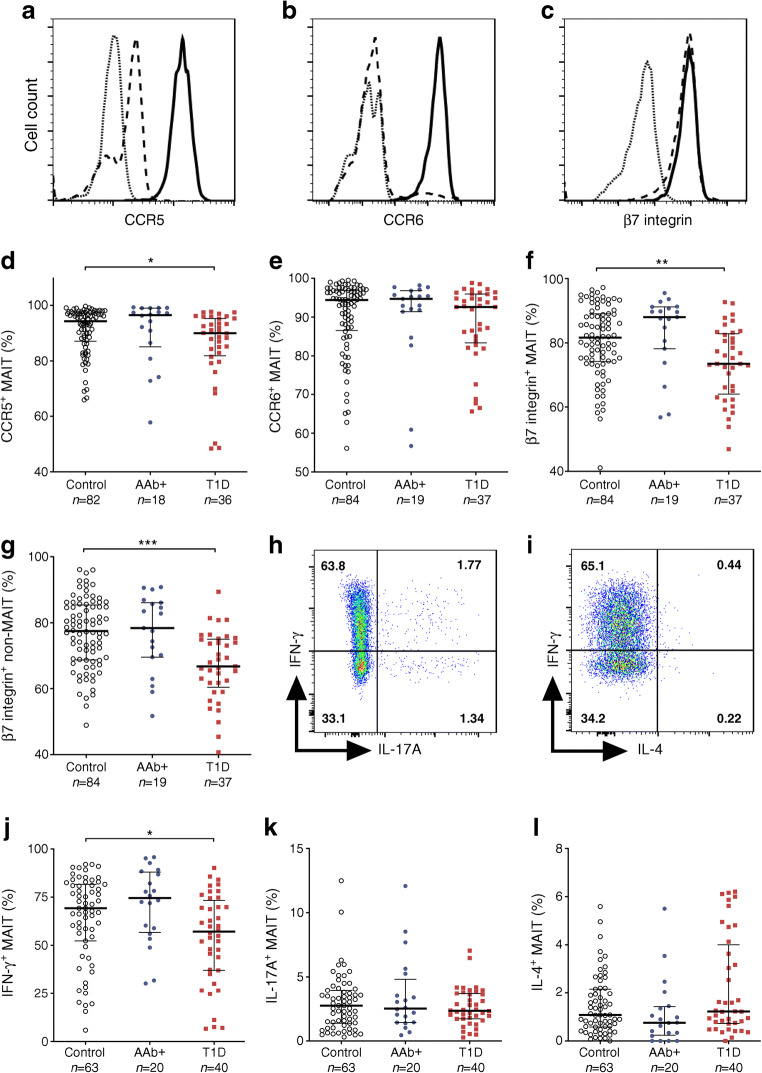
Lower expression of CCR5, β7 integrin and IFN-γ on MAIT cells from children with newly diagnosed type 1 diabetes (T1D). Representative examples of CCR5 (a), CCR6 (b) and β7 integrin (c) staining in fluorescence minus one (FMO) control (dotted lines), non-MAIT T cells (dashed lines) and MAIT cells (solid lines). Frequencies of CCR5+ (d), CCR6+ (e) and β7 integrin+ (f) MAIT cells as well as β7 integrin+ non-MAIT T cells (g) in control, AAb+ and T1D groups. Representative examples of IFN-γ, IL-17A and IL-4 production by MAIT cells (h, i). Frequencies of IFN-γ+ (j), IL-17A+ (k) and IL-4+ (l) MAIT cells in control, AAb+ and T1D groups. (d–g, j–l) Median values with IQRs are shown. *p < 0.05, **p < 0.01, ***p < 0.001; Kruskal–Wallis test with Dunn’s post hoc test

